Service Quality on 41 Keele: Fall 2019 Update

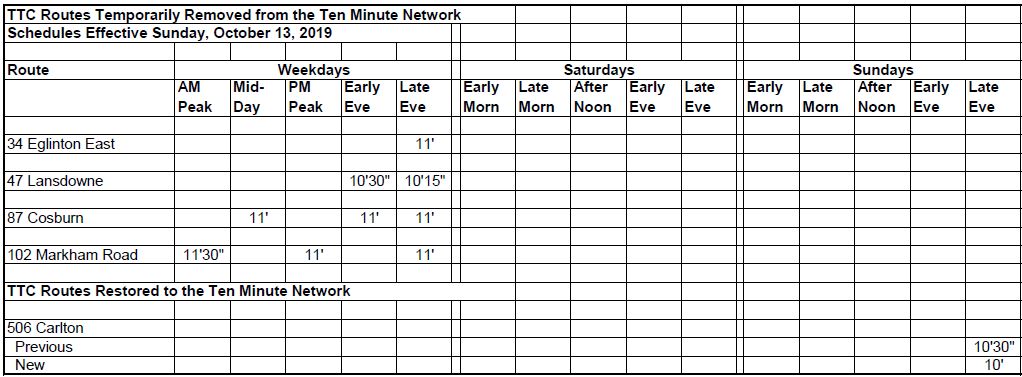
At the TTC Board Meeting of September 24, 2019, a motion was introduced by Commissioners Shelley Carroll and Brad Bradford on behalf of Councillor James Pasternak in response to a citizens’ group, Action Keele, who have many requests regarding changes to the service on the 41/941 Keele bus routes. Two deputations from Action Keele, Matt Davis and Paul Grey, spoke to the request:

  • a. Include the #41 Keele bus route on the 10 Minute Network.
  • b. Increase the intervals for the green light facing west, at St. Clair Ave. and Old Weston Rd for easier turning maneuvers.
  • c. Move the Sir William Hearst bus stop further north to avoid extra congestion with vehicles accessing and exiting Highway 401.
  • d. Restrict the right-hand lanes, both northbound and southbound, at the Keele St. and Wilson Ave. intersection, to right turn only lanes, for better access of buses to the stops.
  • e. Add more vehicles to the local (not express) #41 Keele route to facilitate access to the network for individuals facing accessibility and mobility constraints.
  • f. Limit the main #41 Keele bus route to operate between Keele Station and Finch West Station and consider adding a #41B Keele bus route to operate less frequently from Keele Station to Pioneer Station.

Matt Davis noted that these proposals come from riders and staff, and that Action Keele had spent much of the year on surveys. He said that TTC data ranks Keele low on reliability, and riders complain about crowding and long waits.

Grey continued this theme stating that one of the main recommendations is the first, that Keele have 10 minute or better service all of the time. A consistent issue from riders at all stops was the frequency of service. One night of a survey during the coldest part of last winter, they canvassed at Keele and Lawrence where 10 people were huddled inside a shelter anticipating 20-30 minute waits for a bus.

That is not service that attracts riders, but rather drives away any who can afford to avoid it by moving or by getting a car.

Commissioner Carroll, although she presented the motion, was somewhat hostile to the deputants saying that their list of changes may or may not be implemented, and hoping that they understood there were financial impacts to this. Grey replied that there is a certain expertise gained in daily riding and operating on a route, and Action Keele thinks they have done their due diligence to produce helpful recommendations.

Vice Chair Alan Heisey asked staff if items b through d fell under the city’s Transportation Department. They do, and this part of the request would have to be dealt with there, although the TTC could provide an advocacy role as they claim to be interested in transit priority.

As for the service design, staff replied that they would review this route as part of their service plan, that there had been a service reliability improvement in September, and that they would report back. Furthermore, Keele and Lawrence has been identified as a “super stop” in the new plan now under development.

This sounds good, but it is a misleading response.

The service change in September consisted of stretching the running time allegedly so that buses could stay on schedule, but without adding vehicles so that headways actually became noticeably wider (see service history below). The reliability of service remains spotty as a review of vehicle monitoring data shows.

The TTC has a cultural inability to recognize that service does not operate on a reliable headway, and that bunching and gaps will not be fixed simply by padding running times. On routes like Keele where the scheduled service is infrequent, bunching can cause very wide gaps in service even though all of the scheduled trips are operated and few or no buses are short turned.

Commissioner Jennifer McKelvie asked when the five year service review coming back to the board. Staff replied that this will be in December 2019, and will be a “big picture” review to set up the plan for implementation. Changes will come in following years as the multi-year plan is updated. McKelvie was concerned that ad hoc requests from the community for service would be lost in this process.

Commissioner Carroll observed that requests from a local community to the TTC Board are not precedent setting giving the example of the Dufferin bus. Councillors who do not sit on the board historically bring forward concerns this way. Keele has been a problem every term of Council for a long time. Carroll mentioned demand at York University, although she missed the point that there is much demand on the Keele route that is completely separate from the university which now has two subway stations. Carroll emphasized that the Board wants engagement at this level saying “I don’t want to crap over that level of engagement”.

The request was referred to staff for consideration as part of the Service Plan on December 19.

Prologue

This is a long article with a lot of detail intended for those advocating for better service on Keele Street, and to balance TTC claims that it has “improved” service with new schedules in September 2019. Some readers don’t want all this detail, and you can bail out when it gets tedious. I won’t mind.

Several issues common to Keele and other routes are evident here:

  • Service does not leave terminals within the TTC’s 6-minute target, and irregular headways are common even where buses are supposed to be “on time”.
  • Service gets even worse as vehicles move along the route and closely spaced buses catch up to each other leaving wide gaps behind them.
  • TTC only measures service quality at terminals and, therefore, reports only on the best case situation along a route.
  • Service quality varies enormously by time of day and day of the week, but TTC reports only average values thereby burying the poor performance of the worst periods.
  • Express service runs on erratic headways which counter the supposed benefit of a faster trip.
  • Padding schedules with extra running and recovery time does not guarantee reliable service.

Some of 41 Keele’s problems are worsened by the use of articulated buses on wide headways. These vehicles were purchased for frequent routes like Finch West and they are out of place on Keele where they contribute to the very wide headways and the fact that this major route is not part of the Ten Minute Network. Unofficially, I have learned that there are plans to move the artics back to 7 Bathurst and change the 41 Keele local service to use standard sized buses with a concurrent reduction in headways. However, without an attention to service reliability, riders on Keele will still suffer.

To this I must add that TTC’s portrayal of service “improvements” work counter to the goal of both better service and a higher regard for the TTC. Schedule changes that make service worse for riders, not to mention “new” express services that are nothing more than a rebranding exercise, might play well with TTC Board members who do not look at the details. However, real improvements require better management of service on the street, an end to laissez-faire attitudes about bunching and the band-aid “fix” of extended running times, and a recognition that Toronto needs more service, not just tinkering for the sake of appearances.

Continue reading

The Ford/Tory Subway Plan: Part II – Technical Appendices

In the first of two articles, A Big Announcement, or a Transit Three Card Monte?, I reviewed the proposed agreement between Ontario and Toronto whereby the Province would build four lines or extensions at no capital cost to the City, and ownership of the existing system would remain in City hands. This has been hailed as something of a “peace in our time” solution to the contentious relationship between Premier Ford and the City, but there are many outstanding issues that will not be resolved before the City signs on to the new deal.

In this article, I turn to three appendices to the City report, specifically:

Citations in this article are in the format [A3, p5] where “A3” is the attachment number and “p5” is the page number.

Reading through these documents, I was struck by how an essential section is buried right at the end of Attachment 4: the City/TTC evaluation of the Metrolinx Initial Business Case for the Ontario Line.

The main report is enthusiastic about the viability of the proposals and the contributions they will make to the City of Toronto. However, the attachments reveal the degree to which the scheme is far from complete or settled. There is a caveat that if the proposals change significantly, then the gushing support for the new plans could become only a trickle. But the political pressure is for the City to commit to the scheme, whatever it may become, in the rush to “get shovels in the ground”.

This is a long article intended to pull key points out of the technical discussion of proposed new lines in an attempt to highlight the major chunks without requiring readers to wade through every page (although the keen ones among you certainly will, I’m sure).

Timing of Market Calls for Procurement / Public Participation

The City/TTC have not received a detailed schedule from Metrolinx, however the Infrastructure Ontario Fall update includes the following timelines:

  • Ontario Line: RFQ Spring 2020, RFP Summer/Fall 2020
  • L2EE: RFQ Winter/Spring 2021, RFP Summer/Fall 2021
  • YSE: RFQ Fall 2021, RFP Spring 2022
  • EWLRT: To be determined [A3, p12]

This is aggressive for the OL and gives very little chance for substantive change before the RFP goes out. “Public participation” will be minimal in the best Metrolinx tradition.

The opportunity for feedback and input throughout a project’s development may differ given the anticipated P3 delivery model. Details regarding the Province’s proposed approach are provided as Attachment 11 to this report. City and TTC will continue to advocate for meaningful public consultation on provincial transit projects. [A3 p11]

There are conflicting priorities in completing work regarding the new design and changes to the Assessment with the desire for an expedited delivery process.

Q22: Has an assessment of construction-related impacts been undertaken as part of the preliminary planning and design? What about impacts on community, businesses, traffic congestion, noise, etc.? If not, when will this occur and be factored into decisions on build methodology, procurement, and a program for business and community supports?

A: The City/TTC expect that this will be undertaken as part of the updated environmental work for the TPAP(s).

Q23 Will the Province adhere to City permits and approvals, per the practice under the LRT Master Agreement?

A: The applicable Master agreement(s) for these projects are to be developed, and it will be the expectation that agreed upon service standards and timelines for applications, permits and approvals will be adhered to. The Province is seeking city commitment to explore opportunities to accelerate and expedite delivery including review of processes, and leveraging powers and authorities. [A3 p13]

Q29: Are you building the [Ontario] line to a budget of $10.9 B or are you building a line with a defined scope of work?

A: The project cost estimate is preliminary based on the current state of development. The scope in so far as length and areas served have been consistently stated. Future adjustments to scope, budget and schedule will be identified as part of subsequent phases of work. [A3 p15]

“Future adjustment” is a term that implies potential change, but how would this be handled with a P3 contract already in place? When do the requirements to deliver on time, on budget, supersede whatever objections or improvements might emerge from a review process?

Transit Oriented Development

One of the Province’s favourite terms now is “Transit Oriented Development” and the supposed ability to pay for transit with development charges and fares from new riders. There is a question, however, of whether the Province will seek higher density around stations to pay for its rapid transit plan even if this requires development at a scale beyond what the City has planned or the neighbourhood is expecting. What other costs will TOD bring for infrastructure, services, schools? The overdevelopment of Yonge & Eglinton, where the Province wants to see even more density, is a prime example.

Q13: With respect to “transit-oriented development” and seeking private sector investment, what assumptions are being made with respect to compliance with the City’s Official Plan policies and guidelines?

A: The Province has committed to work with the City to ensure that transit oriented developments advance a shared understanding for effective growth and high quality development of Toronto. The City and the Province are working through the details of an agreement on how they will work together to advance TOD opportunities. [A3, p10]

That is not the most reassuring of comments given the bull-headed nature of Provincial policy development. Doug Ford (and his brother before him) believes in the magic of the private sector somehow covering the cost of his dreams. This could have severe consequences for both the City and for the transit system if that dream is exploited to remove controls on high density development.

Getting There From Here

There is a problem throughout much rapid transit planning in Toronto that agencies only consider the end state after many projects have been built, new jobs and residences have been created, and magically we are transported to a future date and city where the models run.

Unfortunately, we have to get from 2019 to 2041, the year for all of the modelling cited in these reports, and there is no guarantee that the system can handle either the intermediate stages nor the “end state” if things do not occur as quickly as we hope.

Although GO expansion is part of the next decade’s work, there is nothing published to show how it will affect the TTC network for good or ill. Indeed, a major role for the Ontario Line now appears to be “relief” for congestion at Union Station almost to the point that relief of subway congestion is a secondary matter.

SmartTrack is a mythical “service” whose final configuration is still not known. Metrolinx has been quite evasive on this point, and the best we can hope for is a train every 15 minutes at “SmartTrack” stations along the Weston and Stouffville corridors. Two of the six ST stations may never be built because they physically conflict with, or lose projected ridership to, other services.

It may suit planners and politicians to talk of demand models for 2041, but what will the 2020s and 2030s look like on Toronto’s and the wider region’s transit system as we await the arrival of new services? This is a major shortfall in the City reports because they do not address the “how do we get from here to there” problem complete with associated operational and financial headaches. A scheme for the province to pay the entire cost of four new lines is wonderful, but there is much more to the transit system’s future than Premier Doug Ford’s map.

Continue reading

A Big Announcement, or a Transit Three Card Monte?

On October 16, the governments at Queen’s Park and Toronto City Hall announced a deal to sort out competing transit plans for the city. The current provincial priority projects are the Ontario Line (Don Mills/Eglinton to Exhibition), Scarborough Subway extension from Kennedy Station to Sheppard, Yonge Subway extension from Finch to Richmond Hill, and the Eglinton West LRT extension from Mount Dennis to Renforth.

The main City of Toronto report will be discussed at Executive Committee on October 23, and then at Council on October 29-30.

This article reviews that report with reference to a few parts of its many attachments. I will turn to the technical attachments in a second article. To focus material on each subject for readers, I have grouped related items together or re-sequenced things for emphasis. There are extensive quotations of key material so that readers hear not just my “voice” but that of the report’s authors.

Despite the importance politicians at both levels place on the proposals, the fundamental problem remains that many of the details are cloudy, to be kind. Specifically:

  • The City of Toronto retains ownership of the existing transit system avoiding a complex realignment of responsibilities and governance, but with this comes total responsibility for funding the ongoing state of good repair.
  • A large gap remains between the amount of funding needed to maintain and expand Toronto’s transit system relative to the amounts actually available and committed in budgets at various levels of government.
  • Ontario will build four key projects substantially with its own money, but continued support for transit beyond this is uncertain.
  • Toronto will redirect funding originally earmarked for its share of the key projects to other priorities, notably the TTC’s repair backlog. However, much of that “funding” does not exist as allocations in existing budgets and new money is required from Toronto to pay its share.
  • Cost estimates for the key projects are based on preliminary estimates that could change substantially as the design process unfolds. These estimates are in 2019 dollars and make no provision for inflation. The reports are silent on how the proportion of total spending by each contributor might change over the decade or more of construction.
  • A substantial total of project costs will be born by private sector partners through a “P3” financing mechanism. These arrangement will require future payments for what will be, in effect, a capital lease, but the mechanism for funding this from three levels of government is unclear. The reports are silent on the split between short term borrowing to pay for construction as opposed to long term payments to the P3 financier.
  • Project details as they are known today will change in response to design work and the need to keep costs within the projected level. This will affect alignments and stations, and what we think we are buying could be quite different from what we actually get.

The challenge in all of this is, as always, the question of money. We can watch the hands of politicians and managers at all levels as they shuffle cards on the table. We hope to “find the Queen”, to win in the subway sweeps rather than being taken for suckers who will cheer any plan, but lose every game. It is far from clear whether the proposal is a “good deal” for Toronto, and there are huge future transit costs that are barely addressed.

The whole exercise is a political deal to bring peace, comparatively speaking, to the transit file which was needlessly fouled by Doug Ford’s insistence that he knows more about transit in Toronto than anyone else. Does Toronto take this as its last best chance to preserve some semblance of control over its transit future, or do we keep fighting for a better deal?

There are a lot of holes in this plan and severe implications both for the City’s finances and the future of Toronto’s transit system. Many questions need to be asked and answered, even if the result will be a whole new plan after provincial and municipal elections in 2022.

Continue reading

To Upload Or Not To Upload, That Is Not The Question

In his continuing assault on the City of Toronto, one of Premier Doug Ford’s early promises was to take the TTC subway system completely off of the City’s hands. That scheme was cut back to handing Metrolinx the responsibility for planning and building new lines, with the existing TTC system left for future consideration.

Now, the Star’s Ben Spurr reports that the upload has fallen off of the table and a new “deal” will be proposed:

In exchange for Toronto supporting Ford’s pet project, the “Ontario Line” between the Science Centre (Don Mills & Eglinton) and Ontario Place (south of Exhibition Place), Ford would leave the existing subway system in Toronto’s hands. This is a huge retreat for a man once bent on eviscerating City Council’s control over transit, and it raises the question of “what next” for Toronto transit politics.

I have written before about the high cost of subway ownership:

In brief, there is a myth that the subway network “breaks even” because its high ridership, and hence revenue, more than pay for the cost of operations and maintenance. This has two fundamental flaws:

  • Much depends on the allocation of fare revenue, and the amount of the fare carrying a rider on a bus+subway trip, for example, belongs to each leg of the journey. There are various ways to do this, but they all produce distortions in a flat fare system with extensive free transfers between routes and modes. This process is even more difficult in the era of monthly passes and two-hour fares.
  • There is a huge ongoing capital cost for subway renewal, for systems, vehicles, stations and much more that do not last the mythical “100 years” subway boosters claim, but which must be refreshed on a regular cycle. Even the physical structure, the tunnel, needs major repairs to achieve its intended lifespan.

Cuts to provincial funding started years ago, and the Ford government has reversed plans to increase Toronto’s share of provincial gas tax revenue. The provincial contribution to ongoing capital maintenance is small. As for operations, the City pays the lion’s share of the subsidy and the riders pay most of the rest.

If Queen’s Park takes over the subway, it would hardly be fitting for Toronto to continue paying much of the cost of maintaining this asset, and it would become a new drain on provincial resources. Premier Ford never tires of telling us that these are stretched to the point where major cutbacks, not additional costs, are the focus of all government planning. True, the province would give up its share of surface system costs, but that is a small contribution compared to what the City already pays in operating and capital subsidies.

Doug Ford’s dream of being the Tsar of Toronto Transit Planning comes with a big price tag, and there is a good chance that the government is having second thoughts about whether the proposed changes are worth the bother and expense.

The challenge for Council is, however, more complex that one of embracing the Ontario Line, popping the sparkling wine, and celebrating the Premier’s retreat.

Continue reading

King Street Update: September 2019 Part III

In this, the final part of the series reviewing operations on the King Street corridor, I present updated charts showing the capacity of service offered at various locations along the 504 King route since March 2016, and a history of schedule changes there since September 2017. The capacities shown are based on actual day-to-day operations and can vary a great deal from the scheduled offerings.

Service Capacity

The values shown in the charts below are based on the TTC Service Standards design values for average vehicle loads during the peak period. It is physically possible to carry more riders, but service is supposed to be arranged so that on average crowding is at these levels. There is always a trade-off between packing more people onto cars and buses, and the extra travel time this triggers with people pushing by each other to board and alight vehicles. “Efficiency” is not necessarily a question of getting the most sardines into every can.

For each location discussed here, the peak hour chart showing 8-9 am in the morning or 5-6 pm in the evening is included in the article, but a set of PDFs at the end of the section contain hourly charts for the four hourly periods from 6-10 am and 3-7 pm for those interested in the shoulders of the peaks.

Continue reading

King Street Update: September 2019 Part II

This article continues the analysis of King Street transit operations during September 2019 with a focus on the effects of the Toronto International Film Festival (TIFF).

TIFF opened on Thursday afternoon, September 5, but the diversions were in place from the start of service at 5 am. For the period when diversions were operating, there were three services on route 504:

  • Dundas West to Church diverting eastbound via Spadina to Queen and then returning south to King via Church; then westbound via King to York, York to Queen and south to King via Spadina.
  • Distillery to York Street looping via York, Queen and Church back to King Street.
  • Broadview Station to York Street looping via York, Queen and Church back to King Street.

The effects of this arrangement were quite severe with extended travel times and wider headways across the route, not just downtown.

The fundamental policy issue here is the takeover of a major street for an event like TIFF for an extended period. There were four days of complete diversions (September 5 to 8), and three further days of ad hoc street closures (September 9 to 11). The TTC attempted to operate service on 504 King with the usual complement of scheduled cars, but on routings that required considerably more travel time, maintaining normal headways was impossible.

The effects are not confined to the immediate TIFF district, but extend to service over the entire route, as well as to travel times and service reliability on 501 Queen. This is not simply a matter of residents of the condos near TIFF putting up with an annual upheaval in their neighbourhood, but of an effect across two major corridors on transit and road traffic.

If this type of “service” is planned in the future, then either the event itself should pony up the cost of supplementary service, or the city should make an explicit contribution through the TTC’s budget for extra service. Preferably, King Street would be kept open on weekdays, and adequate service would be operated on weekends to offset the TIFF effect which is not as severe then.

Continue reading

King Street Update: September 2019 Part I

This article is an update on the behaviour of transit service on King Street which I last reported six months ago in three articles:

In this article, I will review travel times across what was once called the “King Street Pilot” area between Jarvis and Bathurst Street. In Part II, I will turn to the effect on travel times caused by diversions for the Toronto International Film Festival (TIFF) on both King and Queen Streets. Part III will review service capacity actually provided at various points along the King route.

This will be the last article in which I conduct a detailed review of the “pilot” operation unless there is a significant change to warrant returning to the issue. It is clear after two years that the improvement in service on King Street is permanent and stable.

TIFF is quite another matter, and its effect on both King and Queen Streets is quite severe, particularly on the opening two days. This is an issue for a policy decision by Council on whether the economic benefit of closing the street completely on weekdays outweighs the effect on transit services and riders.

Service on the central part of King Street consists of two primary routes, branches of the 504 King car, supplemented by two other part-time services:

  • 504A King between Dundas West Station and Distillery Loop
  • 504B King between Dufferin Loop and Broadview Station
  • Effective September 2019, the new 508 Lake Shore tripper was added with five trips in the peak direction between Long Branch and downtown via King. This only affects service capacity charts which will appear in Part III.
  • The 503 Kingston Road route (operating with buses) has been consolidated with 502 Downtowner for the duration of the reconstruction project at Kingston Road and Queen Street. This route operates only during weekday daytime, and it is not included in the analysis because it does not operate across the full width of the “pilot” area.

These charts contain the same data as in previous articles up to March 31, 2019, and data for the six months to September 30, 2019 have been added.

To view any chart at a larger size, click on it. Full chart sets are available as PDFs at the end of each section.

Travel Times Across the Pilot Area

These charts plot the 50th (median value) and 85th percentiles for travel times between Bathurst and Jarvis. In both cases the screenlines used are in the middle of the intersection so that the start and end times used are measured when vehicles crossed, not when they arrived at or departed from stops.

The vertical shaded areas refer to periods when service on King was affected:

  • Red: Toronto International Film Festival (TIFF, Early September Annually)
  • Purple: King service diverted via Queen for track work (Spring 2016)
  • Yellow: Queen service diverted via King for track work (Fall 2017)
  • Green: King Street Pilot begins. Transit Signal Priority (TSP) deactivated (November 2017)
  • Blue: TSP reactivated (July 2018)

As previously reported, the major effect of the new traffic arrangements on King is the reduction in the variability of travel times shown by lower 85th percentile values so that service was much less likely to be erratic.

TIFF produced a severe impact on travel times for streetcars. This shows up as a spike in the charts in early September 2019, and more detail of the effects appears in charts in Part II. The effect in 2019 was worse than in 2018 especially on TIFF’s opening day, Thursday, September 5.

Continue reading

In Case You Were Wondering …

For those who feel that this site has not churned out enough material recently, fear not! Many things are various stages of preparation, but there are only so many hours in the day to devote to this.

Works in progress:

  • My next article for Spacing Magazine on the history of the CLRV/ALRV fleet (completed)
  • A review of the TTC Board Meeting of September 24 including:
    • The CEO’s Report including service reliability and PRESTO
    • Potential problems with Metrolinx design work on new projects including accessibility provisions
    • The quarterly TTC financial report
    • Transit service on Keele Street (completed)
    • Fare evasion
  • A review of the TIFF effects on transit service for King and Queen Streets, and an update of the King Street Pilot stats to the end of September 2019 (completed)
  • An examination of the TTC’s scheduling strategy of aiming at the 95th percentile of actual running times to reduce or eliminate short turns

There’s more coming down the pipeline, but you will just have to wait!

How Reliable Are TTC Statistics?

Ben Spurr in the Toronto Star published an article on September 30 about the mis-reporting of vehicle reliability for the fleet of Bombardier Flexity streetcars.

In brief, the TTC reports defects for the new cars on a different basis than for the old ones (the CLRVs and the recently retired ALRVs), and this has two effects:

  • The reliability of the old cars looks worse by comparison to the new ones, and this supports the argument that the old cars should be retired as soon as possible.
  • The new cars have recently crested the performance specification from the Bombardier contract, but this is based on the way the failure rate is calculated.

The September 2019 CEO’s Report contains Mean Distance Between Failure (MDBF) charts for both types of streetcars still in active service. August 2019 saw the new fleet’s reliability go about the 35,000 km MDBF, and CEO Rick Leary reported at the TTC Board meeting of September 24 that the current number was running above 50,000 km.

By contrast, the CLRVs have failed roughly every 4,000 to 6,000 km for much of the past three years with problems more common during the cold months. Note that the scales of the charts below are not the same.

However, according to Spurr’s article, the basis of calculation is different for the two fleets. In the case of the new cars, only failures chargeable against Bombardier’s contracted reliability level are counted while for the old cars any failure counts. This makes a big difference when one considers how many of the in service failures were not included in the calculation for the new fleet.

Spurr writes:

The vehicle contract the TTC and Bombardier signed in 2009 set a MDBF target of 35,000 km. The cars were supposed to reach that figure by the time the 60th vehicle was delivered. That car arrived in January 2018, but the new fleet failed to hit the target then or in subsequent months.

That changed this summer. As Bombardier edged closer to completing its delivery of the 204-car fleet, and the TTC weighed the option of placing an order for additional streetcars with the company, the publicly reported reliability figures shot up.

They showed the cars had an MDBF of 36,500 km in July, and 51,500 km in August, the best the fleet has recorded since the early days of the order. CEO Leary cited that most recent figure at last Tuesday’s meeting as evidence the cars are “performing exceptionally well.”

However, over the same period the unpublished reliability figures didn’t improve. The “legacy” numbers showed an MDBF of just 16,400 km in August, which while much better than the early months of the year, was virtually unchanged from the mark set in May.

The unpublished “legacy” figures are consistently significantly worse than those the contractual numbers.

He goes on to write:

Internal TTC documents reviewed by the Star show that in [August] the new streetcars experienced dozens of delays related to faulty brakes, malfunctioning doors, broken HVAC units, and short circuit warnings. The agency tabulated 43 significant delays during that period, but only 15 were deemed Bombardier’s responsibility and included in the version of the stats that are made public.

That lower delay figure led to the contractual number of the cars running more than 51,500 km without a failure.

Readers can judge for themselves the type of delay that is omitted from the TTC’s reliability numbers from the following table which is compiled from TTC delay reports.

TTC_201908_LFLRV_DelaySummary

There are 56 items in the list and several patterns are immediately obvious:

  • Problems with the power collection system are common including pantograph failures, lost trolley poles or defective shoes, and dewirements snagging poles and/or damaging the overhead.
  • Brake problems
  • Mobility ramp problems
  • Failures early in the morning on cars that are probably just entering service

Many of the problems have nothing to do with Bombardier reliability stats and are not included in the calculation included in the CEO’s Report. If they were, the numbers would not look anywhere near as good.

Something that is evident in reported reliability stats is that there can be large variations in MDBF values from month to month. The TTC does not make huge changes in the mileage operated by its fleet each month, and so the large swings must be due to a relatively low number of incidents. For example, if there were typically 100 incidents per month and this swings up or down by 10%, then the MDBF would not change much. However, if there were typically only 20 incidents per month, a small change in the month-to-month numbers would produce a big swing in the MDBF. This is evident in the Flexity reliability values and in those cited for the subway fleet, notably the newer TR trains on Lines 1 and 4.

Even if all types of failure were counted, the service delay it causes must be five minutes or more. This is a standard adopted from the NOVA group of rapid transit operators and really is more appropriate for rapid transit lines.

An important distinction is that vehicles that run in trains have the capability of “getting home” even if one unit is disabled under most circumstances, and reliability stats for this type of operation will be higher than for single vehicles on a streetcar system. Also, rapid transit lines operate at higher average speeds, and failures that are affected more by hours of service than by mileage are spread over a larger distance operated. This is quite evident in TTC subway stats where the MDBF is much higher than for streetcars.

By contrast, it is difficult to imagine how a bus breakdown can cause a significant service delay except in comparatively rare circumstances, and the five minute delay screen for a chargeable delay makes no sense for the bus fleet.

The question of just how reliable various vehicle types might be is part of a larger issue with the selective, and possibly misleading reporting of statistics by TTC management.

Delays to service, especially on the subway, are caused not just by equipment failures, but by a raft of other subsystems and problems such as signals, track, power supply, fires, passenger assistance alarms and track level incidents. The TTC tracks the various types of delay, but reports on them only rarely in public. This means that sources of service delay that might be under the TTC’s control are not tracked in a report that is routinely seen by the TTC Board, nor is there any tracking of the effects of preventative maintenance or capital works to reduce this type of delay. One obvious example is the new Automatic Train Control system which is now operating on about half of Line 1 YUS, but we know nothing of service reliability on that section, Vaughan to St. Patrick, compared to the old signals still in use from St. Patrick to Finch.

Bus reliability is reported in the aggregate for a fleet that ranges in age from brand new to over twelve years old. The TTC used to keep buses for at least 18 years, but now chooses to replace rather than rebuild old vehicles. Retiring a large tranche of 12-20 year old buses in recent years has had three effects:

  • The average age of the fleet is now quite low, and it will continue to drop. Half of the fleet is less than five years old, but as the “bulge” of new buses ages, the fleet reliability will fall.
  • With many new buses coming on stream, the TTC can keep old buses in service and maintain a high ratio of spares to service requirements. The situation is very different for the streetcar fleet where with the retirement of old cars, the fleet is too small to provide service on all routes with an adequate number of spares for maintenance.
  • The large order of buses soaked up the then-available funding for transit infrastructure as it was the only way Toronto could spend its allocation within the short timeframe dictated by the federal government.

For reasons best known to the TTC, the chart above is clipped at 20,000 km rather than showing the actual variation, and this has been the case since early 2018. It is unclear whether the actual numbers are rising or falling over the past two years. Moreover, the values average the reliability for the entire fleet rather than showing subsets such as diesel and hybrid buses, or buses of varying ages or manufacture. This type of breakdown is vital in understanding fleet planning, not to mention tracking the benefits (or not) of technology changes such as the move to an all-electric fleet which is only just beginning.

The TTC fleet of buses is much larger than its requirement for service. In total, as of the September 2019 vehicle list (taken from the Scheduled Service Summary, last page) shows a total of 2,076 vehicles as compared to a peak service requirement of 1,626 (p. 63 of the same document). This is a generous spare factor of over 27%, or one spare bus for every four in service. It is easy to get very good performance from your fleet with such a high ratio, but this also means that, in effect, the TTC operates one garage worth of spares for every four garages worth of regular service. This is far higher than the target spare ratio for rail vehicles.

In a separate post, I will turn to the question of service reliability, scheduling and the way in which service quality is presented by management to the TTC Board. This is another area where there has been a lot of work to make the numbers “look good” but with detrimental effects on the system.

Questions for the TTC:

I have posed a series of questions to the TTC and await answers from them. This article will be updated when they reply.

1. Has the Flexity reliability number always been quoted on the basis of failures chargeable to Bombardier, or was there a change in the methodology somewhere along the way? To put it another way, was there a change in what counted as a failure that created an artificial improvement in the reported numbers?

2. What is the situation with subway delays and MDBF numbers? Are all failures counted (at least those producing a 5 minute or greater delay) or only those considered to be the manufacturer’s fault? Is the calculation done the same way for the TR and T1 fleets?

3. The NOVA metric which the TTC uses is based on the idea of a failure that causes a delay to service. This only makes sense in the case of rail modes where a car/train failure can block the line. For buses, only a rare and well-positioned failure could actually block service. How is a chargeable failure calculated for the bus fleet?

4. Are numbers available for subsets of the bus fleet (e.g. all buses from the same order, age, technology) so that reliability figures can be compared as they have been with rail modes?

5. The CEO’s Report includes only stats for delays caused by vehicle faults, not from other sources such as infrastructure failure. Why is this info not also tracked in the report so that the effects are clear on a proportionate basis? In particular, there is no tracking of signal failures on various parts of the subway with older and newer technologies.

Summary:

TTC management should report vehicle reliability numbers on a consistent basis for all types of vehicles.

The calculation of service interruption rates should reflect what riders experience, not simply numbers to establish contract performance for suppliers or to artificially enhance the reported performance of some vehicle types.

The reliability statistics for the bus fleet should be broken down by major vehicle groups (manufacturer, propulsion technology, age) to allow meaningful comparisons and to ensure tracking of maintenance/reliability as parts of the fleet age.

The very large spare ratio for the bus fleet should be reviewed to determine whether this size of fleet is actually required, or if more service could be operated if only the TTC would budget for the cost of its operation.

Delays caused by infrastructure issues and other interruptions should be tracked and reported so that their effect on service quality can be seen in comparison to vehicle related problems.

TTC Service Changes Effective Sunday, October 13, 2019

The TTC will make many changes to its services on Thanksgiving weekend, Sunday, October 13, 2019.

These include:

  • The formal introduction of new Flexity streetcars on the 506 Carlton route on a scheduled basis.
  • Implementation of the route changes flowing from the Junction Area Study.
  • Construction at Runnymede Station for the Easier Access Program trigger some route changes and interlining.
  • Many “service reliability improvements” intended to make scheduled trips better match actual operating conditions.

Of particular concern in this round of changes is that a policy adopted by the TTC Board in June 2019 allows schedule changes intended to improve reliability to take precedence over loading standards. Several routes where service is nominally “improved” will also have crowding beyond the Board approved standards. This is caused by a shortfall in the budget which does not provide enough resources, the TTC claims, to operate service at a level that meets the standards. There are no numeric values given and so the degree of overcrowding is not known. The affected routes and time periods are shown in the chart below.

On a related note, a few routes which are now part of the Ten Minute Network will slip beyond that target headway.

The intent is to correct these situations either through the 2020 budget or by reallocation of service from other routes.

(The two charts above are included in the PDF containing all of the schedule changes at the end of this article.)

In response to my query about these practices, Mark Mis, Manager of Service Planning replied:

Q1:

SM: … it was my understanding that the table of crowded routes was going to be published regularly, but nothing has appeared after the first iteration … [earlier this year].

MM: The TTC will be reporting on crowded periods of operation in the CEO Report later in the fall when we have a complete board period of service reliability data. We think it is important to report on both crowding and reliability at the same time.

Q2:

SM: … does this footnote mean that the affected services are being scheduled at over the Service Standards for loading?

MM: The footnote is an internal note in the Board Period memo for record keeping purposes. It indicates a period of operation that is scheduled over the crowding standard because of a change in running time as opposed to demand. This strategy to address service reliability was approved by the Board on June 12, 2019 in the Improvements to Surface Transit Schedules report. This is important to note when you take the response to Q1 into account.

The June 2019 report included the following observations:

An effective transit schedule is comprised of two key components:accurate estimates of demand and cycle time—the time for an operator/vehicle to complete a round-trip. If the cycle time is insufficient, a transit schedule can not be delivered as planned resulting in customers experiencing unreliable service and higher levels of crowding than intended.

Customers value consistent and dependable schedules because it improves their trip planning, reduces wait times and reduces trip durations. This was demonstrated by the King Street pilot. A key outcome of it was more consistent and less variable service which resulted in tremendous increases in ridership. [p. 3]

The TTC is leveraging new technology and applying a new approach to preparing reliable schedules which includes setting cycle time at the 95th percentile of observed travel time along a route in a given period of operation. This is meant to ensure that operators have sufficient time to deliver service as planned and advertised during most of the operating period. [p. 5]

The TTC 2019 Operating Budget includes some funding to improve service reliability and capacity. It is not possible to bring all schedules that actually operate outside of the tolerances of service standards in line with them within existing funding. The new schedules will reflect actual operating conditions and will result in more reliable service for customers. [p. 7]

On several routes that already have new schedules, a common observation is that vehicles cluster at terminals because they generally arrive early and/or have long scheduled layovers. Despite this, the vehicles do not manage to depart on a regular headway (time between vehicles) nor do they achieve the “on time performance” goal. The TTC is quite generous with a six-minute window in which a departure is considered “on time”. Service becomes progressively more bunched as cars and buses proceed along their route, and there is no measurement of service reliability other than at terminals.

This begs the question of rejigging the schedules in the first place when service can be so irregular. In almost all cases, the “improved” schedules offer less frequent service because existing vehicle spacings are stretched to give longer trip times. Longer trips may reduce short turns, but this is only one of several possible measures of service quality. See Zero Short Turns Does Not Equal Better Service.

Streetcar System Changes

The 506 Carlton route is now officially a low-floor streetcar service with Flexitys scheduled at all hours. Bus and CLRV trippers will supplement peak services. Further details are in a previous article.

The 505 Dundas route remains a bus operation, but the schedules will change to remove extra running time added for water main construction in the central part of the route. This may relieve the worst of the bunching of Dundas buses now seen at terminals. Riders on the 505 will see improved service, or at least the bunches of buses will come slightly more often than they do today.

Conversion of 505 Dundas to Flexity streetcar operation is planned for the winter/spring after conversion of the overhead on that route for pantograph operation.

Routes 510 Spadina and 509 Harbourfront will get new schedules with blended services during most off-peak periods at Union Station. Scheduled headways will be the same on each route with the intent that cars will alternate on a regular, reliable basis. The downside to this scheme is that service on 510 Spadina will run less frequently, and layover times, which already cause queuing problems at the terminals are increased. 509 Harbourfront will see less frequent service as a regular seasonal change.

Overnight service on 306 Carlton will change to every 20 minutes, and on 310 Spadina to every 15 minutes to push a few more cars out of the crowded carhouses. It is unclear how long this practice will actually last once the CLRV fleet is retired because capacity will be lost at Russell Carhouse for construction starting in 2020.

Bus Network Changes

Construction of the new mouth of the Don River in the Portlands has progressed to the point that on October 30, 2019, Commissioners Street will be closed between Cherry and Saulter for excavation of the new river. A new Commissioners Street road bridge will cross the river, but at this point there is no money in the Portlands project for a streetcar bridge although provision exists in the plans. This would allow the eventual connection of an extended Cherry Street service east to Leslie Barns via Commissioners.

The route changes from the Junction Area Study will go into effect concurrently with route modifications to accommodate elevator construction at Runnymede Station.

The new route structure, in brief:

  • Route 30 High Park will operate from High Park Station to Runnymede Loop taking over the route number formerly assigned to Lambton.
  • Route 40 Junction – Dundas West will operate from Dundas West Station to Kipling Station with a short turn service to Jane Street.
  • Route 71 Runnymede will keep only its branch to Industry Street in Mount Dennis.
  • Route 189 Stockyards will provide service from the subway at High Park and Keele Stations to St. Clair and Scarlett Road.

Due to construction, no buses will be able to loop at Runnymede Station triggering the following changes:

  • Routes 71 Runnymede and 77 Swansea will be interlined.
  • Route 79 Scarlett Road will loop via Annette, High Park and Bloor Street as shown below.

Seasonal service will end on:

  • Weekend evening service to the Zoo on 85 Sheppard East and 86 Scarborough
  • 121 Fort York – Esplanade to Ontario Place and Cherry Beach
  • 175 Bluffers Park

The details of all changes are in the file linked below.

2019.10.13_Service_Changes