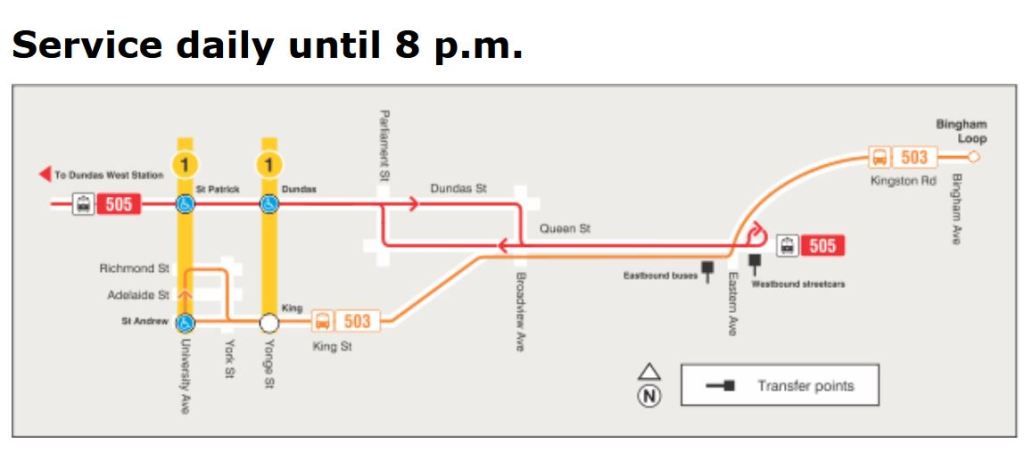
On May 7, 2023, the eastern terminus of 505 Dundas shifted from Broadview Station to Bingham Loop due to sewer work, track construction and road paving on Broadview north of Gerrard. This will continue into at least the late Fall 2023.
This operation was not a success by any measure with extremely erratic service on Kingston Road where the 505 replaced the 22 Coxwell bus and the 503 Kingston Road streetcar. Service on the main part of 505 Dundas from Broadview to Dundas West Station has also become less reliable.
July 4, 2023, service changes (505 Dundas was cut back to Woodbine Loop and 503 Kingston Road buses (running as unscheduled extras) provided service to Bingham until 8pm to correct this problem, but riders endured almost two months of bad service. This affected not just Kingston Road but the entire 505 Dundas route.
This article reviews service during the May-June 2023 period when 505 Dundas cars ran to Bingham with comparisons to the “before” conditions on routes 505, 503 and 22. It is a long article with many charts for those who are interested in the details of how this service has behaved over the past six months. In Part II I will turn to reviews of operations on a sample of days in May-June.
In brief, the May schedules unwound improvements made in February that adjusted travel times to better match conditions. Moreover, Februrary saw major service cuts to the 505 Dundas route which compounded with less reliable service to make for much wider gaps between cars. In many ways, this was an “own goal” by the TTC.
Oh the irony! The TTC’s Annual Service Plan consultations are all about how to handle a few (but not all) of the construction projects coming in 2024, but the elephant in the room remains bad communications and changes on the fly.
The new routes implemented in May and June 2023 were in cases impractical thanks to a combination of unduly optimistic running times in schedules, less than adequate transit priority and line management whose priority was not the provision of well-spaced, reliable service. Several changes will take effect on July 4 and 5 to correct some of these problems, but the information is scattered through the TTC’s website, if you can find it at all.
First, a summary of the changes:
The 501/504 shuttle bus (an ad hoc service implemented to cover for the absence of the 503 Kingston Road car to King Street downtown) will be rebranded as “503” and will serve Kingston Road to Bingham Loop until 8pm every day. This will become a scheduled bus service at the end of July, and will revert to 503 streetcars likely in October.
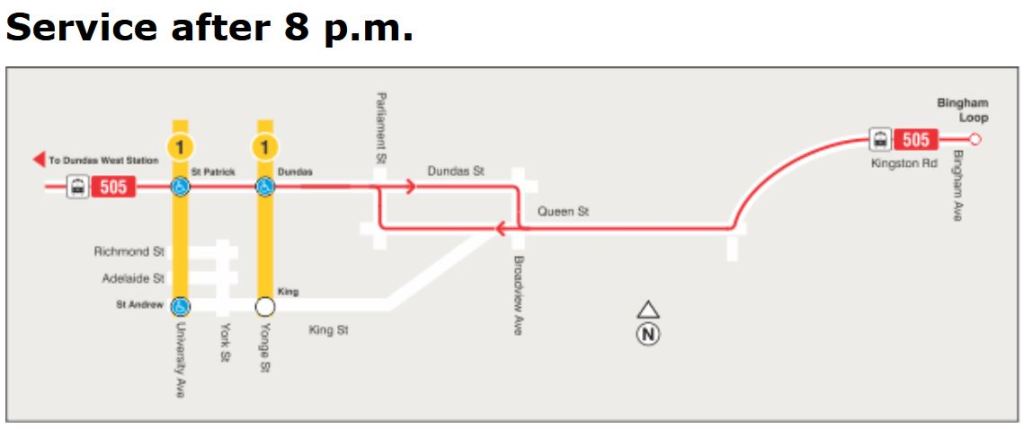
The 505 Dundas car will only operate east on Queen from Broadview to Woodbine Loop, except after 8pm when service to Bingham will be provided by streetcars.
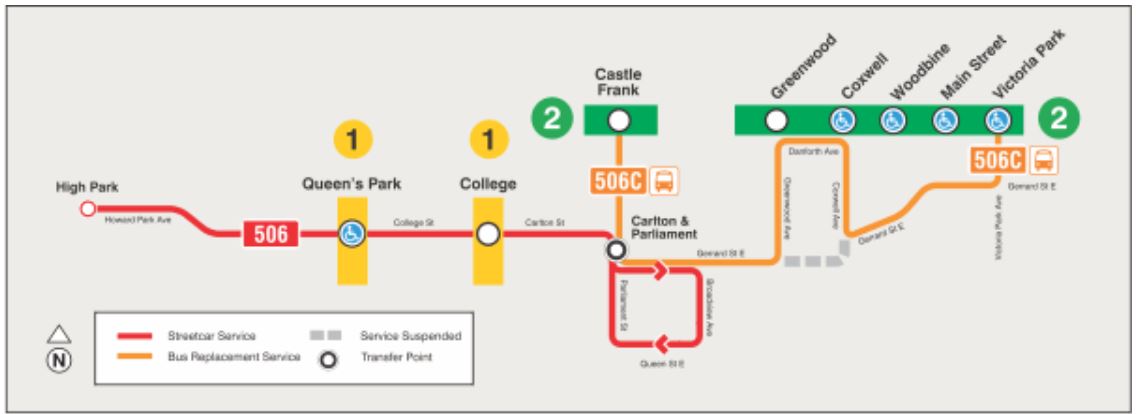
The 506 Carlton car will only operate to Queen and Broadview and will return west to route via Queen and Parliament Streets without running east to Woodbine Loop.
The 512 St. Clair car will be restored, temporarily, west of Lansdowne to Gunns Loop. While it lasts, this will correct for the erratic service now provided there by the 47 Lansdowne extension.
The challenge is to find out that this is happening to your route. The TTC website is very poorly organized with information in many places that is inconsistently placed and linked (or not) to the main route pages affected. Some items are out of date, but remain in place to confuse riders. Some items describe major changes but are hard to find if you don’t know the site in detail.
These are the hallmarks of a site maintained by many groups each with its own (probably jealously guarded) responsibility for providing information. Nobody appears to care about overall site consistency and ease of navigation, or if they do, are in any position to change what is a clearly broken process. Some information is just plain wrong indicating that whoever created or updated the page was either sloppy, or does no know what is actually happening.
Updated July 4, 2023 at 7:10am: Changes to the TTC website since this article was posted are noted in various places below.
Updated July 5, 2023 at 4:30pm: Changes to the TTC website since the July 4 update are noted throughout the article.
The TTC will implement two route changes in July to address, in part, problems with service reliability on construction diversions.
Updated June 30, 2023: The location of Salsa on St. Clair has been corrected.
Updated July 1, 2023: The 506 Carlton cutback to Queen and Broadview has been added.
503 Kingston Road / 505 Dundas
Effective Tuesday, July 4, 2023 (July 3 is a holiday), service on Kingston Road to Bingham Loop (Victoria Park) will be revised on weekdays and Saturdays from 6am to 8pm, Sundays from 8am to 8pm:
505 Dundas cars will turn back at Woodbine Loop in stead of running through to Bingham.
503 Kingston Road buses will operate between Bingham Loop and York Street via King. Because these are “extras”, not scheduled buses, they will not appear on trip prediction apps.
After 8pm on all days, the 505 Dundas car will run through to Bingham Loop as it does now.
This change should relieve problems with tight running times that caused many short turns on 505 Dundas and wide gaps both on Kingston Road and on Dundas west of Lansdowne. (I will publish an analysis of 505 Dundas headways and reliability in early July.)
Effective Sunday, July 30, 2023, the 503 Kingston Road bus will operate between 6am and 1am (starting at 8am on Sundays) over its Bingham to York route.
Streetcars are expected to return in the fall, likely on Thanksgiving weekend. It is not yet clear whether the 503 streetcar will permanently replace the evening and weekend service formerly provided by the 22A Coxwell bus.
506 Carlton (Added July 1, 2023)
The 506 Carlton streetcar service will be cut back in the east end to Broadview rather than running east to Woodbine Loop. This will correct a problem with inadequate running time that caused many streetcars to short turn without getting to Woodbine Loop anyhow.
The map below shows the 506C bus diversion via Greenwood and Danforth around track construction at Coxwell and Lower Gerrard. This configuration will be in effect until mid-July when buses can again operate via Gerrard and Coxwell without diverting.
512 St. Clair
Effective Wednesday, July 5, 2023, the 512 St. Clair car will resume operation west to Gunns Loop. Construction at the GO Barrie corridor bridge west of Caledonia has been delayed allowing through service until August. The date when turnbacks at Lansdowne (Earlscourt Loop) will resume is not specified in the TTC announcement.
On the weekend of July 8-9, 2023, streetcar service will be suspended on at least part of the route (TBA) for the Salsa on St. Clair festival between Oakwood and St. Clair West Station.
Service on the temporarily extended 47 Lansdowne bus on St. Clair has been quite erratic. (Stay tuned for an analysis of this operation in coming days.)
The TTC is part way through production of its 2024 Service Plan as well as a 5-Year Service Plan and Customer Experience Action Plan. In Round Two, consultation will focus on plans for service changes triggered by major construction projects. Five pop-up sessions are planned at Flemingdon Park, Union Station, Liberty Village, Finch Terminal, and Pape Station between June 29 and July 12, 2023. Details are available here.
Also available on that page is a link to a survey seeking feedback on various proposals. Please note that my site is not an official TTC conduit for feedback, although it is no secret that many at the TTC do read articles and comments here. Any specific feedback for the TTC should be submitted through their own survey.
Round Three in August-September will present draft concepts for the 5-Year Plan and Customer Experience Action Plan, and these will be refined into final drafts for Round Four in October-November.
The remainder of this article presents an overview of the survey and proposals for construction-related service changes.
There are no proposals for new routes nor of overall service levels in this round. The election of Olivia Chow as Mayor will no doubt bring a review of existing services, but that is not in the scope of this round.
An important issue left over from the 2023 Budget process and the recent service cuts is the question of Service Standards. These are described as “Board Approved”, but in fact the 2023 changes were implemented by management as part of the budget with only retroactive consent from the Board. Moreover, the actual effect of the changes was withheld from the Board and Council until well after the budget was approved.
Transparency in budgets and service planning will be an important change looking ahead to 2024. With a new Mayor I hope to see a much improved process.
Several changes will affect TTC routes on June 18. Notable among these is the formal restoration of more frequent weekend subway service, the Broadview construction project, various adjustments to improve route operations, and seasonal changes.
A consolidated table showing current and new service designs is in the spreadsheet linked below.
The Toronto Mayoral By-Election is just under a month away, and candidates pump out announcements daily, often with a transit spin. In this article I will look at the transit-related issues they are trying to address (or in some cases avoid).
All of this takes place in a strange world where the availability of money to pay for anything is suspect. Is a promise is even credible let alone affordable? Many of the platforms overlap, and so I will take related issues in groups rather than enumerating and critiquing each candidate’s platform.
A month ago, I wrote about what a transit platform should look like:
That sets out my philosophy of what I seek in a candidate, and the short version appears below. If you want the long version, click on the link above.
Service is key. Run as much as possible, everywhere, and run it well.
Build budgets based on what you want to see, not on what you think you can afford. Just getting by is not a recipe for recovery and growth. If the money doesn’t come, then look to “Plan B” but aim for “Plan A”.
Fares are a central part of our transit system, but the question is who should pay and how much. Strive for simplicity. Give discounts where they are truly needed. Make the transit system worth riding so that small, regular increases are acceptable.
Focus on ease of use among transit systems in the GTA, but do not equate “integration” with amalgamated governance.
Transit property: parking or housing?
Foster a culture of advocacy in management and on the TTC Board.
Beware of lines on maps. A “my map vs your map” debate focuses all effort on a handful of corridors while the rest of the network rots.
Plan for achievements in your current term and make sure they actually happen. Longer term is important, but the transit ship is sinking. You are running for office in 2023. Vague promises for the 2030s are cold comfort to voters who have heard it all before.
Full disclosure: I have always maintained an “open door” to anyone who wants to talk transit, and in this round I have been approached by both the Matlow and Chow campaigns for information and advice, as well as some media outlets. This I provided pro bono and without any “leakage” of who asked me what. No other candidates asked. How much of my input shows up in platforms is quite another matter. We shall see as the campaign unfolds.
In a previous article, I presented a proposed way to display service frequency on a route in a manner that, I hoped, would convey the pervasiveness of irregular service, be clear to casual readers, and in a consistent format. Several readers commented on this either on Twitter or via email, and I thank all for their contributions.
One immediate change, which I included in an addendum to the article, was to replace the vehicles/hour counts (which indicated how many buses or streetcars passed a point each hour) with an average wait time for a would-be rider. That time was calculated on a weighted basis to penalize long gaps in service.
The average wait time stat has other uses which I will explore later in this article.
My intent in developing this new type of chart is to add to the repertoire of charts I publish when reviewing a route’s performance and to show how, or if, changes the TTC makes to schedules affect service riders actually encounter.
For those interested in the details, read on. Again, comments are welcome. I would like to nail down the format before launching into a series of route reviews.
Updated May 26, 2023 at 5pm: In response to a reader’s suggestion, I have added a sample chart that includes average wait times for would-be riders in place of the count of vehicles. To jump directly to this update, click here.
In the many articles I have published trying to review service quality on the TTC, one topic has eluded presentation: how to chart service quality over a long period while preserving the hour-by-hour, day-by-day character of the data? That question has several dimensions because a quality metric is not simply a matter of pooling stats and saying that overall things are not too bad, or even worse that service meets some sort of standard on average.
In the past I have published charts showing headways, and others showing how organized (or not) service on a particular day might be, but it has been more difficult to condense months of data for multiple times and locations.
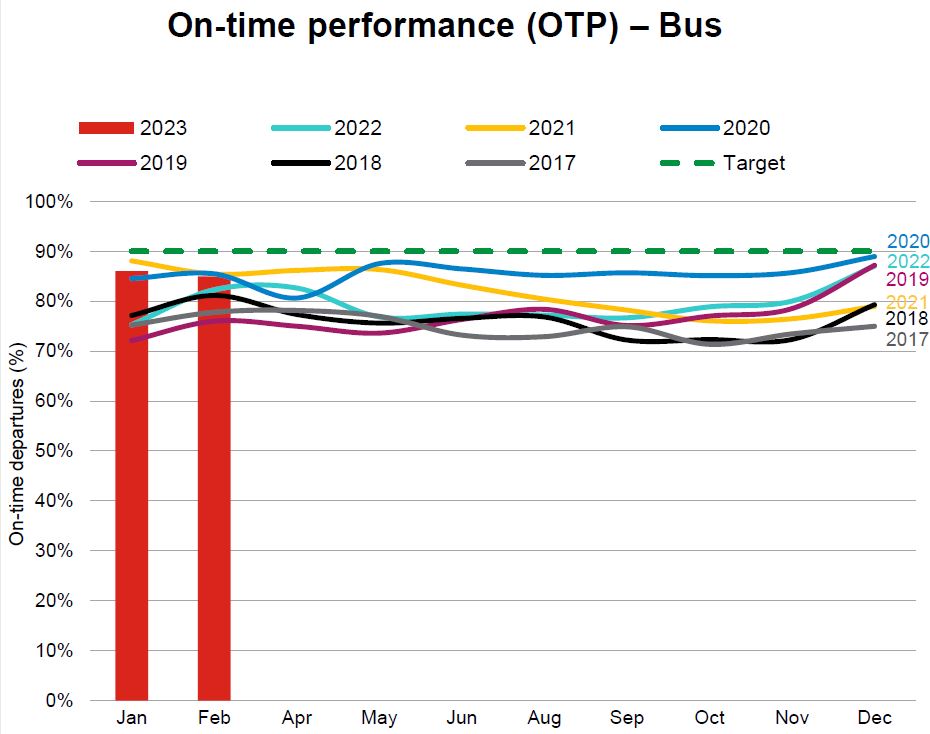
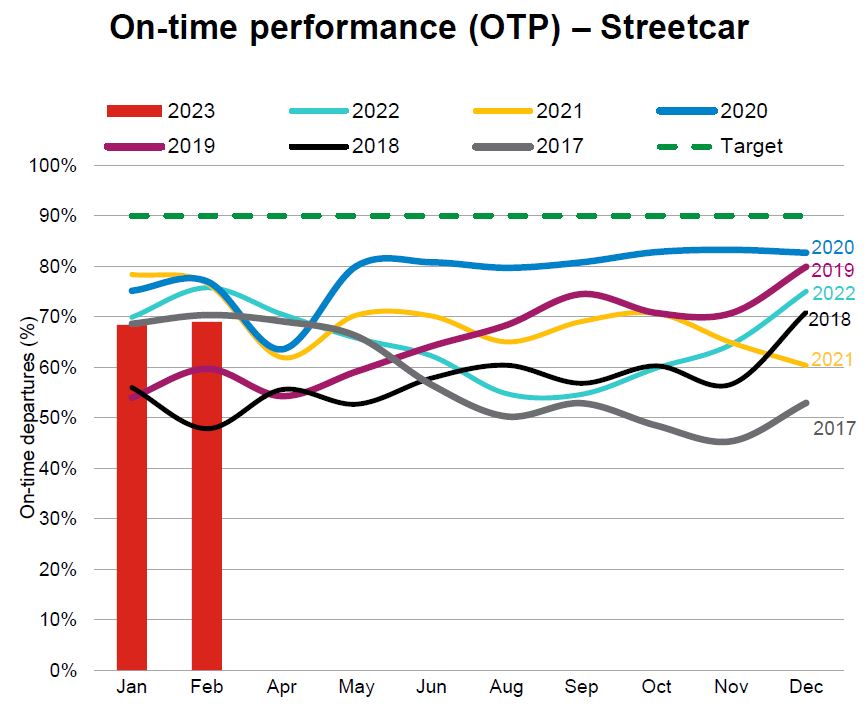
The TTC standard for surface routes is:
On-time performance measures vehicle departures from end terminals. Vehicles are considered on time if they depart within 59 seconds earlier or five minutes later than their scheduled departure time. (-1 to +5)
The intent is to hit this target 90% of the time, but the TTC does not achieve this with values typically falling in the 70-to-85 per cent range. At an individual route level results can be considerably worse. Streetcar routes fared worse with a 50-to-85 per cent range, and the higher end was achieved during the pandemic era when traffic and demand were light. The numbers have fallen since then.
The TTC’s metrics have big credibility problems because they bear little relation to what riders actually experience.
There are three major reasons:
Quality is measured on an all day basis, or worse on longer periods such as months. Variation by day and time is completely obscured by this approach. Reliable service at 10 pm is cold comfort to a rider whose bus has not shown up for 15 minutes in the peak period.
Quality is measured only at terminals, not along routes where various factors can degrade service that might begin well, but quickly deteriorates with bunching and gaps.
Service is measured relative to schedule on the assumption that “on time” performance will automatically be reliable. However, there is considerable leeway in that standard allowing irregular service to be considered “on time”, and the TTC does not even hit their target levels in many cases.
The CEO’s Report tries to work around the limitations of the metric by noting that some routes do farly well while others encounter a variety of problems. With respect to the bus network, the report notes:
Network performance was negatively impacted by the inclement weather the weeks of February 20 to March 10, where over 60 centimetres of snow fell on the city during this time. Weekday On-time performance was 88% for Weeks 7, 11 and 12. During weekends for the period, OTP was 82%. During February, 32 of 159 weekday routes were impacted by construction for at least three weeks of the period. Overall weekday OTP was 88% for the 127 routes not affected by construction:
48 routes were “On-Time” (90% OTP or better).
53 routes were “On the Cusp” (85-90%).
26 routes were “Not On-time” with OTP less than 85%. In summary, 80% of the routes not affected by construction scored 85% or better.
This still does not address reliability issues at the level riders experience. Moreover, for frequent service, riders do not care if a bus is “on time”, only that service is reliable. TTC assumes that on time service will, by definition, produce reliable service, but they don’t actually operate on schedule and fail to measure service as riders see it.
Irregular service also affects crowding because passenger loads are not evenly distributed. If most riders are on full buses, the following half empty vehicles are not part of their experience (except possibly their frustration with a long wait for the advertised “frequent” service). Average crowding stats do not reveal typical riding conditions. (Analysis of crowding is complicated by the limited availability of automatic passenger counter data outside the TTC. I have tried for a few years to obtain this without success.)
The charts show that bunching (headways of two minutes or less) and large gaps (20 minutes or more) are common, and that they exist across the four months of data here. They are not occasional effects, but a basic feature of TTC service. The stats at terminals, where the TTC takes its on time performance measurements, are less than ideal, but the service degrades as buses and streetcars move along their routes. Most riders do not board at terminals.
This article presents a proposed method of charting service quality on routes to provide both the detail of day-by-day, hour-by-hour conditions and a broader overview. The charts are an experiment in condensing a lot of data into a manageable size, but I am not wedded to the format. Comments are welcome. Regular readers will recognize the format from a previous attempt, but I hope this is an improvement.
The goal is to produce something that can track the quality of service over time so that the decline or recovery of TTC routes is clearly visible along with the effectiveness (or not) of any changes to schedules, transit priority or route management.
There are a lot of charts in this article, and it is a long read for those who are interested. Feedback on this method of presentation is most welcome.
Among various problems that became evident with the many route changes on May 7 was the deep mismatch between advertised and delivered service.
Both the 501 to Neville and the 505 to Bingham Loop were often missing in action short turning usually at Woodbine Loop (Kingston Road & Queen, named after the former racetrack).
Aside from the scenic tour the 501 Queen car takes via McCaul, Dundas and Broadview, plus the usual congestion on Dundas Street, another congested location was Broadview northbound between Queen and Dundas.
In that segment, three services, 501 Queen, 505 Dundas and 506 Carlton, were all queuing for the left turn at Dundas, compounded by 504/505 buses attempting to serve the northbound stop while blocking both lanes of traffic.
Under these conditions, it was impossible for any of these services to stay on time. The situation has been partly remedied by using traffic wardens to manage the intersection, but even that depends on ensuring that streetcars get priority all of the time despite the signal setup there.
As the week of May 7 wore on, I noticed that a lot of 506 Carlton cars were not getting east of Broadview. Riders complained about cars going out of service, and I received a tip from a reader about scheduled travel time changes.
This sent me into the electronic versions of TTC schedules which are published for use by trip planning apps and which also are the source for info on their own website. These files give a stop-by-stop schedule for each vehicle on a route and allow very fine-grained examination of the schedule design. What I found was quite surprising.
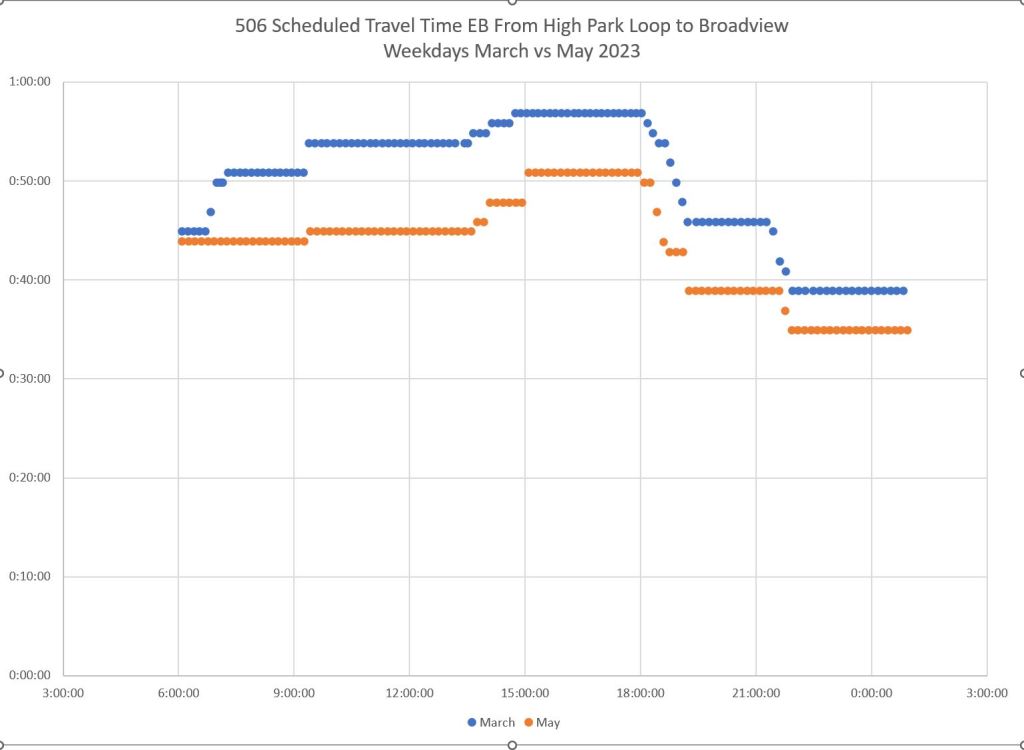
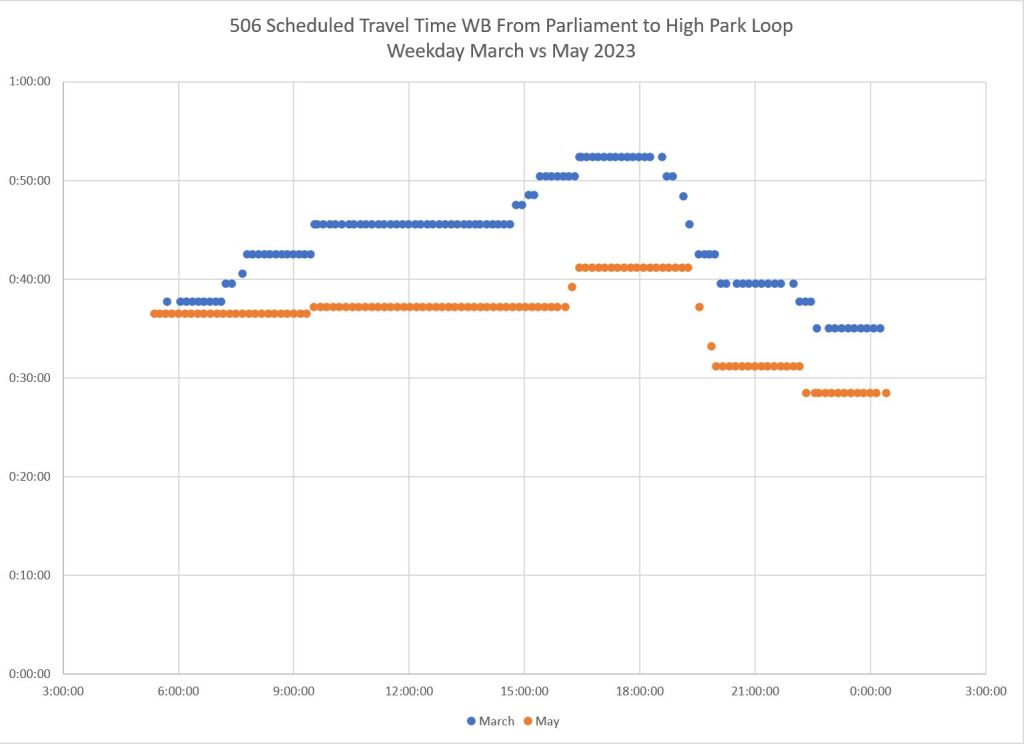
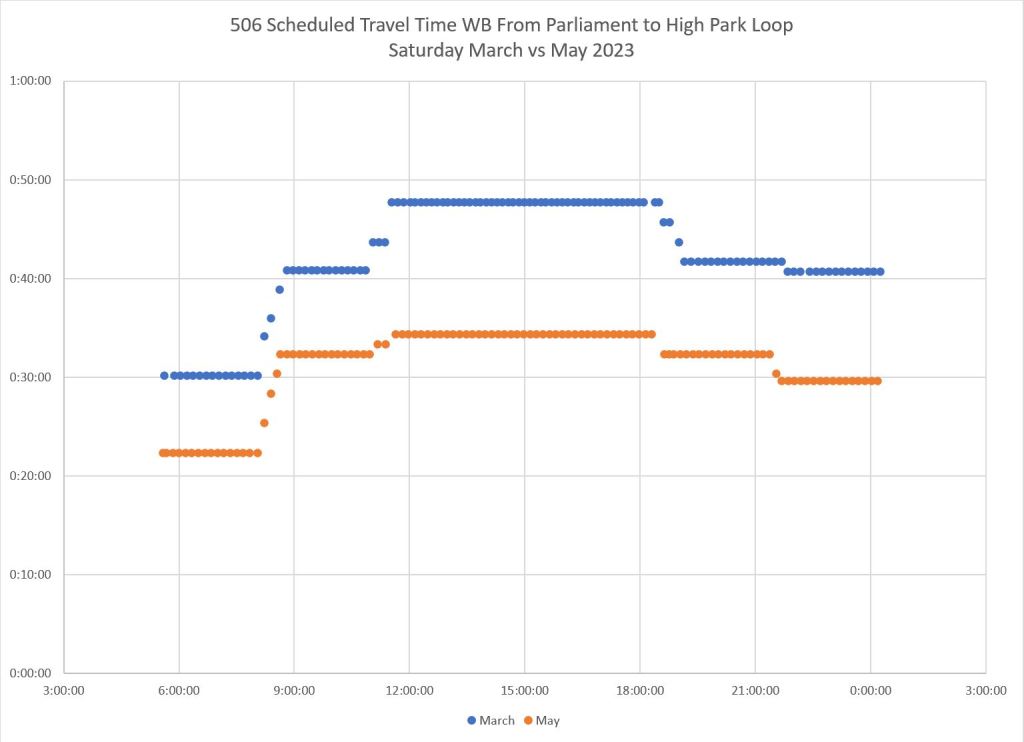
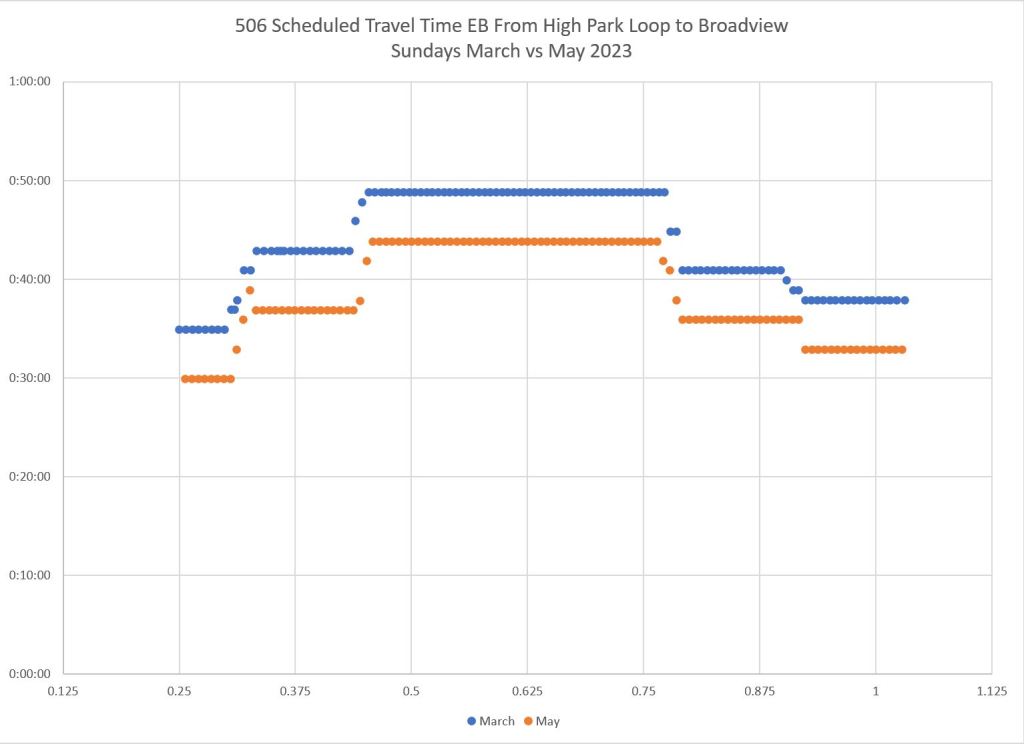
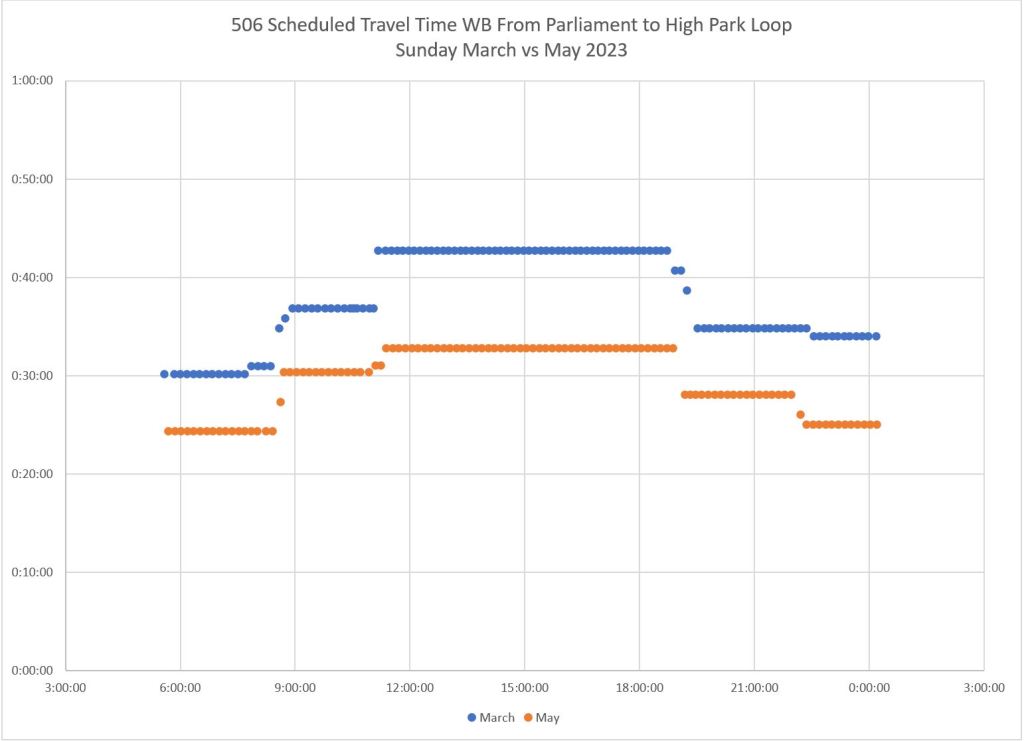
Over the portion of 506 Carlton common to the March 2023 schedules when all streetcars ran through to Main Station and the May 2023 versions with service diverting to Queen Street East, the running times were substantially shorter in May than in March. The schedule as designed could not be operated, and it has become common practice to turn most of the service back westward from Broadview. Here are charts comparing the scheduled travel times.
The eastbound comparison on the left covers the route from High Park to Broadview where streetcars turn off of their usual route. The westbound comparison covers the route from Parliament, where cars rejoin the route, to High Park. Each dot is one scheduled trip plotted with the departure time on the X-axis (horizontal) and the trip length on the Y-axis (vertical). Values move up and down over the day based on expected conditions on the route.
In almost every case the March travel time is longer than the May time. It is no surprise that streetcars have to be short-turned when the schedules work against them. How the schedules came to be designed this way is a mystery, but it creates big problems for riders.
This sort of thing cannot be corrected overnight, but in the meantime the TTC should formalize the route change and post notices everywhere so that riders know how the route will actually operate. New schedules will come in late July when Metrolinx closes Queen at Degrassi for preparatory work for GO corridor expansion and the Ontario Line, and all of the streetcar routes will shift north to Gerrard. With luck, they will reflect actual travel time requirements.
Shifting the westbound Carlton cars off of Broadview at Dundas reduces the number of turns that the intersection must handle per hour. A related issue will be the degree to which traffic wardens intervene to move transit vehicles through this choke point in the network. Both of these changes improve travel times for 501 Queen and 505 Dundas cars and could contribute to more reliable service east of Queen and Kingston Road to the two terminals. I will be monitoring this over coming weeks.
Footnote:
For the benefit of readers who don’t know the whole context, the 506 Carlton car normally operates to Main Station via Gerrard. During construction at Coxwell, it has been diverted via Broadview and Queen eastbound to Woodbine Loop. The westbound diversion runs via Queen, Broadview, Dundas and Parliament including a north-to-west left turn at Dundas because there is no track for a left turn northbound at Gerrard. (The TTC was planning to add one, but the message was lost somewhere in planning when the intersection was rebuilt.)
Darwin O’Connor has left a comment noting that you can get comparisons of scheduled and actual running times from his site TransSee.ca. Here is a chart comparing the situation for eastbound travel from High Park to Broadview in March (green) and May 2023 (red). The dots show actual travel times while the lines show the scheduled values.
Note that the green dots (March) are almost all below the green line, while the red dots (May) are almost all above the red line showing that with the new schedule cars would always be late, sometimes by a wide margin.
O’Connor notes that this type of analysis chart is available on his site free for the Toronto streetcar routes.
“What would it cost to put service back to pre-pandemic times?”
That question comes my way as riders deal with another round of service cuts, and would-be mayors vie for attention. The answer is not simple, but an unexpected statement at the recent TTC Board meeting surprised me at how low the barrier to full service was claimed to be. Responding to a question from Commissioner/Councillor Chris Moise, the TTC’s CFO stated that the cost would be $69.5 million/year.
Although hardly small change, that is a lot less than the depth of service cuts might imply. That sent me on a dive into TTC budgets and stats to validate the TTC’s claim.