TTC Board Meeting: May 18, 2022

The TTC Board’s May 18, 2022 agenda contained many routine items, but of interest were:

  • CEO’s Report
    • Advancing Analytics at the TTC
  • Establishment of a Human Resources Committee

CEO’s Report

The CEO’s Report contains the usual statistics about system performance, and there were few substantial changes from past months. These metrics deserve to be revisited along with the TTC’s Service Standards, and I will deal with them a separate article.

A frustrating problem with the CEO’s Report is that information in it is usually a month or more out of date. For example, ridership numbers are reported to the beginning of April even though it is now mid-May. In an environment where day-to-day changes in transit’s recovery from the pandemic have implications for service and budgets, more recent information should routinely be presented to the Board. It should not be up to Board members to ask staff for more recent figures.

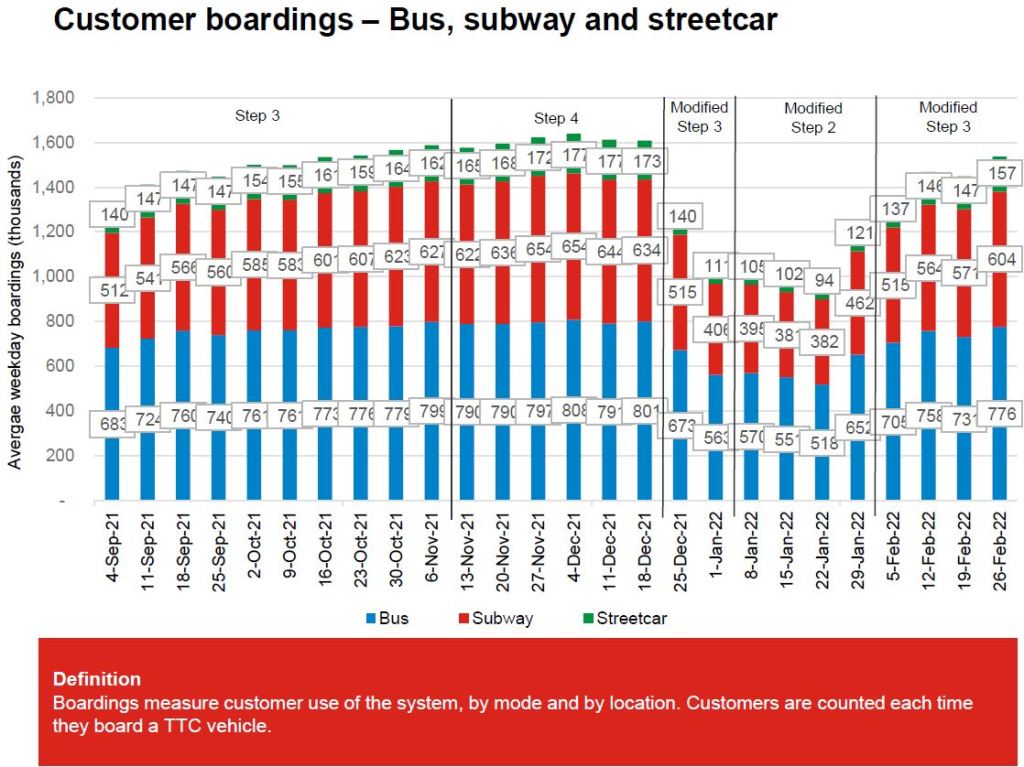
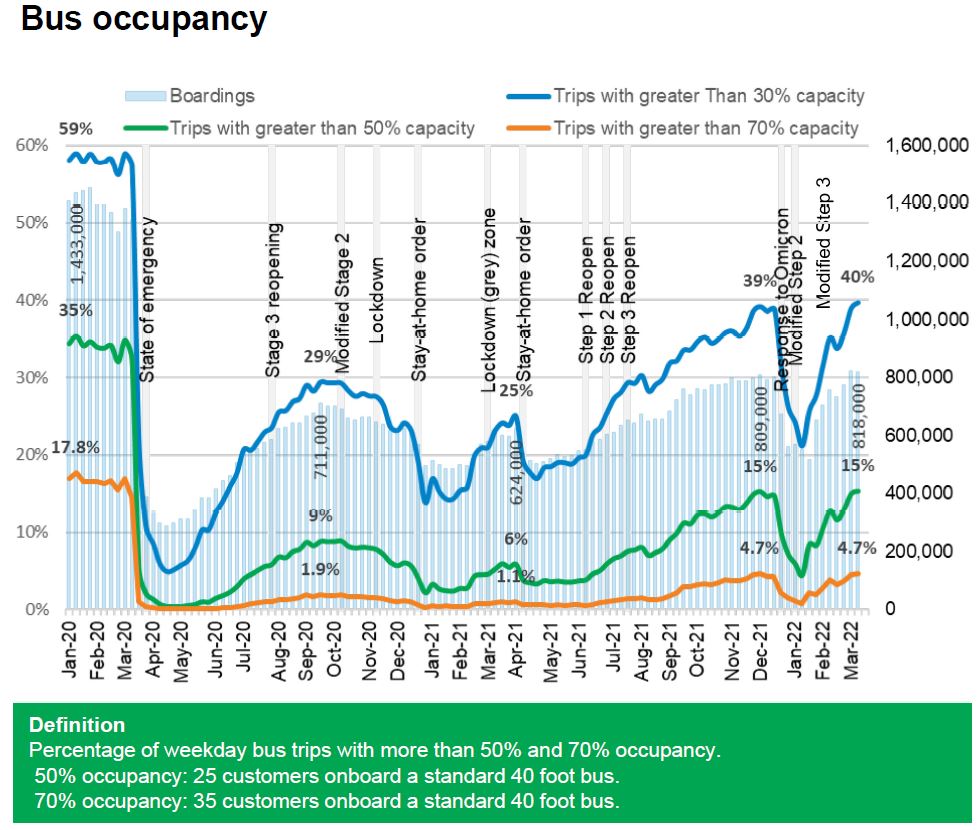
The chart of recovery by mode takes us to April 1. The effect of the omicron surge in December/January was quite substantial, and the system has only now built back to a level above the peak in late November 2021.

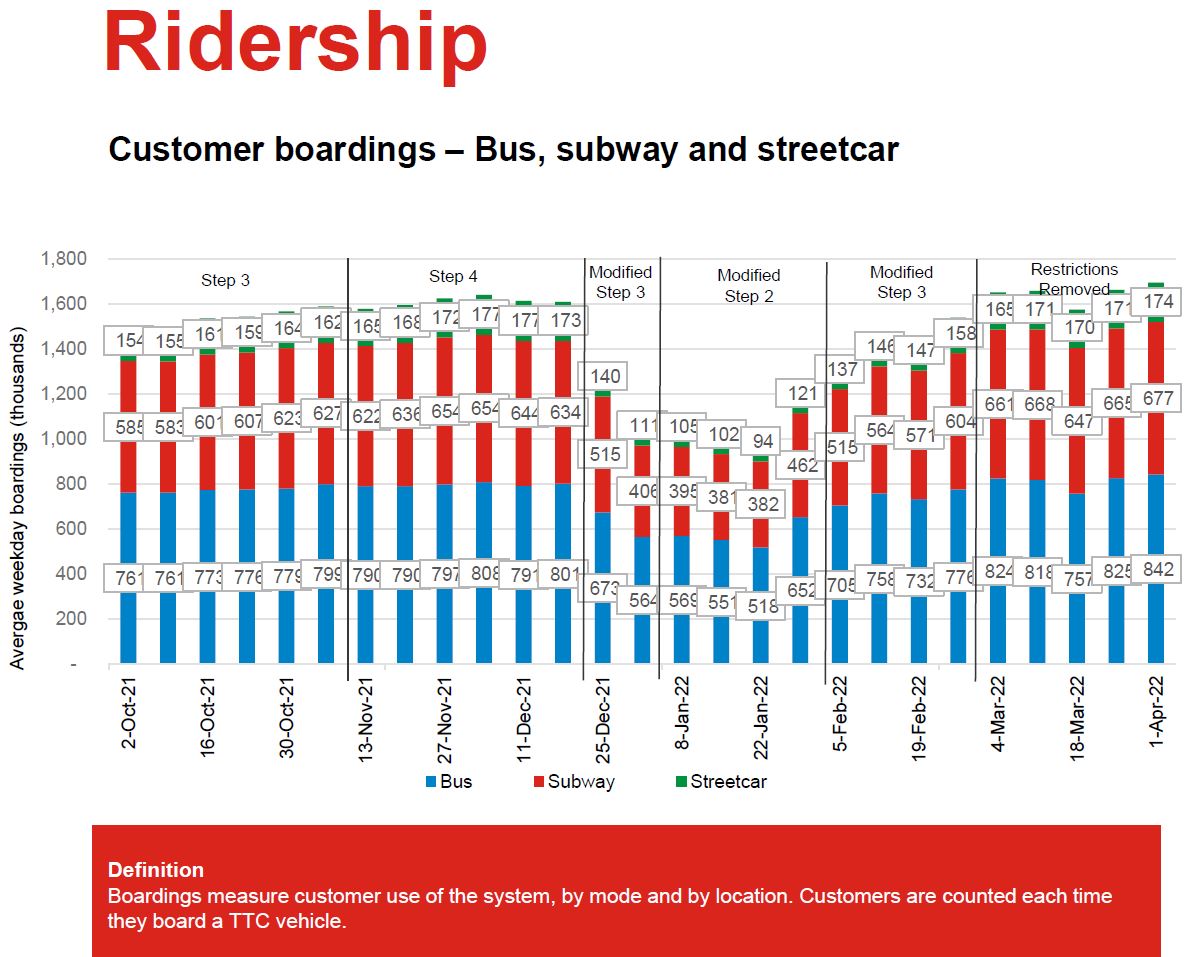
The values in the report are over a month old, and they were verbally updated at the meeting in response to a question.

Pre-Pandemic Recovery LevelApril 1, 2022 (Report)May 7, 2022 (Verbal Update)
System53%59%
Bus61%63%
Streetcar50%55%
Subway45%48%

Further details appear in the Advancing Analytics presention later in this article.

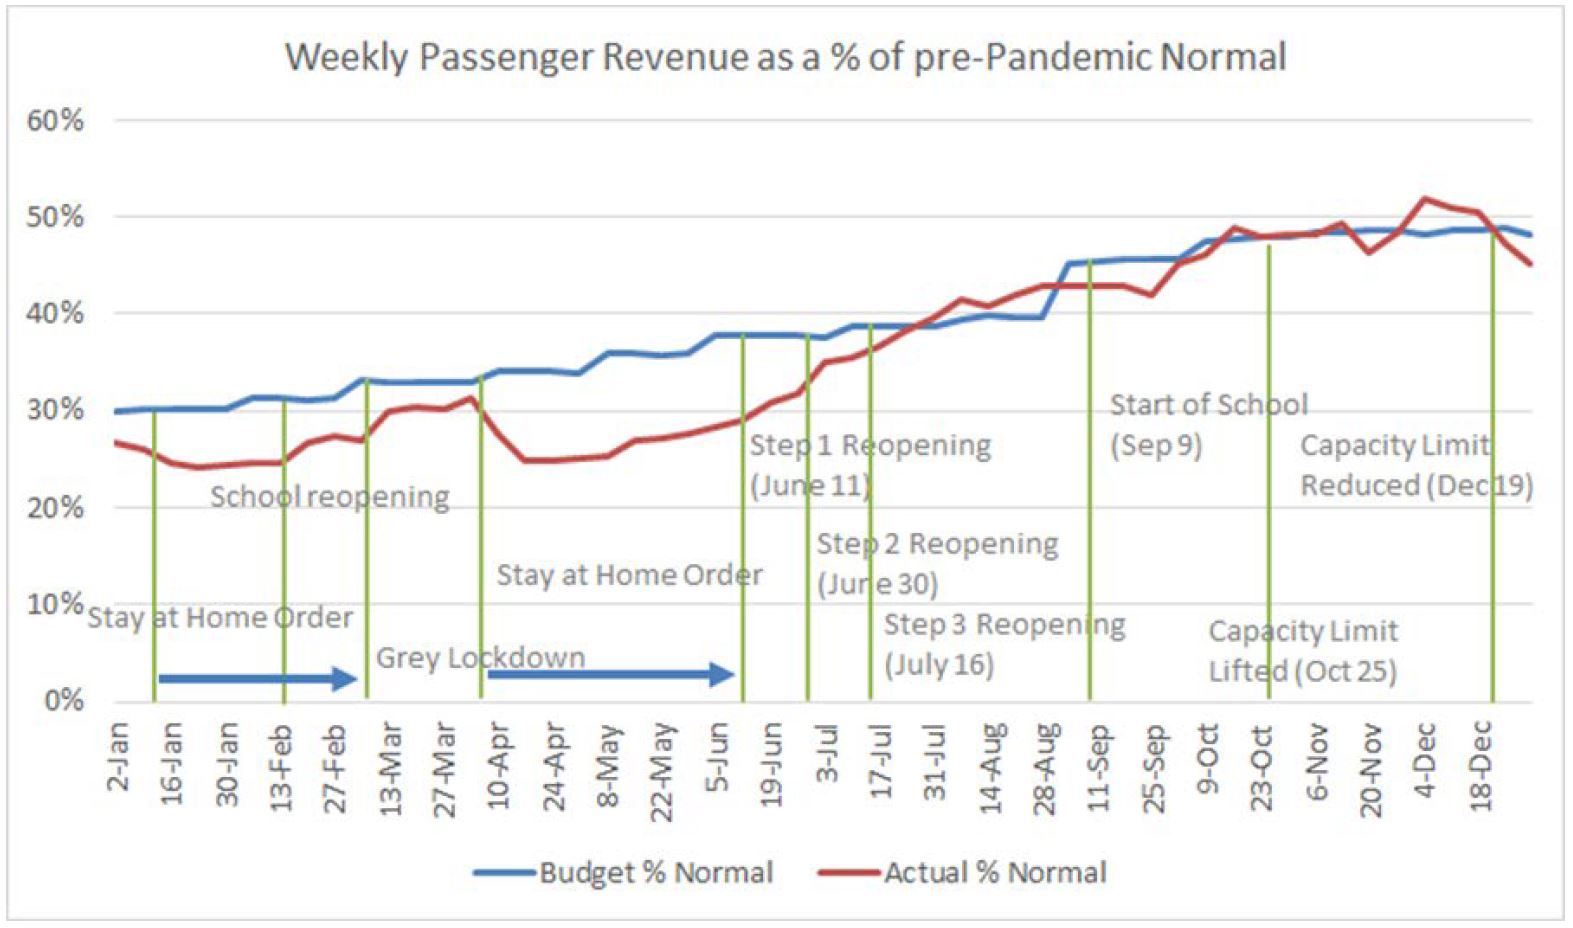
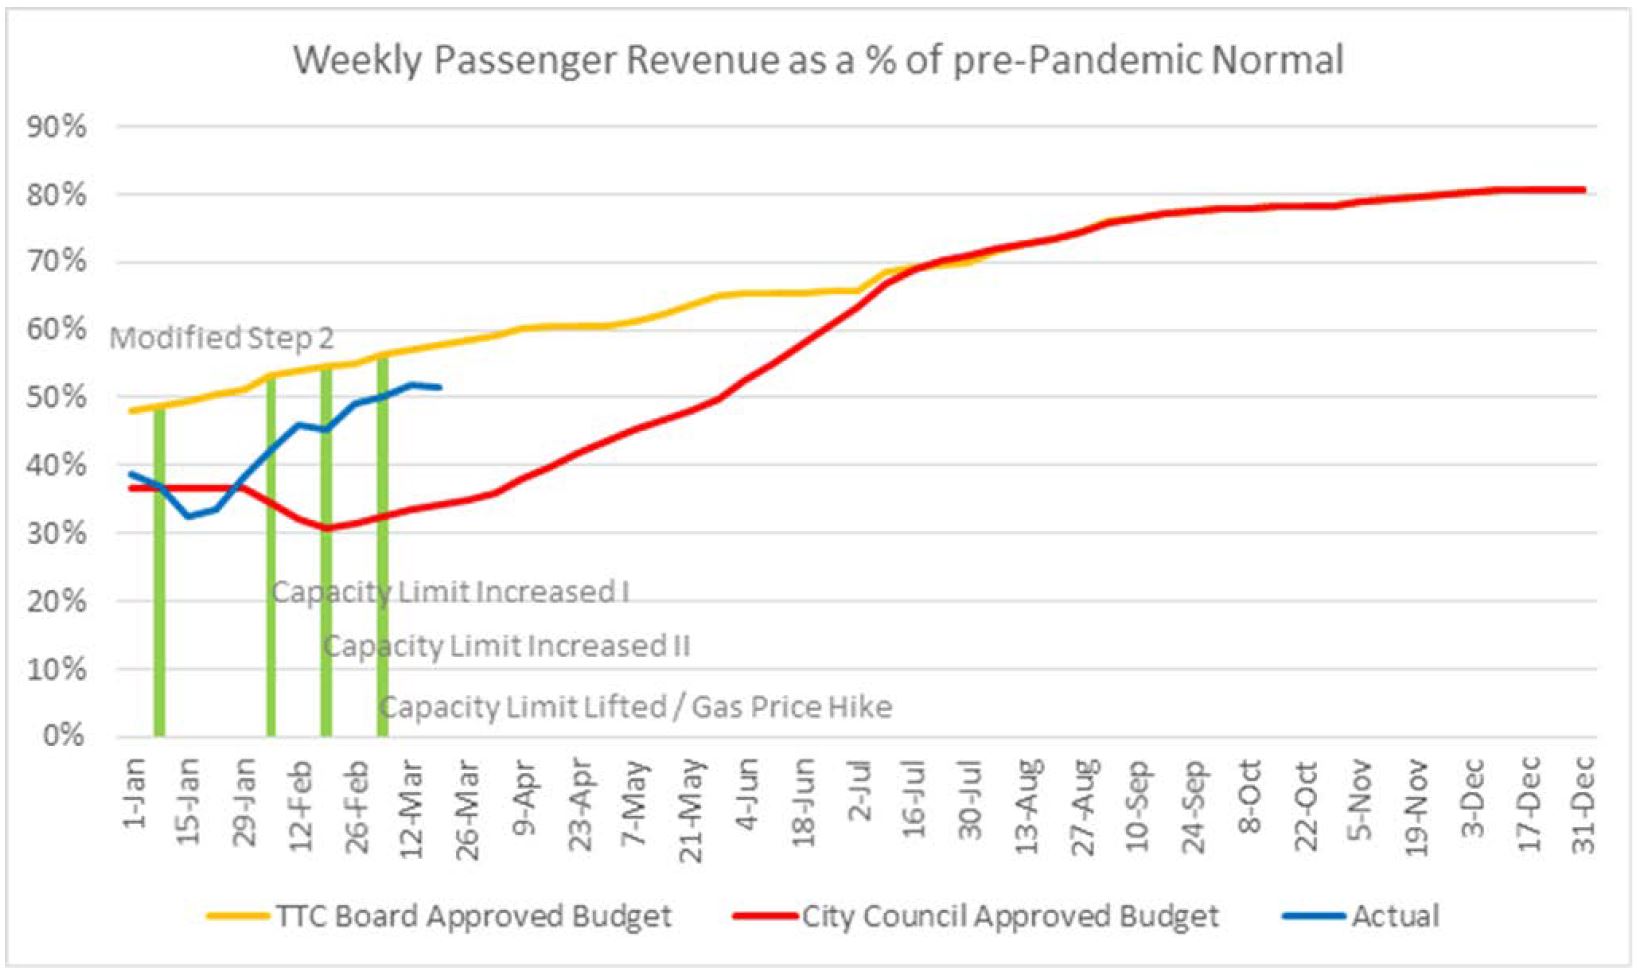
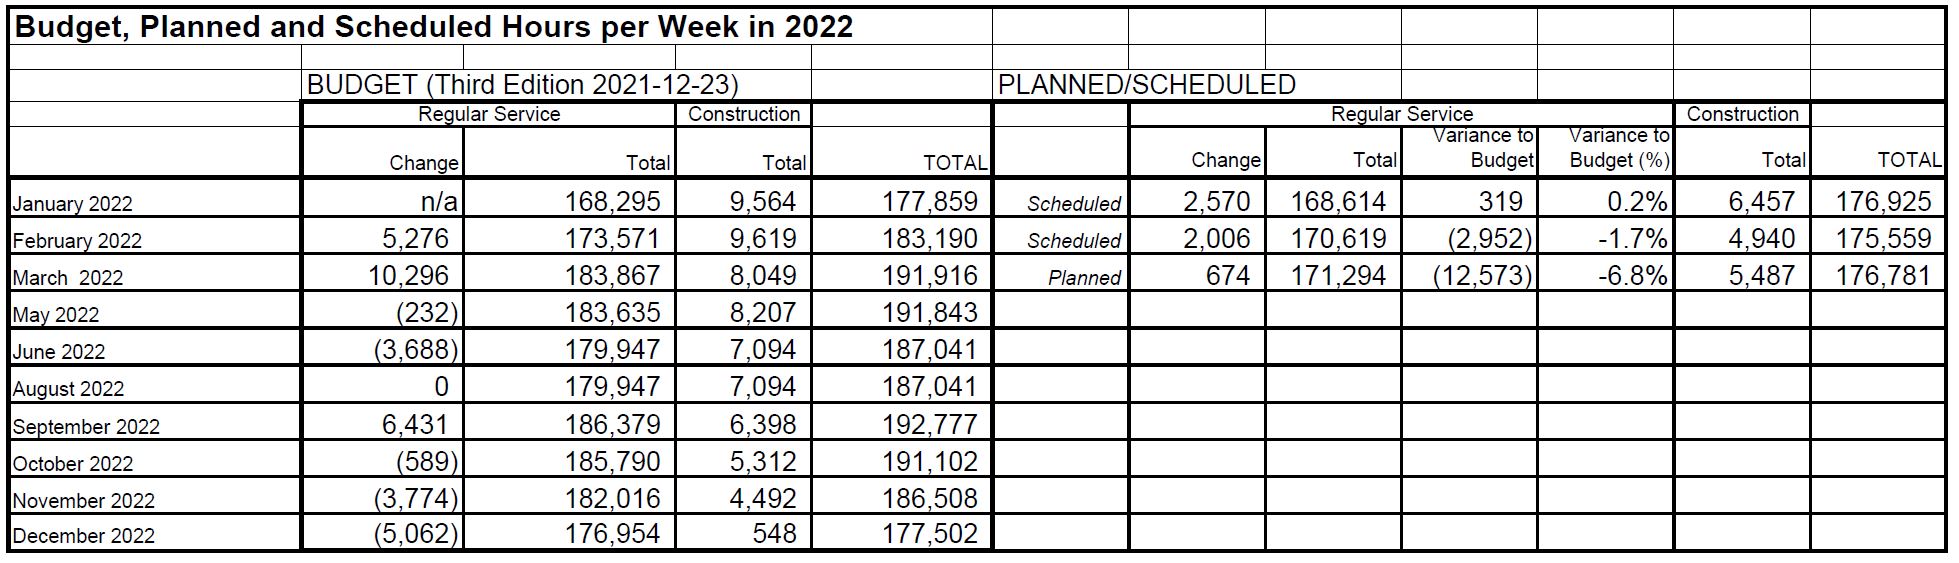
Revenue rides are running ahead of the budgeted level after a poor start in January. The TTC expects that on an overall basis through the year, the budget and actual numbers will balance out although the actuals are currently running ahead. Much depends on the rate of growth of in person office work and post-secondary attendance.

The actual revenue from fares for the first quarter was $140 million compared to the budget estimate of $107 million. The pre-covid normal value was $313 million, and so there is some distance yet to travel in the recovery.

The overall TTC and City budgets have not yet been made whole by extra provincial and federal covid relief funding, and the City faces a gap of about $800 million in its operating budget. To counteract this, there is a proposal to cut back on capital-from-current spending so that capital projects will not weigh as heavily on the operating budget. However, this will defer some projects planned for 2022 and can add to future costs if more work is paid for by borrowing than by current revenue.

The TTC is currently studying how to cut $87 million out of its 2022 Capital Plan as an offset to the City’s shortfall. The need for this work does not vanish. It is simply pushed further into the future and adds to the unfunded deficit in the overall capital plan.

Advancing Analytics

An important presentation in the meeting dealt with the analysis of TTC data. They have a wealth of information, but much of it is hard to get, and what should be routine stats on system operations are simply not available.

The TTC has now set up a group to pull together their vast collection of data and assist departments in making use of this under the name of a Centre of Excellence for Data Innovation. Examples of some of its work are included in the presentation deck, and the TTC intends to make much more publicly available soon. They also intend to provide access through an open data portal so that those outside of the TTC can make use of the data. (No details have been provided yet.)

Readers of this site will know of my long-running series of analyses of route operations, and these depend on access to vehicle tracking data that the TTC has provided since 2008. However, that is an ad hoc arrangement as opposed to one that makes data available to any who want it.

Here are some examples.

Access to Transit Modelling

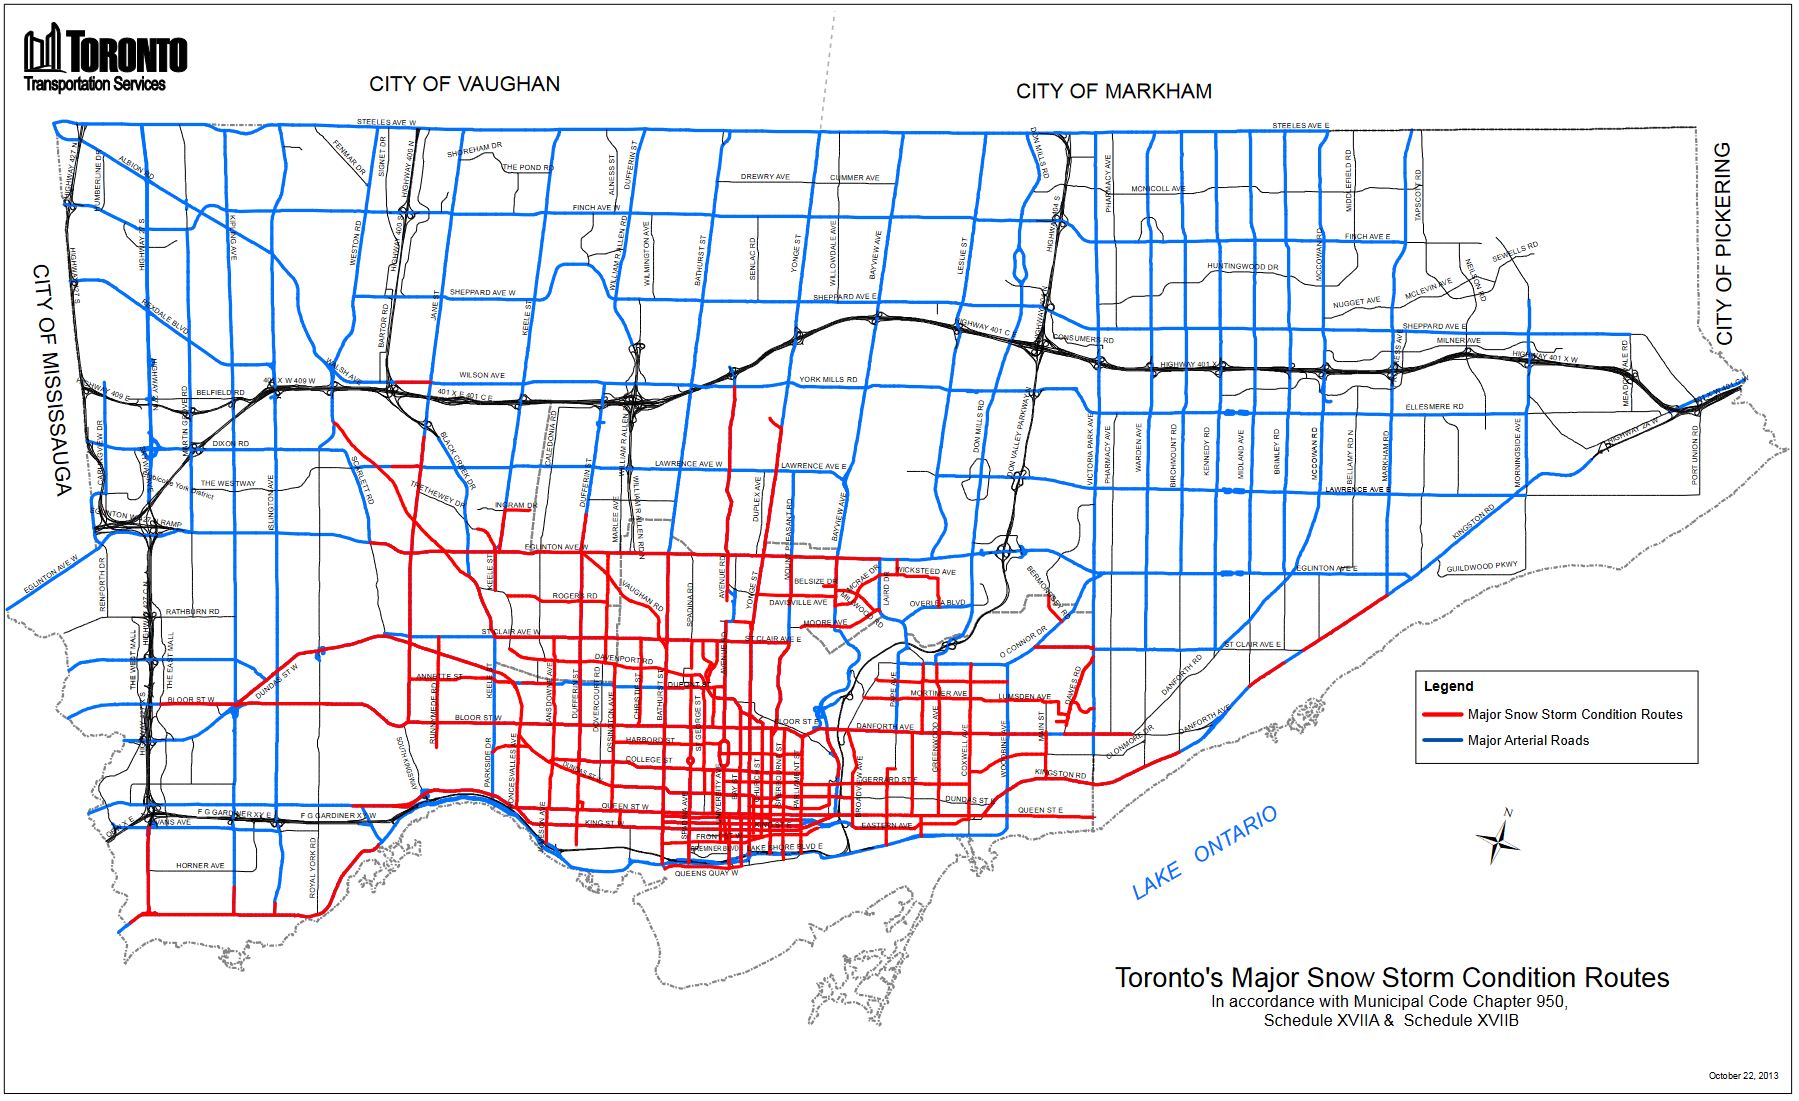
Using origin-destination data for various types of trips, the TTC has mapped the effect of Line 5 Crosstown’s opening and the associated surface route changes. The map below shows changes in the 60-minute range for job access. The improvements are, understandably, concentrated along the Eglinton corridor, but they also affect feeder corridors where the faster Eglinton segment brings more trips under the cutoff level. Areas where access falls arise from route changes that impose longer routes or transfers that do not exist in the “before” network.

Demand Modelling

TTC ridership has been reported on aggregated, averaged values across all routes and times of day. This masks issues with specific routes, times and locations where service does not meet the demand or the standards TTC aims for in an era when people still want some degree of social distancing.

The table below shows several major corridors and the differences both in time-of-day values and in individual routes versus averages. Hot spots that are invisible in consolidated numbers jump out in this table. The slide below notes that this information can be used for deployment of demand responsive service, although the TTC still is not reporting exactly where and when that service operates.
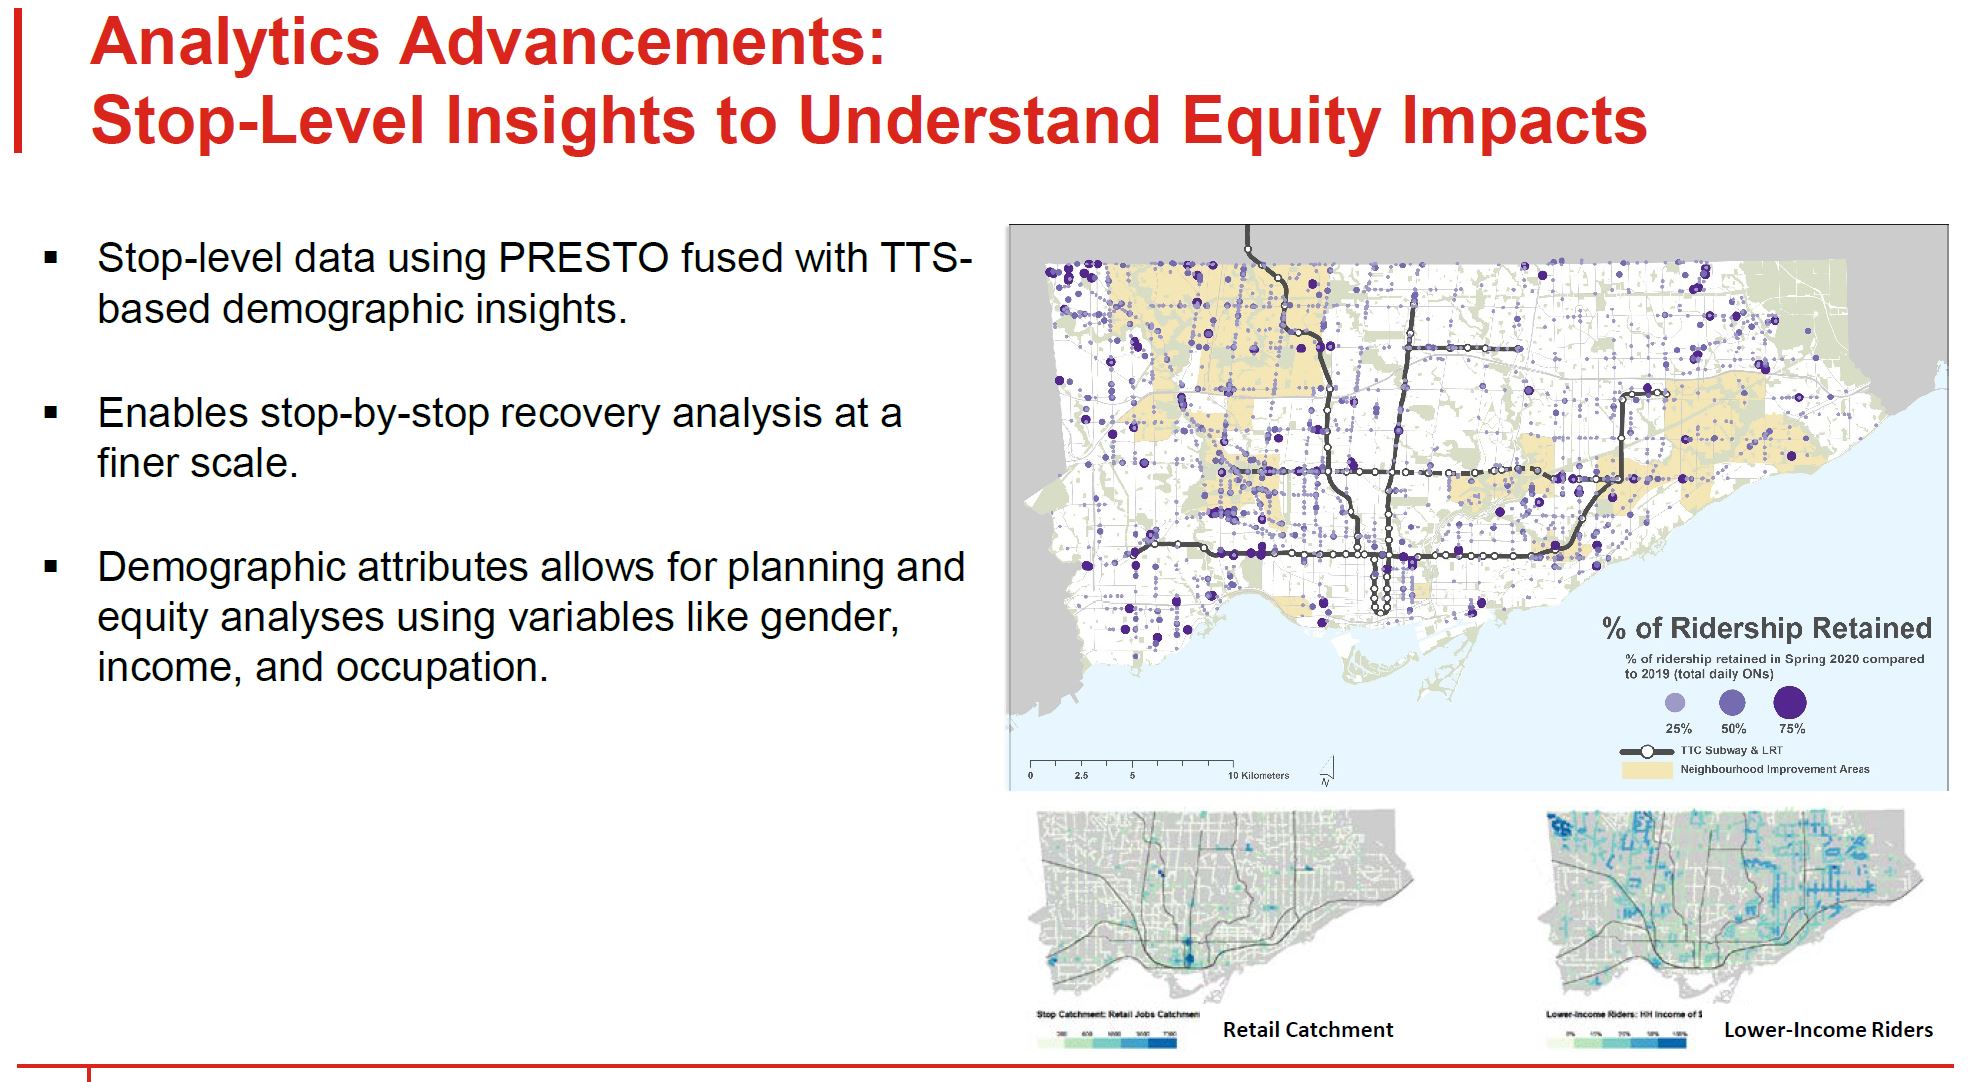
Stop Level Analysis

The chart below shows the percentages of ridership recovered on a stop-by-stop basis. Note that there are no data for streetcar lines because these vehicles do not yet have automatic passenger counters installed.

Many stops, particularly in the outer suburbs, show a strong rebound in demand as of Spring 2020, a year ago, with a 75% level. This is well above the overall system averages reported at the time, and shows how averages can mask behaviour at the local level.

Route-by-Route Analysis

The map below shows the bus routes where recovery of ridership has been strongest including a “top 10” that collectively achieved 69% of former boardings by April 2022.

One problem with this map is that how a route becomes part of the “top 20” is unclear. According to the legend, this is by boardings, and that should eliminate relatively minor routes. If the real ranking is by percentage recovery, this might make more sense. A route could be short and have few customers in absolute terms, but do well measured against pre-covid performance.

By Mode and Time of Day

The charts below show how ridership has returned to different parts of the system at different rates.

In the bus chart (left), the percentages give the ratio of Spring 2022 values (yellow) to Fall 2019 (light blue). The degree of recovery is not uniform across the day. For streetcar and subway routes, the relatively low peak period recovery is quite clear, but off-peak demand is stronger.

Anyone who rides the subway knows that it can be crowded in the off-peak, particularly evenings, because service is less frequent but ridership is returning. According to the TTC, subway service will be restored over the summer and fall, but they provided no details of quantity or timing. Like so many aspects of TTC service, this will be subject to “resource availability” (for which read staffing and budget headroom).

Use of WiFi Data for Ridership and Origin-Destination Surveys

The TTC is working with the provider of WiFi services in the subway to collect origin-destination data on an anonymized basis, and hopes to extend this to surface routes as WiFi is rolled out there. This has an advantage over Presto data in that entire trips are captured, not just points where passengers “tap in” to the system.

Continuing the Masking Mandate

CEO Rick Leary reported that the province was has established a date of June 11 for a possible change in the masking mandate. This was done in consultation with transit agencies.

Mask usage has started to fall, but surveys show that 94% of riders are masking, with 88% doing so correctly. Commissioner Carroll asked whether surveys are conducted across the system because adherence varies by time and location.

Whether anything more will come of this remains to be seen considering the possibility that the province will drop the mandate, and that TTC prefers to be non-confrontational on the issue.

Human Resources Committee

The Board, in private session, approved a proposal to re-establish its Human Resources Committee for reasons not stated in the public report. It will consist of Chair Jaye Robinson, Vice-Chair Joanne De Laurentiis, and one additional member to be chosen by the Chair from among Council members on the Board.

It is unclear why the Board would make such a move so close to the end of its mandate, and this implies that there are events behind the scenes serious enough to warrant Board oversight.

As a general note, the TTC Board has been lax compared to those in previous terms in its oversight of management because Councillors are so pre-occupied with covid effects on the city.

Postscript: Performance Data From Other Cities

Two examples of the type of data available in other cities are linked below. Note how the level of detail substantially exceeds what the TTC has produced over the past two years. This should be an inspiration for what Toronto could have. A hat tip on this to Jarrett Walker (@humantransit), Jeffrey Tumlin (@jeffreytumlin) and Ari Ofsevit (@ofsevit) on Twitter.

A Buck’s Worth of Blarney

Today the Liberal Party of Ontario announced that it would cut all, yes, all transit fares in Ontario to just $1 if they are elected. The cut would apply through to 2023-24 (the provincial fiscal year end is March 31), and is sold as a way to get 400,000 cars off of the road every day.

This is a plan so simplistic, so poorly-thought-out, that even Doug Ford could have authored it, possibly after a few of his short-lived one dollar beers from the last campaign.

Regular readers here will know that I view across-the-board fare reductions as little better than snake oil because they benefit people who do not require more subsidy while doing nothing to improve what they actually use, transit service. The Liberal plan goes even further by giving massive fare reductions to regional transit riders who now pay double-digits for a one-way ticket.

They show the monthly saving for a commuter from Barrie’s Allendale GO station as $434.30. In other words, this plan would see a Barrie commuter subsidized by over $5,000/year.

In a separate pledge, the Liberals promise $375 million in annual transit funding to support existing systems, more service and “more intercity connections”.

Let’s check the math:

Assuming that:

  • Each car represents at least two trips (fares) for a round trip (single occupancy)
  • The saving/trip is at least $2 based on local transit fares
  • The trip only uses one transit system (e.g. TTC, YRT)
  • There are 250 commuting days per year

This gets us up to $400 million per year.

But don’t forget that we’re giving a break to all of the existing riders, and just for the TTC that would be around 300 million rides per year, or another $600 million and change.

We have not even talked about other transit systems, or the much larger savings GO Transit riders would see.

The big problem, however, is that all this money will not buy one more bus trip’s worth of service. That forlorn display in transit’s shop window will not improve one bit even with a big sign “Sale, Only $1!”.

Buck-a-ride will not deal with the last mile problem of getting people who now drive to their transit trip be it a local bus stop or a parking lot.

Already, the TTC reports that it is increasing service on some routes because of crowding. Where will it put a large influx of new riders, assuming that they appear?

In the short term covered by this proposal, the TTC has some surplus vehicles (albeit no operators to drive them) because they are not yet back to full service across the system. Even at full pre-pandemic service, they had a generous number of spare buses.

Systems elsewhere in Ontario do not have the robust demand we see in Toronto and could have more headroom for growth within existing operations, but the ability to carry all of those new riders without extra operating costs should not be assumed.

With this announcement, the Liberals have side-stepped commenting on the really big issues like the scope of transit expansion they would fund and their vision for planning that doesn’t start and end with subway tunnels.

When they get around to publishing a platform, we might see how transit fits in their wider scheme of spending and priorities across the many government portfolios. For the moment, this is a cheap, ill-conceived piece of campaigning from the man who turned Metrolinx into his own photo-op generator, the Minister for Kirby Station.

TTC Service Changes: May 8, 2022

Several of the service cuts implemented in November 2021 will be restored with the May 2022 schedules. This includes express service on several routes. Although planned service will be 6.2% lower than the original budget for this period, the TTC intends to resume restoration of full service through the fall to the end of the year.

Information in this article is taken from the May 8, 2022 Scheduled Service Summary and from a copy of the detailed memo on service changes which was provided by a source. Normally the TTC sends these to various people in advance, but for some unknown reason, the document has not officially been sent to the normal external recipients.

There are some conflicts between information in the two documents and I have tried to reconcile these with my own judgement about which is correct because it is not unusual for there to be discrepancies in descriptions of service changes.

Rapid Transit Services

There are no changes in rapid transit services.

Streetcar Services

  • The 501H/501L Queen replacement buses for service on the west end of the route will be shortened to turn back downtown via University Avenue, Adelaide Street and York Street rather than operating to Broadview & Gerrard or Broadview Station.
    • Eastbound buses will operate as 501U.
    • Bus service will be provided from Birchmount, Queensway and Eglinton divisions.
    • There is no change to the existing 501 Queen streetcar service between Neville Loop and Bathurst Street (Wolseley Loop), nor to the 301 Blue Night Bus operation.
  • Headways on 505 Dundas and 506 Carlton will be blended to allow for the shared terminal at High Park Loop.
    • The 505 Dundas routing change to High Park Loop will be officially recognized in the schedules.
    • Service will be reduced during most periods on both routes as a seasonal change.
  • 306 Carlton Blue Night will operate with buses to Dundas West Station.
  • 509 Harbourfront: Seasonal service increase evenings and weekends.
  • 512 St. Clair: Service increase on weekdays.

Bus Services

Routes With Express Service Changes/Restorations

  • 29/929 Dufferin:
    • Local service improved during most periods on weekdays.
    • Weekend service rescheduled for articulated buses.
    • Weekend express service restored using artics.
  • 939 Finch East Express:
    • Weekend service restored.
  • 41/941 Keele:
    • Local service changed from articulated to standard buses on weekdays with improved frequency of service.
    • Midday express service restored.
    • Express operation changed to articulated buses.
  • 43/943 Kennedy:
    • Minor service reallocation on weekday local service.
    • Peak period express service restored.
  • 52/952 Lawrence West:
    • Service reliability adjustments weekdays
    • Express peak period service improvements
  • 60/960 Steeles West:
    • Seasonal service reductions
    • Reliability changes
  • 68/968 Warden:
    • Reliability changes and some weekend service improvements.
    • Peak period express service restored.
  • 85/985 Sheppard East:
    • All 85 local service on weekends will now operate with standard sized buses rather than with artics.
    • Weekend 985 express service restored.

Diversions

Note: These diversions are described in the service memo, but are not reflected in the scheduled service summary.

  • 31 Greenwood:
    • Effective approximately May 18, service will be diverted to Coxwell Station while the loop at Greenwood Station is closed for Easier Access construction. This work will last about one year.
  • 57 Midland
    • Service reliability adjustments.
    • Northern terminus shifted to the Redlea cul-de-sac via Steeles and Redlea.

Other Changes

  • 365 Parliament Blue Night Bus:
    • Weekend service that was removed in error in fall 2021 will be restored.
  • 73 Royal York and 76 Royal York South:
    • Service reliability improvements
    • During some periods, the 73B Eglinton service will interline with the 76B Queensway service.
  • 83 Jones
    • Recovery time reallocated to the south end of the route to reduce conflicts near Donlands Station.
  • 95 York Mills:
    • Stops added on Durnford Road and Rylander Blvd for the 95A Port Union extension. These will be reviewed in advance of the September 2022 schedule changes.
  • Service reallocation affecting some periods on the following routes:
    • 16 McCowan (peak periods)
    • 17 Birchmount (peak periods)
    • 36B Finch West (am peak and early evening)
    • 81 Thorncliffe Park (peak periods)
  • Service reliability changes which generally widen headways during most or all periods:
    • 30 High Park
    • 31 Greenwood
    • 57 Midland
    • 62 Mortimer
    • 77 Swansea
    • 93 Parkview Hills
  • Service reliability changes rebalancing driving/recovery time with no change in service level:
    • 33 Forest Hill
    • 101 Downsview
  • Service improvements:
    • 31 Greenwood (peak periods)
    • 33 Forest Hill (peak and weekday midday)
    • 83 Jones PM (peak periods)
    • 86 Scarborough early evening Zoo shuttle (restored, seasonal)
    • 92 Woodbine South (weekends, seasonal)
    • 996 Wilson Express (weekday midday and pm peak)
    • 175 Bluffer’s Park (restored, seasonal)
  • Service reductions:
    • 75 Sherbourne: AM peak and midday (seasonal)
    • 600 Run As Directed: The number of crews/buses assigned to RAD service will be reduced by about one third as full scheduled service returns.

With the restructuring of bus service in the waterfront and the creation of the 121 Esplanade-River route, there is no existing route to provide seasonal service to Cherry Beach or Ontario Place. Two new routes, 172 Cherry Beach and 174 Ontario Place-Exhibition will operate instead.

172 Cherry links Union Station to Cherry Beach. It will operate from Eglinton Division.

174 Ontario Place links Exhibition Loop to Ontario Place. It will operate from Mount Dennis Division.

Details of the changes are in the spreadsheet linked below.

The Cost of Running Line 5 Crosstown

At its meeting on April 14, 2022, the TTC Board will consider a report about the arrangements with Metrolinx for operation of Line 5 Crosstown. This line, at least from a budgetary standpoint, is expected to open late in 2022.

There is a long agreement between Toronto and Metrolinx about how the costs are shared and who does what, and a much longer Project Agreement between the province and Crosslinx, the private consortium that built and is responsible for maintenance of the infrastructure and equipment.

Within the TTC report, these two documents are referred to as the “TOFA” and the “PA”.

Even with Toronto keeping any revenue the line generates, the net result will be an increase in the TTC’s costs. On an annualized basis, the net new cost to Toronto is $62.6 million annually. This is not surprising, but a fascinating point about this table is that the maintenance contract and other non-labour costs total $52.8 million while the labour and benefits for TTC staff (station, on-train, supervision) amounts to only $26.4 million.

This illustrates the substantial cost of owning and maintaining infrastructure as opposed to running the trains.

Responsibility for aspects of the route are divided among the parties as shown below.

Continue reading

TTC Ridership and Financial Update, April 2022

The TTC Board agenda for its April 14, 2022 meeting includes two reports that show the current status of ridership, as well as the financial situation both for 2021 and 2022.

It is possible that some of this will be updated in the staff presentation at the meeting, and if so, I will revise this article.

Ridership

With various waves of Covid-19 and associated shutdowns, ridership has not been recovering at the rate hoped for when the 2022 budget was prepared. That budget was amended during its trip through City Council to take into account lower projected demand through at least the first part of 2022.

Through early and mid-2021, ridership was below budget, but caught up again later in the year. This still left 2021 overall with a shortfall.

The effect of Omicron shows up in comparing the originally budgeted ridership (yellow) with the projected approved by Council (red) and with actual results to date (blue). Depending on the evolving health situation, the actuals could catch up to the original budget sooner than expected, but this could also leave a deficit for the year as a whole depending what happens in coming months.

The ridership habit is changing for the better in a small way. The proportion of riders using passes or who tapped 10 times or more per week rose in February from 16% to 19% with a corresponding drop in occasional or infrequent riders. The pre-covid proportion of frequent riders was 32%, and so the system still has a lot to recover within that group.

Ridership by mode has improved in early 2022 although it is still not back to fall 2021 levels. Bus ridership has consistently been the strongest reflecting the type of trip and traveller in areas served by buses where work-from-home is a less viable option.

Overall, the TTC expects that the March stats will see them crossing the 50% line for current-vs-prepandemic boardings, and this will trigger a build-up to former service levels through the year.

Bus crowding continues to be an issue, although the TTC does not break down stats by route and time of day. The proportion of trips at various capacity levels has grown back to late 2021 levels by the end of March 2022. This does not reveal how crowding is concentrated, and the percentages can be diluted by trips at off-hours and on routes that typically do not have very heavy demand.

There is also the question of uneven headways that can lead to crowding variations as I have discussed in many articles here. The basic point is that although a total of 40% of trips run at less than 30% capacity, the remaining 60% of trips have more riders on them, and the average riding experience is determined by what they see. (For example, if 60 riders are distributed between two buses with 45 on one and 15 on the other, a poll of all riders will reveal that most riders see a crowded bus even though the average load is only 30.)

Continue reading

“Snowmaggedon” and the Dufferin Bus

On January 17, 2022, a record snowfall hit the Toronto area. Yes, this is Canada, and it does snow here, although people who live in areas without the moderating effect of Lake Ontario rarely have much sympathy on that score.

A post mortem report on the event will be discussed on March 29, 2022, at the Infrastructure & Environment Committee. As the City’s report on the event summarizes:

On January 16-17, 2022, the City of Toronto experienced an extraordinary winter storm that involved extreme cold temperatures, very rapid snowfall, and an ultimate snow accumulation of 55 centimetres in just 15 hours. The below freezing temperatures that followed the storm and lasted for more than two weeks created a unique set of challenges for storm clean up.

The effects on transit routes were severe, and there was little or no service on parts of the network for an extended period.

Snow clearing took a very long time:

Ultimately, 179,442 tonnes of snow were removed from 3,471 km of roads, requiring almost 60,000 truckloads. Removal was conducted over a 30-day period; however, operations were suspended when additional snow events occurred, meaning snow was removed on a total of 23 non-consecutive days.

Toronto’s snow clearing practices tend to focus on major streets and often do not include physical removal of snow. This effectively narrows roads and limits their capacity until the snowbanks eventually melt. A history of warmer winters and fewer severe storms has contributed to a somewhat laissez-faire relationship to winter that failed Toronto in 2022.

The report speaks to several changes in approach to major storms that will be implemented in early 2023, and I will not go into these here beyond noting the effect on transit.

Two related problems do leap out.

First, the responsibility for various aspects of snow clearing fall to different groups. Roads and sidewalks were plowed by multiple contractors. Sidewalks were, until this year, the responsibility of property owners, but the city’s fleet of sidewalk plows was not yet at full strength, and subject to breakdowns. Bike lanes might or might not be plowed especially if they are simply painted and have no protective barriers.

The result is both a “who does what” clash and a war for space where snow can be dumped before it is carted away, if ever.

Second, the reduction in road capacity causes congestion both by taking lanes out of service, and by parked cars, to the extent motorists can navigate the snowbanks, encroaching beyond the curb lane. This is a particular problem on streetcar routes, but is not confined to them.

Plowing, when it does occur, may not be accompanied by aggressive towing, or at least by temporary relocation of parked cars so that the curb lane can be fully cleared.

Toronto has a network of designated snow routes for major snow events. Most of the territory it covers is in the old City of Toronto with some outlying areas. When a major storm condition is declared, parking is banned for 72 hours (or more if need be) on the streets shown in red below. Most of the suburban city is not included.

The map below is dated October 2013, and it is due for updating especially if Toronto plans to be serious about the quality of transit service and meaningful schemes for transit priority across the city.

In Brief

The major snowfall on January 17 disrupted transit service, and the effects continued for a few weeks after the event. In some cases, buses had not returned to “typical” pre-storm travel times into February.

The location of congestion problems on routes reviewed here was not distributed along them a a general delay, but could be found at specific locations and times where the effect was “net new” after the storm. This suggests that a detailed study of storm delays will reveal key locations and conditions that should be avoided in the future.

On Dufferin, a major location for delays was northbound to Yorkdale Mall, and this persisted for some time after the storm. Normally, problems on routes like this are assumed to arise from their hilly nature, but that was not always the case in late January.

Continue reading

TTC Service Changes Effective March 27, 2022

Service on several bus routes will change on March 27, but overall the amount of service operated is almost unchanged from the February 13, 2022 schedules.

There is no change in subway service, and the only planned changes for streetcars are those beginning in early April for reconstruction at Dundas West Station.

The table below shows the budgeted overall service expressed as weekly operator hours compared with the scheduled and actual values. It is clear that the budget planned to ramp up service substantially by late March, but with the less-than-expected ridership recovery thanks to Covid, this has been deferred.

Planned regular service for the new schedules is 6.8 per cent below the budgeted level. Construction-related service is also below budget, but this has somewhat less effect on the operating deficit because much construction service is funded through the associated capital projects.

The next round of schedules will take effect in mid-May, and by that time the usual seasonal cutbacks start to kick in. We will not really see the degree to which the TTC ramps up to budgeted service levels until September. As a point of comparison, the budgeted regular service in January 2020 pre-pandemic was just under 186,000 hours/week.

Many routes will see a mix of service cuts and improvements through reallocation of hours and vehicles between periods of operation. Some “reliability” improvements involve longer travel times and layovers than in current schedules often with wider scheduled headways (the time between buses). Some of these routes will become candidates for a comparative analysis on this site of before and after service reliability later in the spring.

An important change for the March 27 schedule period is that the number of “biddable crews” (work that is scheduled but for which no operator is pre-assigned) has been reduced from about 160 to 55. This reflects an improved balance between operator staffing levels and the scheduled service. These crews are filled on an overtime basis, or possibly by spare operators or re-assigned “run as directed” (RAD) buses. When these crews are cancelled, this translates into service gaps unless the remaining buses on affected routes are adjusted to run on a wider, but even headway. This has been a pervasive problem on some routes as shown in recent articles here about service reliability.

The number of RAD crews will increase notably on weekdays from 53 to 75 8-hour crews. These buses are used to supplement service, and they also serve as shuttles for service interruptions and subway shutdowns.

Continue reading

TTC Board Meeting Wrap-up: February 8, 2022

The TTC Board met on February 8, 2022. Several hours were spent in private session on items that reported only by name in the agenda. They primarily relate to litigation (one item involves an as-yet unsettled claim regarding a contract for the Spadina Subway extension to Vaughan) and Labour Relations.

This article includes comments on:

Continue reading

TTC 2022 Service Plan Update

The TTC Board will consider the final version of the 2022 Service Plan at its meeting on February 10, 2022.

See:

To avoid duplication, I will only discuss here items which are new in this version.

The big system-wide change coming later in 2022 will be the opening of Line 5 Crosstown and the restructuring of the surface network. The proposals are the same as in the draft version of the plan, and I will not discuss them here.

[Page numbers cited in this article refer to those within the “glossy” version of the Service Plan which follows the covering report at p. 18 of the linked pdf.]

What Riders Want

One page from the plan is really a vital part of the whole discussion. Some riders want better connectivity, but a good chunk of this is about service quality and quantity. Sadly, there is little in the TTC’s plans that will address this issue beyond restoring service more-or-less to pre-pandemic levels.

Those of us who remember the “before times” will know that simply putting back bus, streetcar and subway hours is not enough. There were problems with service before covid, and the pandemic shuffled what had been a growing debate off the table.

Ridership recovery, let alone growth, will require that transit be as good as it can be, not merely good enough to get by.

2022 Annual Service Plan, p. 6
Continue reading

TTC Heads Toward Fare Capping, Flat Fares, No Zones

At its meeting of February 10, 2022, the TTC board will consider a report on the future transit fare structure in Toronto.

In May 2022, TTC management will present a final recommendation for the Board’s endorsement, but this month’s update takes us a considerable way along the road to a new structure transit fares. For the past two years, TTC staff have consulted with interested members of the public while following an overall policy framework approved by the Board.

Source: Advancing the 5-Year Fare Policy, p 15

The evaluation found, to no surprise, that no fare scheme can achieve all of these goals, and in particular “financial sustainability” (for which read “no increase in subsidy”) and any change to make fares more attractive will work at cross-purposes. The idea that somehow new riders can be attracted in sufficient numbers to offset costs is a convenient fiction spouted by those whose real agenda is to cap spending, not to improve transit.

Many fare schemes were considered, and many were discarded for various reasons.

Those that survived to the final round of evaluation were:

  • Free fares
  • Full cost recovery
  • Fare capping
  • Aligning concession fares
  • Removal of the cross-boundary YRT-TTC extra fare
  • Peak/Off-peak pricing
  • Group Travel Discount
  • Reduce the TTC children-ride-free age limit to 5 from 12
  • Set the Senior concession fare to 20% of the Adult fare
  • Remove the Senior concession

Notable by its absence in this list is any form of fare-by-distance or fare zones. These options were dropped because of the inequity they would pose for riders whose trips tend to be long, but whose incomes are not high (residents of the outer part of Toronto).

It is no secret to readers of this blog that I have always supported the flat fare concept not just for its value to long-haul riders, but for its simplicity. Schemes that purport to make riders pay proportionately for their riding tend to increase the complexity and cost without a comparable or better return in making transit attractive. Indeed, the higher fares this would bring drive away the very trips, long journeys, that we do not want shifting to autos while giving a bonus to riders who make shorter hops typically “downtown”.

The fare policy report recommends that the TTC:

1. Continue to support the TTC’s existing fare structure, which includes the flat fare, free two-hour transfer across all modes and the Fair Pass and age-based discounts as the hallmarks of the TTC’s fare policy;

2. Endorse in principle the opportunities related to fare capping and aligning concessions across Fair Pass, Seniors and Youth as detailed in the Comments section of this report to inform the final fare policy recommendations that will be presented to the Board for approval in May 2022; and

3. Direct staff to forward a copy of this report to the Ministry of Transportation to restart discussions on reintroducing the Discount Double Fare (DDF), the TTC-GO Transit co-fare to offset Line 3 closures.

Source: Advancing the 5-Year Fare Policy, pp 1-2
Continue reading