This article is the third and last in my review of the April 11 TTC Board meeting. Apologies to readers for the long articles, but this happened to be an agenda with a lot of information that collectively gives a tutorial on the state of the transit system.
Updated May 6, 2024 at 11:30am: The section about farebox cost recovery has been updated to correct arithmetic errors in the original version, and a table is added to show the calculation.
Every quarter, TTC management produces a Financial and Major Projects Update, and this one covers the period to year-end 2023 including the financial results for Operations and a review of the Capital projects portfolio.
Within the Operating results are warning signals about the long return to pre-covid ridership, revenue and cost projections, and declining sources of funding including City reserves. On the Capital side, as is often reported, there is a very large shortfall between projected needs and known funding. This is compounded by long-running capital projects for fleet replacement, known and possible system expansion projects and the conflicts between political motivations and actual needs for facilities, fleet and future service.
Also included in this article are comparative figures for 2019, the last full pre-pandemic year.
On the TTC Board agenda for April 11, 2024, a long report describes the TTC’s 2024 Asset Management Plan. This document has been in the works for some time. It arises from an Ontario Regulation in 2017 and a City Council Corporate Asset Management Policy adopted in 2019 whose intent is that there is long term sustainability and accountability for City assets. The TTC as a local Board of the City is subject to this policy.
This is a long article reviewing an even longer document. For a general overview, some readers may prefer to stop at the break just before the chart of “condition scores”. The remainder of the article reviews some of the detail in the Plan, its strengths and shortcomings.
General Observations
Although the document gives a unified impression in its design, it was produced with information from many sources in the TTC. Some of these, notably for the streetcar system, betray unfamiliarity with various assets, or a sloppiness in editing. Some information is dated and reflects conditions a year or more ago with little or no mention of works in progress and how they would affect the review. Any future budget planning must be based on current, accurate data.
As with so much information reported by the TTC, far too many data are reported as overall averages without the granularity needed to flag key problems. Some projects risks are described as if no work has been done when in fact they might be well on the way to completion. Was it just too much trouble to accurately portray the state of some assets? That is troubling in the context of other events throwing the TTC’s ongoing maintenance practices into question.
One section of the Plan deals with “systems” which, in many cases, are networks of devices. A failure within a system does not necessarily affect just one part, but can have a farther reach as seen in the recent fire near Islington Station. Moving up a level from that, the Plan is divided into major topic areas, and several of these are related although the plan treats them as separate entities. This subdivision is, in part, dictated by Provincial Regulation.
Trains need cars, but they also need track and power, not to mention stations. It is important to see the transit network both as a complex collection but also at the detailed level. One thing the Plan does is provide a tutorial for those who only know part of the system, notably the politicians responsible for funding transit and choosing its goals.
An important part of any asset plan is the recognition of alternate futures depending on what is done, or more critically not done, in the short-to-medium term. The cumulative effect of deferred work during economic downturns is not immediately apparent, but can create a backlog requiring significant effort and spending just to get back to “normal” conditions. If deferrals last long enough, they affect corporate culture and become the accepted way of doing business. An organization can forget what proper asset management and maintenance look like after years of aiming for a too-low target.
Funding partners grouse about above-inflation cost growth when their own penny-pinching, coupled with management making the best of a bad situation, created the situation in the first place. It is important to recognize the difference between higher costs through factors like materials and labour, and higher spending required to reverse a backlog of overdue work and restore the system to good, steady-state condition.
An issue that appears in several parts of the Plan is the effect of vehicle electrification. This touches the bus fleet and related maintenance and charging facilities, and the non-revenue fleet. The change in propulsion and control technology affects maintenance workers who must adapt and be trained, as well as the equipment needed to support an electric fleet. Electrification is not just a matter of buying a new style of bus, but a pervasive change in a large part of TTC operations that will extend over a decade.
We may reach a point where diesel-hybrids are regarded as a minor “legacy” fleet from days gone by, but that time is a long way off. Co-existence of two modes will continue for many years.
The City has contemplated but not yet adopted a long-range goal not just to fully electrify transit operations, but to very substantially increase service levels. This would have a pervasive effect on the entire asset base, staffing and future budgets. The Plan includes an overview of proposed rapid transit expansion, but there is no discussion of the service increase scheme.
Overview
The 2024 Plan sets out the TTC’s many classes of assets, their condition, ongoing maintenance and replacement cycle and some information on cost. This leans heavily to the Capital side of TTC budgeting and the large known shortfall in committed and likely funding over the next 15 years. Some information is incomplete because the TTC data collection is still underway.
While this Asset Management Plan meets the requirements of the Regulation for 2024, the next phase of compliance, due on July 1, 2025, requires the TTC to have a financial plan that identifies the funding needs to ensure all assets the funding to ensure all assets are maintained in a state of good repair to meet future levels of service. The 2025 Asset Management Plan will also further inform the preparation of the TTC’s Capital Investment Plan (CIP). The TTC’s 2024-2038 CIP has identified a total of $47.855 billion in base capital needs over a 15-year period, of which $12.398 billion is funded, leaving $35.457 billion in unfunded capital needs.
2024 Asset Management Plan, Covering Report at p. 7
That paragraph does not break out “State of Good Repair” (SOGR) items from the overall budget, and yet that will be essential in deciding where to allocate available money. Moreover, the focus here is on Capital with no mention of day-to-day maintenance funded from the Operating budget.
A sense of the TTC’s scale is given early in the Plan:
The scope of assets that the TTC owns and manages is large and varied, and comprises of the vehicles, infrastructure, facilities and support systems necessary to operate and maintain the TTC’s bus, subway and streetcar services. The asset inventory changes regularly as new assets are commissioned and older assets are decommissioned at the end of life.
The vehicle fleet consists of 2,572 accessible buses (including 250 paratransit Wheel-Trans buses), 204 streetcars and 143 subway trains, with the fleet and other asset classes supported by more than 900 non-revenue vehicles. There are a further 6,400 small and 1,900 large items of industrial equipment, which support the maintenance of TTC assets.
The TTC maintains more than 70 kilometres of mainline subway track across three active lines (following the decommissioning of Line 3 in 2023) and 388 kilometres of Streetcar Way. Streetcars are powered by 454 kilometres of overhead/traction power feeders and 368 kilometres of overhead contact system.
Across the subway and streetcar network, the TTC is responsible for the maintenance of 77 box structures, 43 bored tunnels, 75 bridges, four culverts, 170 retaining walls and 474 miscellaneous structures. In addition there are 38 overhead structures that are maintained by the City. The Prince Edward Viaduct is jointly maintained by the TTC and the City.
The vehicle fleet is stored, maintained and operated from 22 separate facilities located across the TTC network, which include garages, carhouses, yards, and shops. There are also 58 substations to support movement of fleet and provide power to the facilities. Across the subway network (including the now decommissioned Line 3), there are 75 subway stations with 164 elevators and 329 escalators moving both passengers and freight. The TTC also maintains more than 9,500 bus and streetcar stops/shelters, alongside two bus terminals and nine Wheel-Trans hubs.
Corporate and professional services also operate from five administrative buildings across the city, and the TTC maintains 29 other buildings, including emergency service buildings, operator convenience and waiting rooms, as well as a number of parking lots.
Operation of transit services across all three transportation modes is facilitated and supported by communication, signalling, electrical and mechanical systems. These systems are made up of many thousands of individual assets, with further details contained in the relevant sections of this Plan.
TTC Asset Management Plan 2024 at p. 7
Assets are divided into five classes as specified by the Regulation, and their total replacement cost is $25.1 billion. They vary quite substantially in age with some being over a century old (early streetcar facilities) to quite recent. The condition of each class also varies.
Considering the known cost of projects now planned and in progress, to the degree these are revealed, these numbers could well understate the true replacement costs. A related complication is the ownership of some assets by Metrolinx, but their operation as part of the TTC network.
Some assets are consolidated in this table in part because the source data are in insurance reports organized for that purpose. For example, IT Systems are included under the contents of Facilities, not under Systems. However, there is no detailed review in the Plan of IT systems, their age and technology, nor of their need for “state of good repair”.
Class
Replacement Cost ($ billion)
Condition
Fleet
Revenue vehicles (buses, streetcars, subway trains), non-revenue vehicles, and the industrial equipment used to service those vehicles.
$7.1
2.1 (Good) to 3.7 (Adequate)
Linear Infrastructure
Subway track, Streetcar track and overhead power.
$2.8
1.0 (Excellent) to 4.0 (Marginal)
Facilities
Storage and Maintenance facilities, subway stations, administrative buildings; bus and streetcar stops.
$5.0
Unknown – Not enough data exists to provide a rating.
Systems
Communications systems, signals, electrical systems, and mechanical systems.
$1.1
1.0 (Excellent) to 5.0 (Critical/Poor)
Structures
Box structures, bored tunnels, stations, bridges, Prince Edward Viaduct (track beams and sidewalks), culverts, retaining walls, and miscellaneous structures.
$9.1
Very Good to Very Poor
Total
$25.1
Of particular interest in this list is the group Structures which holds over one third of the replacement value for the system. This is rarely mentioned in funding and priority debates, in part because much in this category has a very long lifespan. However, as the subway ages, proportionately more structures enter a period where preventative maintenance is essential, and in some cases major reconstruction is needed. (This is a separate systemic issue from basic problems of new subways with water penetration and other faults from the day they open.)
A second group, Facilities, includes the above ground part of the system and, like Structures comprises many assets with long lifespans such as buildings. These too have ongoing preventative maintenance needs but with a lower profile than new trains or signals, let alone new lines, for funding.
Much recent discussion of State of Good Repair focused on the Capital Budget and shortfall, but substantial day-to-day work is required to keep various assets in good shape. A shortfall in the Plan is a sense of the cost, adequacy or funding of this work even though it is integral to preventing a decline in asset quality. This ties into recent discussions about system maintenance.
Life cycle activities and the point at which they occur vary between assets according to their inherent nature, the required level of service, their operating context, use and condition. As assets approach the end of their serviceable life, life extension programs may also be implemented to prolong service life ahead of replacement or renewal. However, it should be noted that as assets near the end of service life, the maintenance cost will increase significantly. Details of the life cycle activities applicable to each asset class and the sub-assets within each class are contained in the relevant sections of the attached plan.
2024 Asset Management Plan, Covering Report at p. 6
Under each subclass of assets, there is a discussion of related risks. These show how some aspects of any Plan and Budget are related, although generally at a time frame where effects are not immediately obvious. For example, if the average age of a fleet rises, then more running maintenance is needed plus a life extension program. This affects both the Capital and Operating Budgets.
Because subsidy arrangements for these budgets differ, avoidance of Capital spending might trigger a rise in Operating spending at a higher rate for the City (or higher fares) because a lower proportion of the Operating Budget comes from other governments. However, at the local level, the temptation to “make do” can lead to declining maintenance, reliability and service.
The 2024 AMP, prepared in accordance with the requirements of O. Reg. 588/17, affirms that an estimated 50% or $12.6 billion of TTC assets are entering, or in some cases, are well into their twilight years.
If half of the assets are “well into their twilight years”, this is not an overnight change, but rather the effect of many years of deferred maintenance and replacement. This is particularly true of the subway network which was once brand new and required less maintenance, let alone replacement of major components. However, as infrastructure ages, it can move “into the twilight” with ongoing plans and budgets based on earlier years.
Proper funding should not just maintain the existing rate but grow to reduce and keep overall asset ages within a range of reliable service.
Particular concern over the lack of funding for state of good repair applies currently to:
Line 2 Bloor-Danforth subway elements (power, signals, communications systems, and vehicles) that are at/or approaching end of life.
Facilities maintenance of garages, yards, carhouses and various other buildings (HVAC, roofs, structures, elevators, escalators, and plumbing).
Bus fleet with the majority now over halfway through its lifecycle.
The streetcar network will predictably be at risk within five to 10 years without capital funding commitments for rehabilitation.
2024 Asset Management Plan, Covering Report at p. 7
Overall funding, of course, must respond to both the existing system and service as well as growth. Discussions of “growth” focus politically on major new rapid transit lines, but this can sideline plans and funding for general increase in service quantity and quality across the network.
An important part of any Asset Management Plan will be recognition of future costs that will be triggered by system expansion of both rapid transit and surface networks. Only two years ago, Toronto agreed to take on the operating and non-lifecycle costs of the Eglinton line, but that did not last. In the short term, the Toronto-Ontario “new deal” includes funding for operation and maintenance of Lines 5 and 6, but not for expansion of the existing service.
The TTC has many plans, but several of these tie back to the Annual and 5-Year Service Plans. After all, it is mobility and hence service that the TTC provides, and medium to long range aspirations for service affect the entire organization. Service might sit an the heart of the chart below, but one would be hard-pressed to see this in a typical debate at the TTC Board or Council.
Over the years, a troubling aspect of TTC debates is that “service” comes last in the discussions and is always “subject to budget availability”. Rarely is there an aspirational view of the transit network and its future. A desire for more service can run headlong into the currently planned level of fleet and facilities growth.
Attempts to engage in such discussions trigger rounds of “we can’t afford it” or “not now, maybe later” that hamper a strategic approach to all TTC planning. The lead times to scale up parts of the system require sustained commitment. It is ironic that we are willing to wait a decade and more to get a new rapid transit line, but will not invest in the short term to enhance and expand the existing system.
The Plan’s primary function is asset management. It is not a forward planning document to pursue “what if” questions about possible transit futures, although it does acknowledge that current plans have implications. Only recently did Council grasp the effect of getting many new rapid transit lines built by Ontario, but with the expectation of local funding for operations. The Ontario-Toronto “new deal” delayed, but did not eliminate this problem. Running more service and maintaining more infrastructure costs money that fares will not cover.
Level of Service
In 2013, the TTC introduced its first 5-Year Corporate Plan with the vision: To be a transit system that makes Toronto proud. The next 5-Year Corporate Plan is due to be published in 2024 and forms part of an integrated planning and performance framework the TTC utilizes. This framework demonstrates how the goals, objectives and intended outcomes of the TTC can be achieved through the alignment of key business planning activities. In addition, the 5-Year Service Plan & 10-Year Outlook (2020-2024) identifies service-related improvements to public transit service in the city of Toronto. An updated version (2024-2028) is expected to be published in 2024.
The Service Plan also identify [sic] how the TTC is responding to growth requirements, meeting the challenges of changing ridership demands and meeting the financial challenges of maintaining existing service levels and upholding the state of good repair. Given the significant pending growth in the size of the transit portfolio, it should be noted that there will be an increase in funding pressure to sustain the existing level of service for the asset portfolio.
2024 Asset Management Plan, Covering Report at p. 5
The TTC’s Planning Page includes reports with statistics for each of the years 2019 through 2023 giving weekday passenger counts, vehicle hours, vehicle mileage and peak vehicles for the fall in each year. Collectively, this information shows the status of ridership and service on the surface network just before the pandemic and through the years following.
Updated April 25, 2024 at 4:10pm: 505 Dundas operated with buses in 2019, and so comparisons to later years’ stats when it was a streetcar show a “recovery” that has more to do with vehicle size and service quality than with an apples-to-apples comparison. This article has been updated in a few places to reflect this. Thanks to a reader for spotting this.
Several points emerge when these data are collected together and compared year-over-year at a route level and for the bus and streetcar networks as a whole.
The TTC talks of service recovery to 95% of prepandemic levels. This is based on the number of vehicle hours operated. This can be misleading for various reasons, notably:
The scheduled speed of many routes is now slower than it was in 2019 due to adjustments both to deal with traffic conditions and to provide more recovery time for operators. Reducing the speed lowers the amount of service provided and so even if vehicle hours are unchanged, there is less service.
Streetcar vehicle hours are higher in 2023 than 2019, but this is due to bus substitution on various routes or route segments. The use of smaller buses pushes up the vehicle hours required to serve the streetcar network.
There has been an ongoing drop in the speed of streetcar routes from 2019 to 2023. This is in part due to replacement of the older CLRVs with the new Flexitys, in part due to schedule changes for congestion and various construction projects, and in part due to more restrictive operating practices that slow streetcar movements at junctions.
Speed of local and express bus operations also fell from 2019 to 2023, although not as much as for streetcars.
The replacement of the SRT by bus routes has added to bus hours and mileage, but to a lesser extent to bus ridership because continuous trips through STC to Kennedy Station count as only one boarding.
The recovery rates for subsets of the network vary, as they do for different metrics.
Metric
Local Bus
Express Bus
Streetcar (*)
Total
Boardings
2019
1,176,496
215,163
318,453
1,710,022
2023
1,016,106
208,537
259,734
1,484,377
% Recovery
86%
97%
82%
87%
Vehicle Hours
2019
19,755
3,310
3,050
26,135
2023
18,717
3,752
3,688
26,157
% Recovery
95%
113%
121%
100%
Vehicle Kilometres
2019
344,832
71,628
41,854
458,314
2023
304,480
74,845
37,211
416,536
% Recovery
88%
104%
89%
91%
Passengers/Hour
2019
59.5
65.0
104.4
65.4
2023
54.3
55.6
70.4
56.7
% Recovery
91%
86%
67%
87%
Kilometres/Hour
2019
17.4
21.6
13.7
17.5
2023
16.3
19.9
10.1
15.9
% Recovery
93%
92%
74%
91%
AM Peak Vehicles
2019
1,264
295
219
1,778
2023
1,098
294
197
1,589
% Recovery
87%
100%
90%
89%
PM Peak Vehicles
2019
1,240
283
214
1,737
2023
1,171
301
206
1,678
% Recovery
94%
106%
96%
97%
(*) The high vehicle hours recovery for streetcars in 2023 is caused by bus substitutions on part or all of 501 Queen, 504 King and 512 St. Clair in fall 2023. More buses are required to provide replacement service, hence more vehicle hours an kilometres. Other “streetcar” values for 2023 are distorted for the same reason. See the sections on specific metrics and route-by-route data for details.
A further complication is that with ridership shifts, total riding on a route might go up, but the distribution of riding through the day and week may have changed. This is not reflected in TTC data which simply gives a daily total figure for each route.
This article consolidates five years’ worth of data for all surface routes in one place for easy reference, and shows that “recovery” is a complex subject where details are hidden by looking at only one metric and at overall averages.
At the end of the article there are linked PDFs containing all of the tables.
City Council reaffirm the policy that maintaining the existing system in a state of good repair is the first priority for investment in transportation.
Despite the State of Good Repair (SOGR) ranking first, some Councillors pursued their subway dreams. Amending motions included the Finch West LRT extension to Pearson Airport, the Bloor subway extension to Sherway, and the Sheppard subway western and eastern extensions. All of these are long-term projects that will have no effect on the transit system for a decade at least.
(Two lines, the Eglinton East and Waterfront East LRTs, were not under discussion as they are already City “priority” projects, although what benefit this status confers remains to be seen.)
The TTC’s Capital Plan includes a very long list of projects for which there is only partial committed funding, or none at all. Meanwhile, the backlog in SOGR work will climb to about $8 billion over the coming decade in spite of $13 billion in spending. In other words, the 10-year budget should be $21 billion, but is actually only 60% of that figure.
Even this pales by comparison with the 15-year total which now stands at almost $48 billion of which only 25% is funded. This number does not include many proposals including the rapid transit projects favoured by Council.
SOGR is seen by some as getting in the way of their preferred system expansion projects, and that a way forward might be paved (so to speak) with a focus on a short list of the most important SOGR items. This is absolute folly, but typical of the priorities that created the problem in the first place.
This misses the key question about our transit system: what do we want it to be? This includes choices not just for capital repairs and/or expansion, but for the overall scope and quality of service transit will provide.
Will the TTC always be a second class service except in a handful of rapid transit corridors, will transit play a much larger role in moving people around the entire city, or will it decline for want of resources to an unattractive last choice for travel? Only after we decide on the goal can we address the question of where to spend, and how much we need.
The 15-year Capital Plan grew substantially from 2023 to 2024 with the principal additions in the bus fleet and a provision for added capacity under the TransformTO Net Zero program. The big jump in bus costs reflects the higher unit cost of battery buses now assumed to be the standard. (Facility Maintenance and Network Wide Assets are new categories in 2024, but they simply replace the “Other” group from previous years with a comparatively small increase.)
Portfolio
2022-2036 ($m)
2023-2037 ($m)
2024-2038 ($m)
Subways
$25,400.0
$25,343.0
$27,613.0
Buses
$6,300.0
$6,948.0
$8,705.2
TransformTO
$5,339.8
Streetcars
$2,230.0
$2,277.0
$2,307.4
Facility Maintenance
$2,415.1
Network Wide Assets
$1,474.8
Other Infrastructure
$3,300.0
$3,478.0
Grand Total
$37,230.0
$38,046.0
$47,855.3
Even the $5.3 billion TransformTO line is an understatement because it accounts only for bus fleet expansion, not for the other modes, and there is no discussion of the related operating cost and competing funding needs.
A quick-and-dirty way to approach the budget is to pick a “top five” project list as if, by implication, all of the rest can wait their turn behind Councillors’ aims for their “deserving” wards. A top five list is a simplistic approach that does not recognize the complexity of TTC’s maintenance needs. Even worse, it implies that if the worst of the backlog is addressed, we can sleep soundly.
I challenge anyone to pick only five lines from the tables below as the subset we could pay for while downplaying the rest.
Another challenge lies in project linkages (you cannot buy more buses without some place to store and maintain them), and in deciding which items should be stripped of priority, in effect relegated to a “bottom five” group. That will be a hard fight.
a. Overview of the TTC, its Governance, Safety and Communications b. Code of Conduct and Municipal Conflict of Interest Act c. Being an Effective Director d. Key TTC Strategies and Plans e. Strategy Training Exercise
Although the agenda page advertises this as a public meeting and invites public deputations, the report states that it will be held in camera as permitted by the City of Toronto Act (S. 190.3.1). The report recommends that the “training materials” be publicly released after the session, although this could be amended. More importantly there will be no public record of the Board’s discussion.
The first three topics should be familiar to most of the Board as they have been in office for some time. Only three Councillor members changed with the arrival of Mayor Chow, and the existing Tory-era Citizen members are still in place except for one who resigned late in 2023. His replacement has not yet been appointed by Council. Training on how the TTC works should be an orientation session for new members, not a topic consuming a full Board meeting that could be spent on overall policy discussion.
Some years ago, the TTC Board attempted to arrange an agenda-free meeting to discuss general policy, but this was hijacked by management with a dog-and-pony show on their own accomplishments and the duties of the Board. This could be a repeat performance.
The time is long overdue for the Board to ask hard questions of management, of each other and of the City about the TTC’s future. We got a sense of what is possible at the recent Audit and Risk Management Committee meeting. Board members Saxe and Osborne grilled management who, frankly, were not fully prepared to answer questions about the Fare Inspection audit report. We have also seen an accumulation of issues regarding infrastructure maintenance and priorities that require informed debate and direction.
Probably the largest overall issue is budget, service and maintenance planning for 2025. In December 2023, the TTC Board wanted to establish a Budget Committee, but this has not yet happened. The motion was couched as a request to staff to report on the idea in Q2 2024 rather than as direction to “do it now”. By the time Q2 ends, it will be too late.
A Budget Committee must exist before the budget is locked down to allow a proper debate about options. For too many years, the budget has landed on the Board’s desk at the last minute with no scope for review of any but the most trivial parts.
As a matter of history, the TTC Budget Committee has not existed since January 10, 2019. Even then it had been moribund since November 2017 thanks to lack of interest by its members, a less than sterling example of good corporate governance.
The fundamental questions are what should the TTC be doing, and what can it do. Starting with the attitude that “we can’t afford it” is an abdication of the Board’s responsibility.
Toronto should know what might be possible and how much this will cost, and only then make decisions about what we choose to afford. The past decade plus of Ford/Tory tax policies precluded this approach, but with a new administration, it is time to seize control of the transit debate.
Here are questions I would ask were I on the TTC Board. This is not an exhaustive list, but then the “education and training” meeting is only scheduled for one day.
On March 31, the TTC will make service changes on several routes. Many of these include small service increases and/or adjusted travel times to reflect conditions on the routes.
Major changes include:
Reconfiguration of routes for construction at:
Lawrence West and Lawrence Stations
Sheppard-Yonge Station
Pape Station
Return of streetcars on 301 Queen Night
Service on 905 Eglinton East Express will change from using articulated to standard buses
Adjustments to travel times on bus routes in the STC corridor
Updated Mar. 20/24 at 11:15 pm: The URL in the link below to the Fare Compliance Strategy has been corrected.
Updated Mar. 21/24 at 2:45 pm: A section about children’s Presto cards has been added at the end of this article.
On March 19, 2024, the TTC’s Audit & Risk Management Committee considered a presentation from their Internal Audit group and management’s response regarding an updated Fare Evasion study conducted from April to October 2023. See:
The fieldwork was conducted on weekdays and weekends between 6:30am and 1:00am with a total of 25,730 observations. The intent was to update findings from the 2018 and 2019 studies to post-pandemic conditions. One addition to the scope was a review of underpayment of cash fares. Two items remained outside of the scope: illegal entry to stations via bus loops, and fare evasion on Wheel-Trans and night services.
The Committee is small with only three members, of whom only its chair, Councillor Dianne Saxe and citizen board member Julie Osborne were present. They both had time to ask many questions, and it was clear that the report’s findings took them very much by surprise.
The headline number is an estimate that fare evasion costs the TTC $123.8 million annually, and that 11.9% of riders (on a weighted basis across the three modes) do not pay. This is about double the rate found in 2019. A further $17.1 million is lost to underpaid cash fares.
Lurking behind this entire discussion is the question of Special Constables and Fare Inspectors. The higher the purported loss, the greater the political pressure to regain the missing revenue through enforcement. I will not impute a motive behind the audit study, but observe that finding $140.9 million “under the cushions” every year will get Council’s attention. Whether enhanced enforcement will lead to productive staffing decisions and a real increase in revenue is quite another matter.
Updated March 14, 2024: The table listing subway restricted speed zones has been updated by addition of the TTC’s March 12 and 14 lists.
Updated March 22, 2024: The table of restricted speed zones has been updated with the TTC’s March 21 list.
In July 2023, the Scarborough RT met its unexpected end with a derailment south of Ellesmere Station. The underlying cause was a loose segment of reaction rail struck by the train. The last car separated from the train and the rear truck lifted completely off of the tracks. A major issue raised by the investigation was poor track inspection and maintenance procedures, possibly influenced by a combination of badly trained junior staff and the assumption that the line would close soon and did not require much ongoing work.
Fortunately, the location was an at-grade segment where there was little danger of the car falling far. Had the accident happened on the elevated stretch from Midland to McCowan, this could have been a very different story.
For a detailed look at this accident and the investigation, see:
The SRT would never re-open. Subsequent inspections found other problem locations including some with similar faults to the one causing the derailment.
This might be regarded as poor management choices and bad luck for a line that would soon close, but only half a year later, the subway was beset with widespread slow orders that hampered service. These arose from an annual track geometry inspection performed by a contracted service using a test rig that is run through the entire subway system. The equipment looks for problems a visual inspection will not spot including rails out of gauge and potential failures due to metal defects and fatigue.
At the January 2024 TTC Board meeting, management claimed that this was a normal outcome of the annual inspection. However, a month later in February, management admitted that the number of defects was higher than usual. Unfortunately, for unknown technical reasons, the video record of the February meeting is not available on YouTube to provide an exact quote.
An obvious, but unasked question is why there was such a jump in defects. Have past inspections missed problems or been too infrequent? Have their findings been ignored? Have repairs been less than adequate?
Quite recently, on March 1, 2024, a broken switch blade was discovered north of Museum Station. This defect was so serious it required service to be suspended from early morning until mid-afternoon when repairs were complete.
Riders on the streetcar system know that there are slow orders everywhere. Any junction slows streetcars to a crawl, and any facing point switch has a mandatory stop-and-proceed so that the operator can verify the switch is correctly set. There is even a rule, not much observed except by junior operators, that streetcars should not pass at junctions lest one of them derail and strike the other. (This rule originated from just such a sideswipe collision several years ago.)
The attitude that poor track condition can be dealt with simply by going slow spread from the streetcar system outward, and now affects the key routes of the TTC’s network.
Somebody made decisions over the years that led to declining maintenance on the rail systems. This was never presented to the TTC Board or Council explicitly, but was the inevitable effect of making do year-by-year with cuts to the Operating and Capital budgets. Three decades ago during a recession and funding cuts, TTC management claimed that they could get by without compromising the system. The parallels are far too clear, and that era’s result was the Russell Hill subway crash.
The term “State of Good Repair” (aka “SOGR”) comes up a lot in TTC budgets as a key component – maintain what we already have, ensure that the system continues to provide safe, reliable service and only then worry about spending on shiny new projects.
A report making its way to Council’s March 20 meeting includes a rough prioritization list of many rapid transit proposals, but the first priority above all is to invest in SOGR. However, the backlog on that account is so big that were this priority taken seriously, Toronto would never have another penny to spend on anything else.
One problem in discussing SOGR is that there is much emphasis on the Capital Budget with big ticket projects like new subway cars and buses, automatic train control, electrification, and replacement of major items such as track, escalators and elevator. We rarely hear about the SOGR buried in the Operating Budget and the day-to-day work of keeping the system in good condition.
An important difference is that the Operating Budget is funded by fares and City subsidies, while the Capital Budget comes from taxes and borrowing at all levels of government. As an example, the cries for Line 2 subway car funding are familiar in recent years. This diverts attention from much-needed ongoing repairs, a very unglamourous part of transit operations.
Spending on operations means money goes out the door today, not in future years for a project that might only now be a line on a map. That money comes from current revenue, not from borrowing, and directly affects taxes and fares depending on which pocket we reach into. There is a lot of competition for whatever spare change we might find.
Any decision to limit tax increases for transit or to freeze fares has a direct effect on how much service the TTC can operate and how well it can maintain the system. Under the Ford and Tory administrations and their low tax policies, there was very strong political pressure to say “we can make do” with no detailed examination of the effects.
This might change under Mayor Chow, but there is no indication that the current TTC budget philosophy has shifted. Indeed, the big push is to restore service and freeze fares. Raising uncomfortable questions about maintenance shortfalls will not serve that agenda.
In this article, I will review the issues with subway and streetcar infrastructure, and then turn to the wider problem of whether “State of Good Repair” can stay as the City’s “priority 1” in the face of typical Council politics. The focus here is on track because that links many current events on the three rail networks, but the concern should be general for the adequacy of TTC maintenance and budgetary limits that are now baked in to overall system quality.
Introduction: Regular readers of this site will recognize threads and arguments from past articles here. Indeed some recent posts were intended as background to this overall article on our city’s transit direction. There is a new Mayor with Council support for change. However, we risk that momentum will be lost and content ourselves with “full service restoration” and a handful of RapidTO projects.
This is not exactly a manifesto, but we have been here before with hopes for new and improved transit seeking progress beyond “business as usual”. Will this round be any different?
Thanks to readers for tweaks in the text. This is a long article, and I have broken it into segments with hotlinks here so that you can jump to specific chapters.
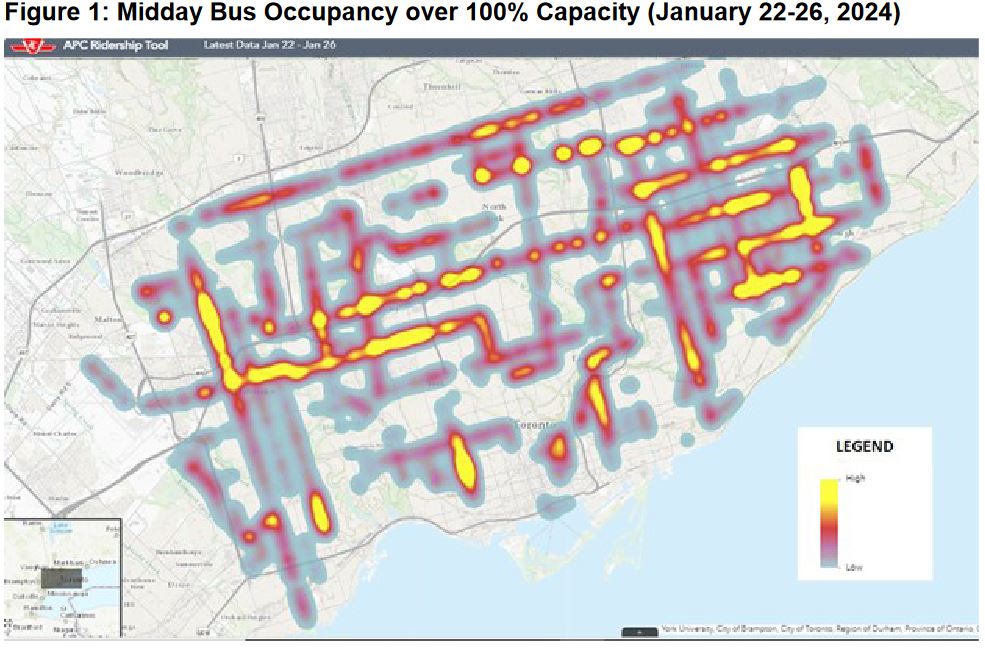
An ongoing issue with TTC service levels is that TTC claims about crowding do not always appear to align with rider experiences.
The TTC Board’s February 22 agenda includes a report about proposed free transit for Middle and Secondary School students, particularly for group field trips.
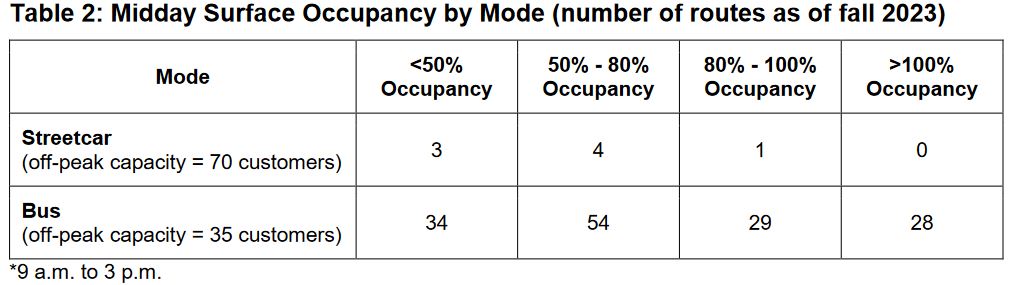
Among the issues raised by the report is the ability of the transit system to handle the additional loads, and the need to co-ordinate planned outings with the TTC for provision of extra service. There is a map showing existing “hot spots” where mid-day routes are over capacity.
Many bus routes have this problem, but none of the streetcar routes.
A related issue is the degree to which crowding varies by day-of-week and the danger that Monday-Friday averages could mask problems with midweek demand levels.
Of particular note here is that the off-peak capacity shown is 35 per bus, not the higher value introduced with the 2023 budget that is close to a standing load. The heat map shows us where current operations exceed the 2023 standard, i.e. those over 100% occupancy vs a bus capacity of 35. Note that these are six-hour averages and individual bus loads will vary.
This also shows the scale of service changes required to reinstate the pre-2023 standard.
Here are the official Service Standard crowding levels and those implemented in the 2023 Operating Budget. The TTC Board has never formally change the Service Standards, and management plans to work back to the existing standards from the 2023 levels as part of future service and budget planning.
Service Standards Peak
2023 Peak
Service Standards Off-Peak
2023 Off-Peak
Bus
50
50
35
45
Streetcar
130
130
70
90
The TTC produces a lot of charts in their monthly CEO’s report, but crowding maps like this one showing actual conditions only appear to support analyses of specific issues. They should be a standard part of the CEO’s Report so that there is an up-to-date indication of service capacity versus demand for all time periods.