
The TTC’s Planning Page includes reports with statistics for each of the years 2019 through 2023 giving weekday passenger counts, vehicle hours, vehicle mileage and peak vehicles for the fall in each year. Collectively, this information shows the status of ridership and service on the surface network just before the pandemic and through the years following.
Updated April 25, 2024 at 4:10pm: 505 Dundas operated with buses in 2019, and so comparisons to later years’ stats when it was a streetcar show a “recovery” that has more to do with vehicle size and service quality than with an apples-to-apples comparison. This article has been updated in a few places to reflect this. Thanks to a reader for spotting this.
Several points emerge when these data are collected together and compared year-over-year at a route level and for the bus and streetcar networks as a whole.
- The TTC talks of service recovery to 95% of prepandemic levels. This is based on the number of vehicle hours operated. This can be misleading for various reasons, notably:
- The scheduled speed of many routes is now slower than it was in 2019 due to adjustments both to deal with traffic conditions and to provide more recovery time for operators. Reducing the speed lowers the amount of service provided and so even if vehicle hours are unchanged, there is less service.
- Streetcar vehicle hours are higher in 2023 than 2019, but this is due to bus substitution on various routes or route segments. The use of smaller buses pushes up the vehicle hours required to serve the streetcar network.
- There has been an ongoing drop in the speed of streetcar routes from 2019 to 2023. This is in part due to replacement of the older CLRVs with the new Flexitys, in part due to schedule changes for congestion and various construction projects, and in part due to more restrictive operating practices that slow streetcar movements at junctions.
- Speed of local and express bus operations also fell from 2019 to 2023, although not as much as for streetcars.
- The replacement of the SRT by bus routes has added to bus hours and mileage, but to a lesser extent to bus ridership because continuous trips through STC to Kennedy Station count as only one boarding.
The recovery rates for subsets of the network vary, as they do for different metrics.
| Metric | Local Bus | Express Bus | Streetcar (*) | Total |
|---|---|---|---|---|
| Boardings | ||||
| 2019 | 1,176,496 | 215,163 | 318,453 | 1,710,022 |
| 2023 | 1,016,106 | 208,537 | 259,734 | 1,484,377 |
| % Recovery | 86% | 97% | 82% | 87% |
| Vehicle Hours | ||||
| 2019 | 19,755 | 3,310 | 3,050 | 26,135 |
| 2023 | 18,717 | 3,752 | 3,688 | 26,157 |
| % Recovery | 95% | 113% | 121% | 100% |
| Vehicle Kilometres | ||||
| 2019 | 344,832 | 71,628 | 41,854 | 458,314 |
| 2023 | 304,480 | 74,845 | 37,211 | 416,536 |
| % Recovery | 88% | 104% | 89% | 91% |
| Passengers/Hour | ||||
| 2019 | 59.5 | 65.0 | 104.4 | 65.4 |
| 2023 | 54.3 | 55.6 | 70.4 | 56.7 |
| % Recovery | 91% | 86% | 67% | 87% |
| Kilometres/Hour | ||||
| 2019 | 17.4 | 21.6 | 13.7 | 17.5 |
| 2023 | 16.3 | 19.9 | 10.1 | 15.9 |
| % Recovery | 93% | 92% | 74% | 91% |
| AM Peak Vehicles | ||||
| 2019 | 1,264 | 295 | 219 | 1,778 |
| 2023 | 1,098 | 294 | 197 | 1,589 |
| % Recovery | 87% | 100% | 90% | 89% |
| PM Peak Vehicles | ||||
| 2019 | 1,240 | 283 | 214 | 1,737 |
| 2023 | 1,171 | 301 | 206 | 1,678 |
| % Recovery | 94% | 106% | 96% | 97% |
A further complication is that with ridership shifts, total riding on a route might go up, but the distribution of riding through the day and week may have changed. This is not reflected in TTC data which simply gives a daily total figure for each route.
This article consolidates five years’ worth of data for all surface routes in one place for easy reference, and shows that “recovery” is a complex subject where details are hidden by looking at only one metric and at overall averages.
At the end of the article there are linked PDFs containing all of the tables.
Riding Counts
The TTC reports route-level riding by “boardings” where one rider getting on a bus or streetcar counts as one boarding. Trips that use multiple routes count as separate boardings for each leg of the journey. The one exception is the subway where a trip on two or more routes counts as one boarding.
On buses and on much of the streetcar fleet, counts come from Automatic Passenger Counters that use infrared beams at doorways to count people getting on and off. There is some question about the accuracy of these counts when vehicles and doorways are crowded, but this has not been systematically reviewed at least for public consumption.
Presto taps are another source of data, but they are subject to both legitimate (free transfer areas) and illegitimate (fare evasion) boardings where a rider does not tap.
The table below shows the boarding counts for all routes in 2019 through 2023. (Click on any image to open in a galley.) Also shown are the recovery rates relative to 2019 and, at the end, a summary of values for major groups of routes (local bus, express bus, streetcar).
Items of note:
- Recovery rates vary substantially from route to route. When speaking of ridership recovery, the average level hides this variation.
- Some of the very large increases come on routes like 8 Broadview, 65 Parliament and 996 Wilson Express that gained new riders from route extensions.
- 960 Steeles West Express gained much additional ridership (525%) because of trip reassignment between local and express service. The 60 local service had much lower recovery (44%) because many passengers were diverted onto the express service.
- Similarly, 929 Dufferin Express and 29 Dufferin has recoveries of 123% and 83% respectively because of riding shifting to the express service. It is important to consider corridors, not just individual routes on them, when making comparisons.
- Rote 903 Kennedy-STC Express existed in 2019, but not in the same form as in 2023 as part of the SRT replacement service. The percentage “recovery” values for the 903 are very high because there is so much more service now.
- 501 Queen did not fare well for ridership in 2023, although this is the combined effect of many factors:
- Ontario Line and other construction causing route splits and diversions.
- Splitting of 507 Long Branch off as a separate route. Local trips on that route no longer count toward the 501 total. (Passengers transferring between 501 and 507 cars at Humber now count as two boardings rather than one.)
- All day operation of 503 Kingston Road shifted some Queen East riding onto that route that formerly would have counted to the 501 Queen total.
- The premise that decline in downtown commuters affects streetcar routes is not uniformly reflected in the counts:
- Although 504 King and 506 Carlton were still well below 2019 levels in 2023 at 60% and 69% respectively, the 505 Dundas car has surpassed its former demand and sits at 108%.
- 509 Harbourfront, 510 Spadina and 511 Bathurst are all above their 2019 levels.
- 512 St. Clair shows the effect of bus substitution with a drop in ridership. It had already exceeded the 2019 level in 2022.
- Although 504 King and 506 Carlton were still well below 2019 levels in 2023 at 60% and 69% respectively, the 505 Dundas car has surpassed its former demand and sits at 108%.
- Errata:
- There is no 2019 passenger count for 112 West Mall in the TTC data, and so comparisons to this figure are impossible.


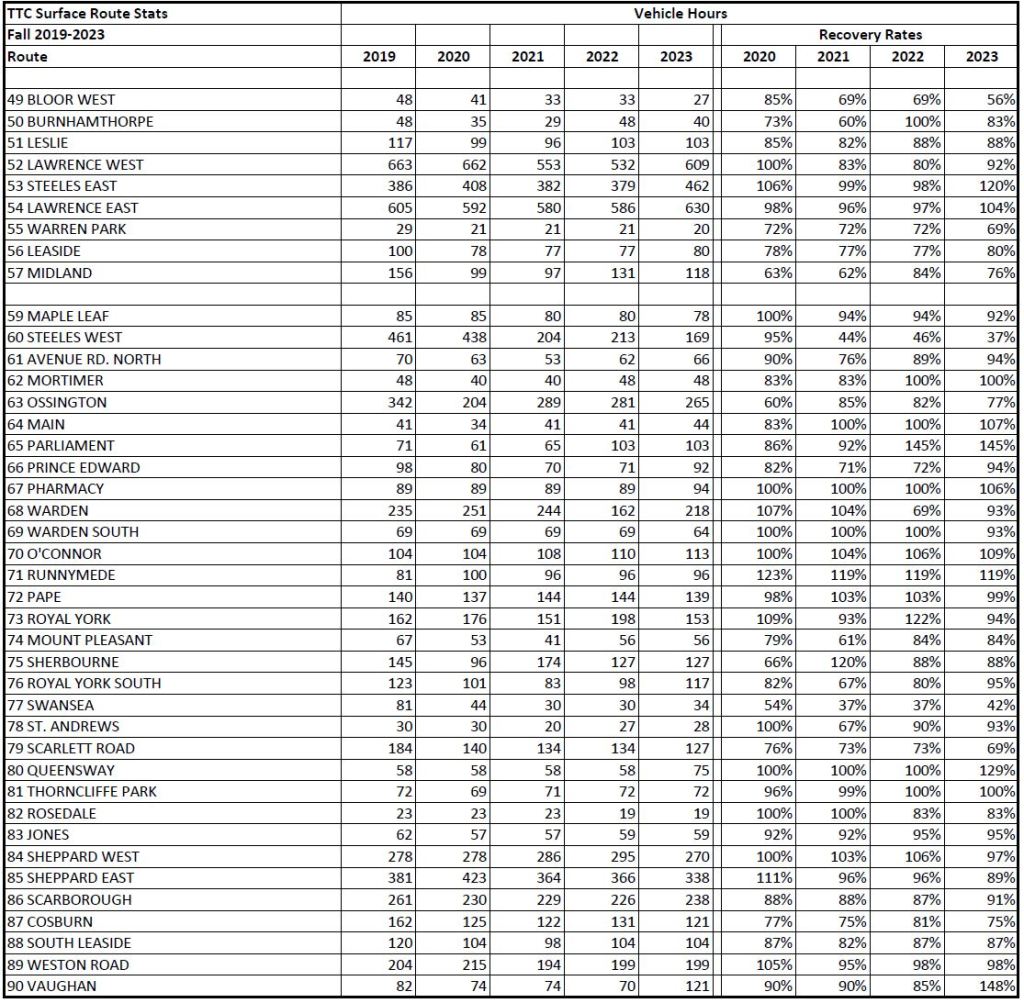
Vehicle Hours
Vehicle Hours is the metric the TTC cites when speaking of service restoration. However, this is only directly comparable if the vehicle speed also stays the same.
For example, ten buses operating on a route with a one hour round trip provide a six minute service. If the more travel time is added to the route, the number of vehicle hours stays the same, but the buses come less frequently. If the route gets 70 minutes for a round trip, the buses arrive every seven minutes. It does not matter whether the time was added for slower driving conditions, or to provide more recovery time at terminals. The metric of hours operated stays the same, but buses come less often.
Vehicle speeds are compared in a later table in the article.
Overall, surface routes were operating almost the same number of vehicle hours in late 2023 as in 2019 with buses at 97% and streetcar routes at 121% because of bus substitutions that required more vehicles.
Some routes have substantial increases compared to 2019 thanks to extensions, route restructuring and/or rising demand. For example, with the SRT shutdown, several routes were extended from Scarborough Town Centre to Kennedy Station. Ridership, hours and mileage that used to belong to the SRT now shows up across several surface routes.
There are still a few operating well below their 2019 level including: 14 Glencairn, 19 Bay, 49 Bloor West, 77 Swansea. 60 Steeles West dropped a lot because more of the service now operates as 960 Steeles West Express.
Any route-level comparison must take into account network changes over the period, especially for values that are outliers.
Streetcar hours and mileage are not always directly comparable from 2019 to 2023 because the transition to larger Flexity cars was still underway. Also, 505 Dundas operates considerably less service by these metrics in 2023 than 2019 when it still ran with buses, not streetcars. Even so, ridership on this route is up over the 2019 level.
Updated April 25, 2024: It is possible that the 505 Dundas ridership in 2019 was depressed by the service effects of bus replacement on the route, and so recovery in later years is against a base that is lower than might otherwise have been the case.
Routes affected by this change are generally those with a drop in vehicle mileage in 2020. Those with little change had already been converted by 2019.
Bus substitutions for streetcars can throw off the stats because smaller vehicles drive up vehicle hours and mileage. Ridership can be affected because of a decline in service quality with replacement service. See 505 Dundas in 2019; 511 Bathurst in 2020; 512 St. Clair and 501 Queen in 2023 versus previous years.


Vehicle Kilometres
Although the total of surface vehicle hours is back at 100% in 2023, the vehicle mileage is at 90% due to an overall slowdown in transit speed. Again, note that bus substitutions on streetcar routes drive up numbers but do not necessarily indicate better service.


Passengers per Vehicle Hour
The numbers in this table are calculated by dividing the vehicle hours operated (including terminal recovery time) into the number of boardings. Where the type of vehicle is consistent across five years, these values are directly comparable. However, changes in vehicle size and type cause swings in values that must be recognized on a route-by-route basis. The effect is stronger for the streetcar network because such changes affect proportionately more of the routes than on the bus network.


KM per Vehicle Hour
The numbers in this table are the calculated distance travelled per hour from the two tables above. Note that this is not the same as the scheduled speed of the route because terminal layover/recovery time are included in the calculation. Over past years schedules have been adjusted both to provide more travel time between terminals and to provide more recovery time at terminals. Both of these contribute to slower KM/Hour values, and to reduce the amount of service provided by each vehicle hour operated.
To put it another way, although the vehicle hours provided by the TTC might be back close to 100% of 2019 levels, the amount of service is less because most routes are slower in 2023 than they were in 2019.


Peak Vehicles
The tables below give the peak vehicle counts for the AM and PM peaks. The total number of vehicles operated in peak periods remains below 2019 levels.
As noted in other sections, the change in vehicle size on some streetcar routes reduced the number of vehicles operated on them. In the case of CLRV to Flexity conversions, fewer vehicles were needed. In the case of streetcar to bus replacements, more were needed if only temporarily. Similarly, on routes that change between standard and articulated buses, the vehicle count, hours and mileage will change.
Errata:
- 189 Stockyards shows a very high number of peak buses in 2020. This is not correct, but the values here are those in the TTC data.


PDFs of Tables
The PDFs linked below contain the pages from this article in two separate orders. The first, “by metric”, is the sequence in the article where all stats of one type such as ridership are grouped together. The second, “by route”, has all of the metrics for each group of routes together so that a reader can scroll between them on successive pages.

Steve, according to the stats, everything is just fine, 91% to 100%!!
Why is the experience so very different?!! Or maybe I just live in a bad part of town. But perhaps everyone says that? Doesn’t seem to matter if we’re talking TTC or private vehicles. Last year we were #3 – before they reduced the Gardiner. What are we for public transportation? I know they say in Europe you can set your clock by the train schedule. In Toronto, I heard it takes an hour to get from Toronto to Toronto!! Why do I live that quote?!!
LikeLiked by 1 person
Never understand why the TTC uses 12 metre buses when they replace streetcars with buses. Shouldn’t they be using the 18 metre buses in place of the streetcars.
Ditto when shuttle buses are used when the subway is down. They should be using 18 metre buses, if not even longer buses.
Steve: Most of the 18m fleet is spoken for on other routes at least on weekdays. Using them for streetcar lines would require conversion of their “home” routes to 12m buses. There would also be problems at streetcar stops where it is already difficult for 12m buses to align with the curb properly, and 18m buses would be even worse.
I get to see subway shuttles often near Broadview Station, and many of those buses are artics.
LikeLike
What happened to stockyards in 2020, why it needed 25 buses during peak hours?
Steve: That is quite obviously an error in the TTC’s data. The route had 2 buses on it, tops. I will add a note to the main article flagging this problem.
LikeLike
I would figure that Stockyards used 2.5 buses at that point.
LikeLiked by 1 person
Hi Steve,
Do you know when TTC will issue planned service changes?
Steve: Effective when? Normally the schedule changes come out between 1 and 2 weeks before implementation. The next change is in mid-May, and so I would expect to see the details early in the month.
LikeLike
Are you sure Dundas had CLRVs in 2019? I used that route frequently in 2018-2020 and remember a lot of bus substitutions, but I have no memory of getting on a CLRV. In fact, I can’t say for sure that I rode an LFLRV on Dundas in that time. Queen on the other hand definitely had the CLRVs.
Steve: I stand corrected! Yes, 505 Dundas had buses in 2019 and so the change in vehicles, hours and mileage to later years is the result of bus-to-Flexity conversion, not CLRV-to-Flexity, at the end of March 2020. I will update the article. Thanks for catching that!
LikeLike
Whenever there is a subway or streetcar route shutdown (like that fire on Line 2 near Islington Station), we can expect many deterioration of bus services to provide the needed shuttle buses.
Other cities have alternate rapid transit routes available near the shutdown location, putting additional trains/personnel on those routes. Toronto has few rapid transit routes to provide alternate routes. Waiting still for Line 5 (and Line 6) and the Ontario Line to provide that alternate routing.
LikeLike