Council Approves Tory Transit Plan, Attempts Pet Project Revivals

Toronto Council has approved the transit plan for Toronto featuring Mayor John Tory’s SmartTrack line and the Scarborough Subway after a long debate on July 14, 2016. Notwithstanding severe problems with financial pressures and the blind faith needed to expect that the entire package can actually be funded, Council added a few pet projects that never quite fade from view thanks to the efforts of individual members.

LRT proposals for Eglinton East and West survived the vote largely because they are part of larger packages – SmartTrack in the west, and the Scarborough Subway Extension in the east. The subway debate has so polarized camps that “LRT” is synonymous with third class transit simply because it was the heart of the “non subway” option. Without the bitterness of the SSE that required subway advocates to paint LRT in the worst possible light, its potential role in Toronto’s future network might not have been so poisoned while other cities embrace this mode.

Staff recommendations in the report were amended in some respects, and a few new clauses were added, notably one asking for City staff to pursue a co-fare arrangement with GO Transit.

The Waterfront Transit Reset report is a separate agenda item and, at the time of writing, Council has not yet dealt with it.

The Finch West and Eglinton Crosstown LRT projects are under Metrolinx, and they are already underway to varying degrees.

Continue reading

Brimley: The Station That Never Was

In all the discussion about options for service to the Scarborough Town Centre, an important factor is the superiority of an east-west alignment through the area (which is itself an east-west rectangle). One subway station serves a node in the middle of the STC precinct, but an east-west line, especially with a technology where multiple stations are comparatively inexpensive, can do a better job of serving a future, developed town centre.

City Planning’s own reports say as much, but because discussion of the LRT option has been expunged from debates, we don’t hear how this might perform.

As a matter of historical interest, the original LRT proposal that predated the Scarborough RT by a decade included not only the three stations we have today – Midland, STC and McCowan – but also made provision for a future station at Brimley. The site would have been just east of the Bick’s pickle vats, for those who knew the area back when, on the west side of Brimley.

Some years later with the RT well established, local Councillors pressed for a Brimley Station. Council funded this and the TTC in due course produced a design. That’s as far as things ever got, and despite development near the station site, nothing more has ever come of the idea.

Brimley SRT Station Feasibility Study, January 2004:

Given its very light usage and difficulty of access, one might even argue that Ellesmere Station could be replaced by one at Brimley in any new design.

We will never know, because “LRT” in at least this corridor is a naughty word.

The Dwindling Capacity of the Yonge Subway

Yesterday’s launch by York Region of their Yonge Subway Now website brought to the fore the question of just how much room remains on the Yonge Subway for additional riders. Over many years, claims about capabilities of new subway technologies together with changing projections for future demand have left Toronto in a position where its subway is badly overloaded with little relief in sight.

This article traces the evolution of those claims and the reality of what can actually be provided to show that building a Relief Line is not a project for a future decade but one that must begin now.

Continue reading

York Region Wants a Subway, Overstates Available Capacity (Updated)

Updated July 6, 2016 at 5:10 pm: “Yonge Subway Now” has updated their website to remove the double counting of capacity improvements, and to clarify that their claims about subway capacity apply to the peak point south of Bloor Station. The revised text is included in the main article.

Although in theory there will remain 4% of free capacity on Yonge south of Bloor in 2031, this is hardly the sort of margin we should be planning for. The Relief Line’s demand projections show that it has a major effect if it runs north to Sheppard, and it will have to be in place sooner rather than later to avoid deadlock on the Yonge line.

A related problem is the question of station capacity to handle passengers with trains arriving about 30% more frequently than they do today.

York Region has wanted a subway to Richmond Hill for years, and there is even a completed Environmental Assessment and its Addendum for this project.

Today, July 5, 2016, a new website extolling the virtues of this project went live. It contains the usual things one would expect about the growing need for transportation and how a subway will improve the region’s future. Unfortunately, it also contains a misrepresentation of available and future subway capacity.

But what about overcrowding you say?

  • Metrolinx’s Yonge Relief Network Study analyzed options for crowding relief to the existing Yonge Subway line by examining new local and regional travel opportunities and improving mobility across the GTHA. Key findings include:
    • Significant relief to the Yonge Subway line will be achieved through already committed transit improvements, including:
      • TTC’s automatic train controls [adds 29% capacity];
      • New subway signals [adds 10% capacity];
      • New six-car subway trains [adds 10% capacity];
      • Toronto-York Spadina Subway Extension [adds 5% capacity]; and
      • Regional Express Rail/SmartTrack/DRL will add even more capacity.
    • With the above capacity improvements in place the Yonge Subway line will be running under capacity when it opens and beyond 2031.
    • The Yonge North Subway Extension only adds 9% demand at peak period.

Updated July 7: The text above was the original version. The page now reads:

But what about overcrowding you say?

  • Metrolinx’s Yonge Relief Network Study analyzed options for crowding relief to the existing Yonge Subway line by examining new local and regional travel opportunities and improving mobility across the GTHA. Key findings include:
    • Significant relief to the Yonge Subway line will be achieved through already committed transit improvements, including:
      • TTC’s automatic train controls [adds 29% capacity];
      • Toronto-York Spadina Subway Extension [diverts 1,300 riders to free up 5% capacity]; and
      • Regional Express Rail diverts 4,200 riders to free up 15% capacity.
    • With the above transit improvements in place the Yonge Subway line will be running under capacity when the extension opens in 2031.
    • The Yonge North Subway Extension has a projected ridership of 14,000 to 22,000, but is only expected to add 2,400 demand during the AM peak hour, at the peak point south of Bloor.

Let’s start off with the increased capacity for the Yonge Subway. The Metrolinx report cited here says (p 15) that the existing capacity is 28,000 passengers per hour per direction, and that by 2021 this will rise to 36,000.  That’s roughly a 29% increase, and is possible because of the new signal system which includes automatic train control. This will allow trains to run closer together, roughly every 110 seconds in place of the current 140 seconds.

Capacity of the new subway cars is already included in the 28k value as these trains have been exclusively providing service on the Yonge line for a few years. They no longer represent a marginal improvement that is still available. The design load for service planning (average loads over an hour, not peak loads on a train or car) for the new trains is 1,100 passengers. If trains run every 140 seconds, that is equivalent to 25.7 per hour or a capacity of about 28k/hour. Moving to a 110 second headway gives 32.7 trains/hour or a capacity of 36k/hour.

Traffic diverted to the TYSSE (Toronto York Spadina Subway Extension) at 5% of current capacity represents 1,400 per hour. This is in line with the value shown in the Metrolinx study (see chart below).

GO/RER has only a modest effect on the Yonge corridor because the Richmond Hill line is not part of the RER network, and other routes paralleling Yonge (the Barrie and Stouffville corridors) are too far away to have a meaningful impact. There is also the issue of the fare differential between GO/RER and the TTC which could discourage some riders from travelling on GO.

SmartTrack was originally claimed to be capable of subway-like service down to a 5 minute headway (12 trains/hour) that would serve Unionville and Milliken stations. However, we now know that “SmartTrack” will really be just a few more GO trains (part of the already planned RER improvement) stopping at a few more stations within Toronto, not the “subway like” operation some in York Region might have expected.

The Metrolinx study includes a chart showing the interaction of demand and capacity changes to 2031.

YongeNorthDemandProjection

The current 2015 demand is shown as higher than the actual capacity (31.2k vs 28.0k) based on the level of overcrowding now experienced on the line. The light blue dotted line shows the capacity before the new signal system is activated, and the solid blue line shows the added capacity. Even this will not be sufficient to handle the projected growth to 2031 absent other changes.

The TYSSE and other changes  are expected to shift 1,300 per hour from the Yonge line, and a further 4,200 would be attracted by GO/RER. This mostly, but not completely, offsets the anticipated growth so that by 2031 the “base case” demand is 32.3k, slightly higher than the demand today, but in less crowded conditions thanks to more trains/hour.

The Yonge North extension adds only 2,400 peak hour passengers and brings the line up to 96% capacity. Note that this is the peak hour average, and there will be some overcrowding due to variations over the hour.

This leaves no room for growth, but it also shows the paltry additional demand expected on a very expensive subway extension. Indeed, this makes the Scarborough extension to STC positively shine by comparison with 7,300 peak hour riders. The projected demand on the Richmond Hill line appears to be lower than the existing ridership of the SRT!

But things are really not that bad.

Those 2,400 are net new riders attracted by the subway in place of existing bus service. Total ridership will be a combination of then-current bus passengers feeding into Finch Station plus the 2,400 new riders.

Metrolinx shows that the “long” version of the Relief Line to Sheppard produces a sizeable reduction in projected demand on both the Yonge line and for the Bloor-Yonge transfer movements.

YongeReliefDemandEffects

If Metrolinx, Toronto and York Region are really serious about providing capacity for future extension and ridership growth on the Yonge Subway, then construction of a Relief Line is absolutely essential despite its cost.

Meanwhile, York Region should update its website to provide accurate claims about future changes to subway capacity. Blatant inaccuracy such as we see here are the marks of hucksterism designed to sell a project, not a professional representation of what is actually needed.

Update: The new version of the website addresses these issues, but I must wonder why the incorrect information appeared there in the first place.

Reviving the Scarborough LRT Proposal (Updated)

Updated July 5, 2016 at 8:00 am: Revised drawings for Kennedy Station have been added showing better detail of the the LRT lines and a temporary bus terminal. Minor textual changes have been made in the article including an observation that the scope of replacement costs for removing the existing SRT structures will vary depending on the timing of shutdown and the degree to which existing structures are adapted/recycled.

Updated at 8:45 am: The potential sources of cost overstatement for the updated LRT option have been summarized.

With the recently announced increase in the projected cost of the Scarborough Subway Extension, the question of reverting to the original LRT plan for Scarborough has surfaced again. It is no secret that I favour this plan, but the political environment has been so poisoned that discussion of the options is, mildly speaking, difficult. When the Mayor feels that he must imply racism in critics who are simply trying to advocate for their view of a better transit system, Toronto politics are at a new low. However, the implications of the LRT plan must be addressed on their merits, not on simplistic political comments unworthy of the Mayor’s office.

On June 29, the TTC issued a briefing note regarding the cost of the LRT option in the context of current events. The question here is whether the claims and assumptions behind this note are legitimate and represent what could be achieved with a “best effort”, as opposed to presenting a less attractive picture to give the impression that the LRT represents an unacceptable downside.

Continue reading

Property Taxes and Subway Financing

The financing of a new rapid transit project in Toronto is a complex business, and probably the most complex part of the whole thing is the effect this has on property taxes.

This article is intended as an introduction to how these taxes actually work. It is not an exhaustive review, and there are subtleties beyond my scope here.

This is an article for people who like the gory details, and so I will insert the break right here.

Continue reading

Smart Track Fantasy: Tax Increment Financing

Back when SmartTrack was first announced as the centrepiece of John Tory’s mayoral campaign, the most obvious question was “how will you pay for this”. At the time, “this” consisted of very frequent service running over existing GO transit trackage plus a heavy rail extension to the Airport Corporate Centre, and it had a nominal price tag of $8 billion. On the presumption that each level of government, so overwhelmed by the obvious necessity of SmartTrack, would pony up 1/3 of the cost, the campaign then turned to the issue of how the City of Toronto’s share, $2.6b, might be financed.

Enter the tax wizards of Tax Increment Financing (TIF), a financial scheme not unrelated to pulling rabbits out of hats or making the attractive assistant float in mid-air with no visible means of support.

The premise of TIF is simple: If there is a piece of land that, but for public investment, would sit empty for all eternity, then any taxes that might arise from induced development there are “found money”. In other words, if we take a swamp, drain it, clean up the pollution, build roads and utilities and install a transit corridor, all with public money, then the development that follows can be used to finance the investment through its future property taxes.

It’s rather like investing in a pair of glass slippers and then charging Cinderella for wearing them. She’s going to marry into money, and her family can afford to pay you back.

Continue reading

UPX Ridership Update (Updated)

Note: The figures showing revenues and costs for UPX have been corrected as of 12:35 pm, June 30.

A section on future ridership requirements vs operating costs has been added.

Updated 5:30 pm June 30, 2016: Due to conflicting information in the Metrolinx Annual Report, it is possible that the level of subsidy per rider has been overstated in the original article. Pending clarification from Metrolinx, I have added a separate version of the calculation taking into account both sets of figures.

Also, the three days in February 2016 cited originally as “missing” were actually free days and these were not included in Metrolinx counts to avoid skewing the averages. Similarly, reporting “zero” for these days would skew the averages. Therefore, the approach taken below of using the previous week’s data, during a period of little change in ridership, allows the moving average and overall trend to more accurately reflect what would have happened in the absence of the promotional weekend.

Updated 5:45 pm June 30, 2016: Metrolinx has confirmed that there is an error in their Annual Report.

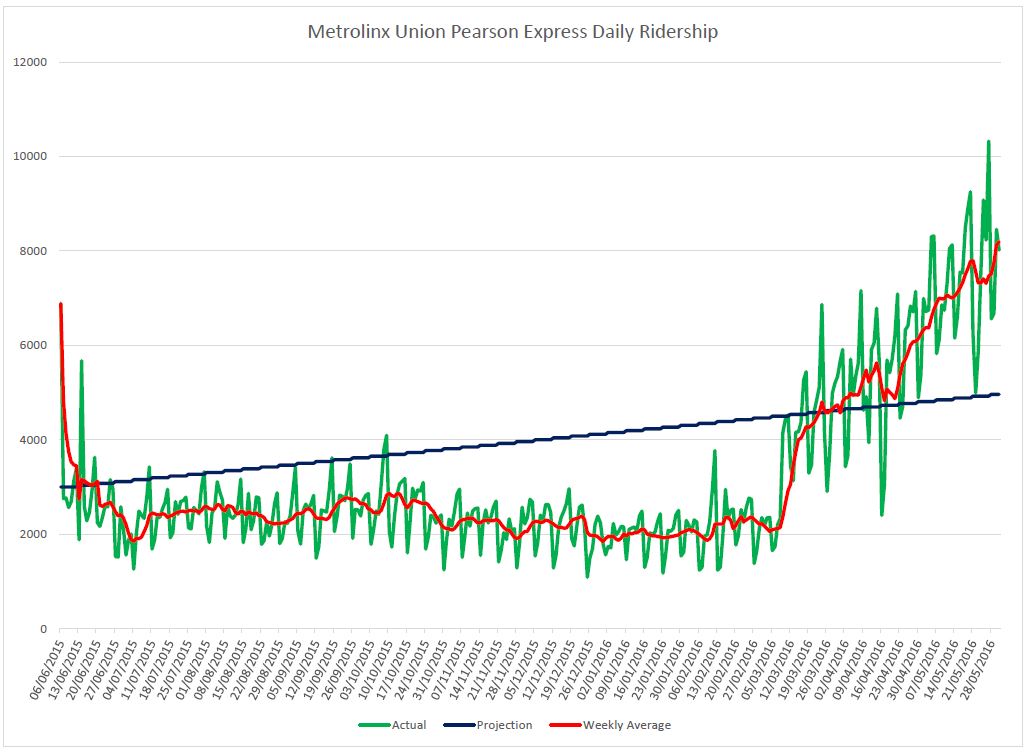
Metrolinx has published the ridership for the Union Pearson Express up to the end of May, 2016. The daily counts rose dramatically once fares were reduced on March 9, 2016, and the values are running well above the original projections after a long period of poor performance.

Exact origin-destination counts are not available, but Metrolinx reports that about 80% of travel is to and from the airport while the remainder are trips between other stations on the line.

UPX_Ridership_20160531

Note: In the source data, values are zero for February 13-15, 2016 as this was a free weekend for promotional purposes. The values from February 6-8 have been substituted for continuity.

Total ridership to March 31, 2016 (the end of the fiscal year) was 751,500.

The revenue situation for operations up to March 31, 2016 is revealed in the annual report. Budgeted revenue for UPX was considerably higher than actual.

Source          Actual         Per Rider     Budget
 
Fares           $15,165,000    $20.18        $43,275,000
Other Revenue   $ 8,762,000    $11.66        $ 7,093,000
Total           $23,927,000    $31.84        $50,368,000

According to the report:

UP Express non-fare revenue of $8.8 million consists of sponsorship and partnership revenues earned in the year. [p 43]

Updated June 30, 2016 at 5:30 pm:

There are two separate sets of figures in the Annual Report related to the subsidy. One claims that the subsidy paid was $63.2m while other shows this value as the total operating cost of UPX. This leads to different calculations of  the per rider subsidy. For completeness, I have left both calculations below pending clarification from Metrolinx.

(As of 5:45 pm Metrolinx has confirmed that their original report was in error.)

Revised version:

Metrolinx has published both the total revenue and the total cost for UPX, and from this we can deduce the operating subsidy.

                               Per Rider
Total Cost     $63,200,000     $ 84.10
Revenue        $23,927,000     $ 31.84
Subsidy        $39,273,000     $ 52.26

With a total cost of $63.2m for 10 months’ operation, an annualized value would be about $76m. If the average fare falls to $10 (half the level with the original tariff), then 7.6m riders would be required to break even.

That is equivalent to about 20,800 riders per day, roughly 2.5 times the current level of demand. This would require an average load of about 144 per train on every trip, both ways, to and from the airport, close to a 2-car train’s capacity. (Calculation based on 4 trips/hour each way, 18 hours/day)

A break-even situation is not in the cards for UPX, and it will continue to drain subsidy dollars from other more widely-used parts of GO operations.

Original version (based on erroneous Metrolinx report):

Metrolinx received approximately $233.8 million in operating subsidies from the Province of Ontario, of which $71.2 million was allocated to the direct costs of PRESTO operations and $63.2 million to the direct costs of UP Express. [p 44]

Yes, just over 1/4 of the subsidy paid to Metrolinx went to support the UPX. This does not include any capital amortization which is provided for separately.

                               Per Rider
Subsidy        $63,200,000     $ 84.10
Revenue        $23,927,000     $ 31.84
Total Cost     $87,127,000     $115.94

With a total cost of $87m for 10 months’ operation, an annualized value would be about $104m. If the average fare falls to $10 (half the level with the original tariff), then 10.4m riders would be required to break even.

That is equivalent to about 28,500 riders per day, roughly 3.5 times the current level of demand. This would require an average load of about 200 per train on every trip, both ways, to and from the airport, greater than the train capacity. (Calculation based on 4 trips/hour each way, 18 hours/day)

A break-even situation is not in the cards for UPX, and it will continue to drain subsidy dollars from other more widely-used parts of GO operations.

Toronto’s Network Plan 2031: Part IV, Relief Line

This is the fourth part of my review of the reports on the agendas of Toronto’s Executive Committee and the Metrolinx Board. The full list is in the first article.

This report reviewed here is the Relief Line Initial Business Case.

Following a series of public meetings and background reports over past months, the Relief Line study has settled on a proposed alignment from Pape Station south to Eastern Avenue, then west to the Don River (passing beside the Unilever/Great Gulf development site), jogging north back to Queen Street west of the river, and thence to University Avenue. This is referred to as Option 3. The other options were:

  • 1: Surface transit improvements on Queen and King, but no Relief subway line
  • 2: Relief line from Pape Station to downtown via Queen
  • 2A: Relief line from Pape Station to downtown running diagonally from Gerrard to Queen via the GO rail corridor.

Future extensions to the north and west are also contemplated, but this “Business Case” report deals only with the first phase.

As the route selection process evolved, so did the scoring system used to rank the options. For example, the employment benefits of the Unilever site were not considered in earlier schemes where a Queen Street alignment all the way from Pape to University ranked highest. By the time we get to the “final” ranking, the Pape/Eastern/Queen alignment clearly wins out. Some of the change is due to the use of the City’s “Feeling Congested” evaluation matrix that has been brought to many of the recent studies. The priorities of these evaluations are more weighted toward social and city building benefits, and less to raw travel-time saving.


ReliefLine_Alignments

Relief to the Bloor-Yonge interchange is projected, although the larger benefits occur when the line is extended north to Sheppard & Don Mills.

The first phase of the Relief Line is anticipated to provide a net reduction of 3,400 to 5,900 riders on Line 1 (Yonge) south of Bloor during the AM peak period. The subsequent extension of the Relief Line north to Sheppard Avenue is projected to provide even greater relief, with a net reduction of 6,500 to 9,900 riders relative to the Base Case in 2041. [p 3]

The future second phase is shown in this map:

ReliefLine_Phase2

The detailed ridership estimates have not been published, but the presumed network elements that would exist for the modelling are:

• Eglinton Crosstown LRT from Mt Dennis to Kennedy Station (currently under construction);
• Toronto-York- Spadina Subway Extension (currently under construction);
• Sheppard Avenue East LRT (funded);
• Scarborough Subway Extension (3 stop) (funded); and
• Connections to new subway stations from existing local bus and streetcar routes [p 16]

Notable by their absence are SmartTrack and the Crosstown East LRT to UTSC, and the Scarborough Subway is presumed to be the 3-stop version to Sheppard Avenue. Considering that the configuration of the “optimized” Scarborough network changed some months ago, the use of an out-of-date model is surprising.

The projected cost of the Relief Line has been widely reported as almost doubling. This is misleading because it contrasts current 2016 dollar estimates ($4.1 to $4.4 billion) with projected spending when the project is actually constructed sometime in the late 2020s or beyond. Earlier estimates have been quoted in older dollars at correspondingly lower projected total cost.

Of the increase, $300-400 million is due to the selection of the Pape/Eastern alignment which makes for a longer route. Roughly $2 billion is due to inflation between the 2016 estimates and the likely period of construction.

An interesting observation in the report is that the benefits case methodology confers a substantial value to reduction of travel time. However, the RL’s primary effect is not intended to speed riders from the outer suburbs to downtown, but to improve flows through the network, especially on the initial downtown-to-Pape phase. Therefore, a significant component of some “benefit” estimates – travel time savings – is not available to the Relief Line despite the major contribution it brings to network behaviour and the expansion potential it creates.

It is important to note that the focus in the Metrolinx business case guidance is on travel time savings benefits and benefits associated with reduction in auto-use. As a result, there are several key benefits associated with local transit and city building objectives that are not monetized in this economic evaluation. Further work is required in the development of the business case tool to ensure the economic evaluation includes the monetization of the types of benefits expected from transit expansion projects which provide a more local service. [p 33]

This begs the question of whether the traditional “benefit analysis” which does contain a travel time saving component truly presents the “value” of new transit lines, or if it is skewed to reward projects serving longer commuter-type trips and the infrastructure they require.

Continue reading

Toronto’s Network Plan 2031: Part II, Scarborough Subway Extension (Updated)

This article continues my examination of the mound of reports going to Toronto Executive Committee and to the Metrolinx Board on June 28, 2016. For a complete list, see Part I of this series.

The subject here is the Initial Business Case for the Scarborough Subway Extension.

A few central points underlie the study:

  • In a review of possible subway alignments through the Scarborough Town Centre, an east-west alignment comes out on top because it would better support future growth of the STC precinct via an eastern extension that is impossible with a north-south alignment.
  • Options that would produce an east-west alignment are eliminated from consideration before a full technical and financial evaluation because it is claimed that the SRT would have to be shut down for the entire period of construction.
  • The preferred alignment via McCowan includes technical challenges, and there are alternatives via Brimley, but these have not been studied in detail. There is no sense of the comparative cost of the alternatives.

Opening date for a Scarborough Subway is now pushed off to 2025 because various reviews, debates and studies have pushed back the start date for the project.

The report is completely silent on related capital projects that are pre-requisites to an SSE including:

  • Replacement of the existing fleet of cars serving the BD subway to allow automatic operation over the extension.
  • Provision of a new subway yard.
  • Launch, but not necessarily completion, of a project to re-signal the existing BD subway.

Updated June 25, 2016 at 10:30 pm:

In the evaluation of options that would require the shutdown of the SRT during construction of whatever might replace it, the report states:

Bus replacement for the SRT service during the construction period would require 63 additional buses and infrastructure requirements such as a bus facility to accommodate the additional bus fleet, and bus terminal expansions at Scarborough Centre and Kennedy Station. The cost of shutting down the SRT during the construction period would amount to approximately $171 million (YOE/Escalated $).

However, this makes no allowance for the following savings:

  • Avoiding the need to keep the existing SRT operating, a value estimated in July 2013 as $132 million including inflation. See Scarborough Rapid Transit Options at p 7.
  • Buses and garage space provisioned for the temporary shuttle would have a life beyond the end of the project, and indeed the TTC requires another new bus garage beyond McNicoll Garage in northern Scarborough. Only the cost of buying, building and operating these earlier than would otherwise occurs counts as a net cost against the project.

This is either an error in calculation, or a misrepresentation of the true cost of replacing SRT operation.

Given that the LRT option would require a shorter shutdown of the SRT than the subway options, the cost of the bus shuttle would be correspondingly lower.

[End of update]

Continue reading