On May 1, 2023, the TTC released the final version of the service changes planned for May 7. These are substantially the same as the draft version obtained via a Freedom of Information request by TTCRiders. See Draft of TTC Service Changes Effective Sunday, May 7, 2023.
Back in January during budget debates, some Councillors asked for details of the service cuts that would be implemented due to increased crowding standards and financial constraints. TTC staff agreed that this information could be available within a week, but an unseen hand at a higher level (either the TTC CEO Leary or then-Mayor Tory’s office) blocked this. Actually admitting the effects of a budget before it was approved simply was not part of the TTC’s agenda.
The official, final version allows comparison with the draft version. Although the TTC suggested that TTCRiders publication of the draft could be misleading because of changes in the final version, in fact there is very little change.
This article includes only the updates since the draft version, and readers should look to the article linked above for the full list. The spreadsheet (linked later in the article) detailing all of the changes has been updated to reflect the differences between the draft and final versions.
Updated May 2, 2023 at 10:10 am: A overview of all routes showing which get more service and which get less has been added.
The TTC has announced that the 504 King streetcar is now actually running on King Street!
For the period from May 1-6, the 504B streetcar service from Broadview Station to Dufferin Loop will operate over the normal route. The west end 504C bus from Dundas West Station to the Distillery, and 504D from Broadview/Gerrard to Exhibition via Strachan will continue to operate until May 6.
Effective May 7, streetcar service will resume all the way to Dundas West Station, but all cars will operate to Distillery Loop because the Don Bridge on Queen will be under repair for a few months. The east end of the line will operate as a shuttle bus from Parliament & King to Broadview Station. West end service will be the standard combination of 504A cars to Dundas West and 504B cars to Dufferin.
This will change again on June 18 when major construction begins on Broadview Avenue and TTC service between Gerrard and Danforth will be suspended. For further details, see my article on this summer’s construction projects.
As I write this, the routes as defined to NextBus (which supplies most data to prediction apps) have not been updated for 504 King or 501 Queen (which starts its own major diversion around Ontario Line construction). This means that predictions for stops are going to be a mess probably for the coming week until the main update with the May 7 service changes is implemented.
With the shutdown of Queen Street for Ontario Line construction between Victoria and Bay, we will not see streetcars there for many years. The last cars will run just before midnight on April 30, 2023.
Until early 2024, the absence will be over a longer stretch from Broadview to McCaul until new diversion track via York and Adelaide is finished. In turn, that depends on relocating nine utility vaults under the new Adelaide trackage.
It is possible that the TTC will revise the diversion pattern once the Don Bridge reopens to streetcars later in 2023 (it will close for maintenance on May 7), but nothing has been decided yet.
Here are photos of various generations of streetcars on the central section of Queen as a memento while we await their return.
Note that this is a large gallery, and it will take a while to load after you first click on a photo.
Two months from now, on June 26, Toronto will elect a new Mayor thanks to John Tory’s unexpected departure. There will be at least fifty candidates on the ballot, although most of them will garner only a handful of votes.
I am not one of them, and have no ambitions to high office. That said, I certainly have hopes that our new Mayor will have a strong pro-transit agenda and will actually care about the City rather than brown-nosing their way to small favours from Queen’s Park.
For those who are interested, here is the campaign-sized version of my advice and platform were I running:
Service is key. Run as much as possible, everywhere, and run it well.
Build budgets based on what you want to see, not on what you think you can afford. Just getting by is not a recipe for recovery and growth. If the money doesn’t come, then look to “Plan B” but aim for “Plan A”.
Fares are a central part of our transit system, but the question is who should pay and how much. Strive for simplicity. Give discounts where they are truly needed. Make the transit system worth riding so that small, regular increases are acceptable.
Focus on ease of use among transit systems in the GTA, but do not equate “integration” with amalgamated governance.
Transit property: parking or housing?
Foster a culture of advocacy in management and on the TTC Board.
Beware of lines on maps. A “my map vs your map” debate focuses all effort on a handful of corridors while the rest of the network rots.
Plan for achievements in your current term and make sure they actually happen. Longer term is important, but the transit ship is sinking. You are running for office in 2023. Vague promises for the 2030s are cold comfort to voters who have heard it all before.
That’s more than will fit comfortably on a leaflet, but, hey, I am the blogger who writes long form articles about transit. As a commentator, my biggest worry lies with those who say “TL,DR”. In the following sections I will expand on the bullets above. Thanks for reading.
How much would all this cost? In many cases the answer depends on the scale and speed of implementation. Although I have a sense of at least order of magnitude costs, I am not going to be foolish enough to put specific dollar figures here. For too long, City policy has started with a budget rather than a philosophy, an aspiration to be great, and settled for just good enough. We almost certainly cannot afford everything today, but we need to know what tomorrow we strive for.
If the 2003 Ridership Growth Strategy taught us anything, it was that we should first talk about aspirations, about what the transit system might be, rather than precluding debate with the classic “we can’t afford it” response. It’s amazing what monies can be found once information is out in the open. We commit tens of billions to construction, but are terrified, at least politically, by far lower costs to improve transit for everybody today.
I have deliberately omitted a discussion of security and related social services here. These are not just transit issues, but part of a city-wide, society-wide problem that will not be solved with a simple show of force. Recent trends both in public opinion and official responses at the City and TTC show an emphasis on providing support for those who need it: the homeless and the mentally unwell. This should continue and expand.
An inevitable question is who will I endorse? That will come later in the campaign as candidates flesh out their programs. Some make their beds with the provincial Tories. As enemies of the city, collaborators, they deserve only contempt. For others, we are in promising early days.
In recent articles, I commented on the size of the bus fleet claimed in the CEO’s Report, the number of buses actually shown as active in the Scheduled Service Summary, and the ratio of spares to scheduled service.
Updated April 24, 2023 at 6:30pm: The chart of average daily mileage by each bus has been amended to show the garage assignments of each vehicle.
An underlying issue for a transit system with a large proportion of spare vehicles is that the active vehicle count can be lower than the total count. Poor-performing vehicles, be they near retirement or simply lemons that cannot travel far without a breakdown, can be sidelined with no effect on service.
However, this can create two key problems:
A culture of indifferent maintenance while keeping only the best buses on the road can minimize repair costs and keeps service quality up, at the expense of garage space and the capital value of the unused vehicles.
The headroom to improve service is lower than it would appear from the raw vehicle count if vehicles shown on the active roster are there in name only. If they were actually needed, they might not be reliable enough to provide service.
To determine the actual usage of the bus fleet, I obtained a summary of tracking data from Darwin O’Connor, proprietor of the TransSee website, for the period from March 1 to April 21, 2023. This allowed me to plot actual usage of the fleet in various ways. Many thanks to Darwin for this assistance.
First is a simple plot of active vehicles by day. The chart below shows the number of buses with non-zero mileage by day over the period. There are several interesting features of this chart:
The regular pattern of weekdays, Saturdays and Sundays is clear. Note the three-day weekend for Easter in early April.
Although scheduled service cuts were implemented on March 27, there was no change in the count of active buses which, if anything, rose slightly. There is a drop in the following week.
The number of active buses exceeds the peak scheduled service by about a hundred vehicles. These are not necessarily extra “run as directed” buses, but rather vehicles that only operate for part of the day and are replaced by others (for example, AM and PM peak trips).
The spike on March 13 appears to have been caused by a single day on which buses that were otherwise inactive were sent out in service. Looking at the detailed tracking data, they did not stay in service for long. However, this spike distorts the apparent number of active buses if one looks only over a wider range of dates.
Another way to look at the data is to plot the number of days buses were active over the 51-day period. The chart below shows the number of buses with non-zero mileage and the count of days active. For example, the high point shows that 141 buses were active on 47 of the 51 days. By contrast, 72 buses were active on only one day, and a further 43 for 2 to 10 days.
This means that 115 buses did not venture into service much during the period. In addition to these are buses still counted as active, but which did not operate at all. The TTC might nominally have a fleet of about 2,040 buses (although they claim 2,114 in an outdated chart in the CEO’s report), but the number actually available for service is likely below 1,900.
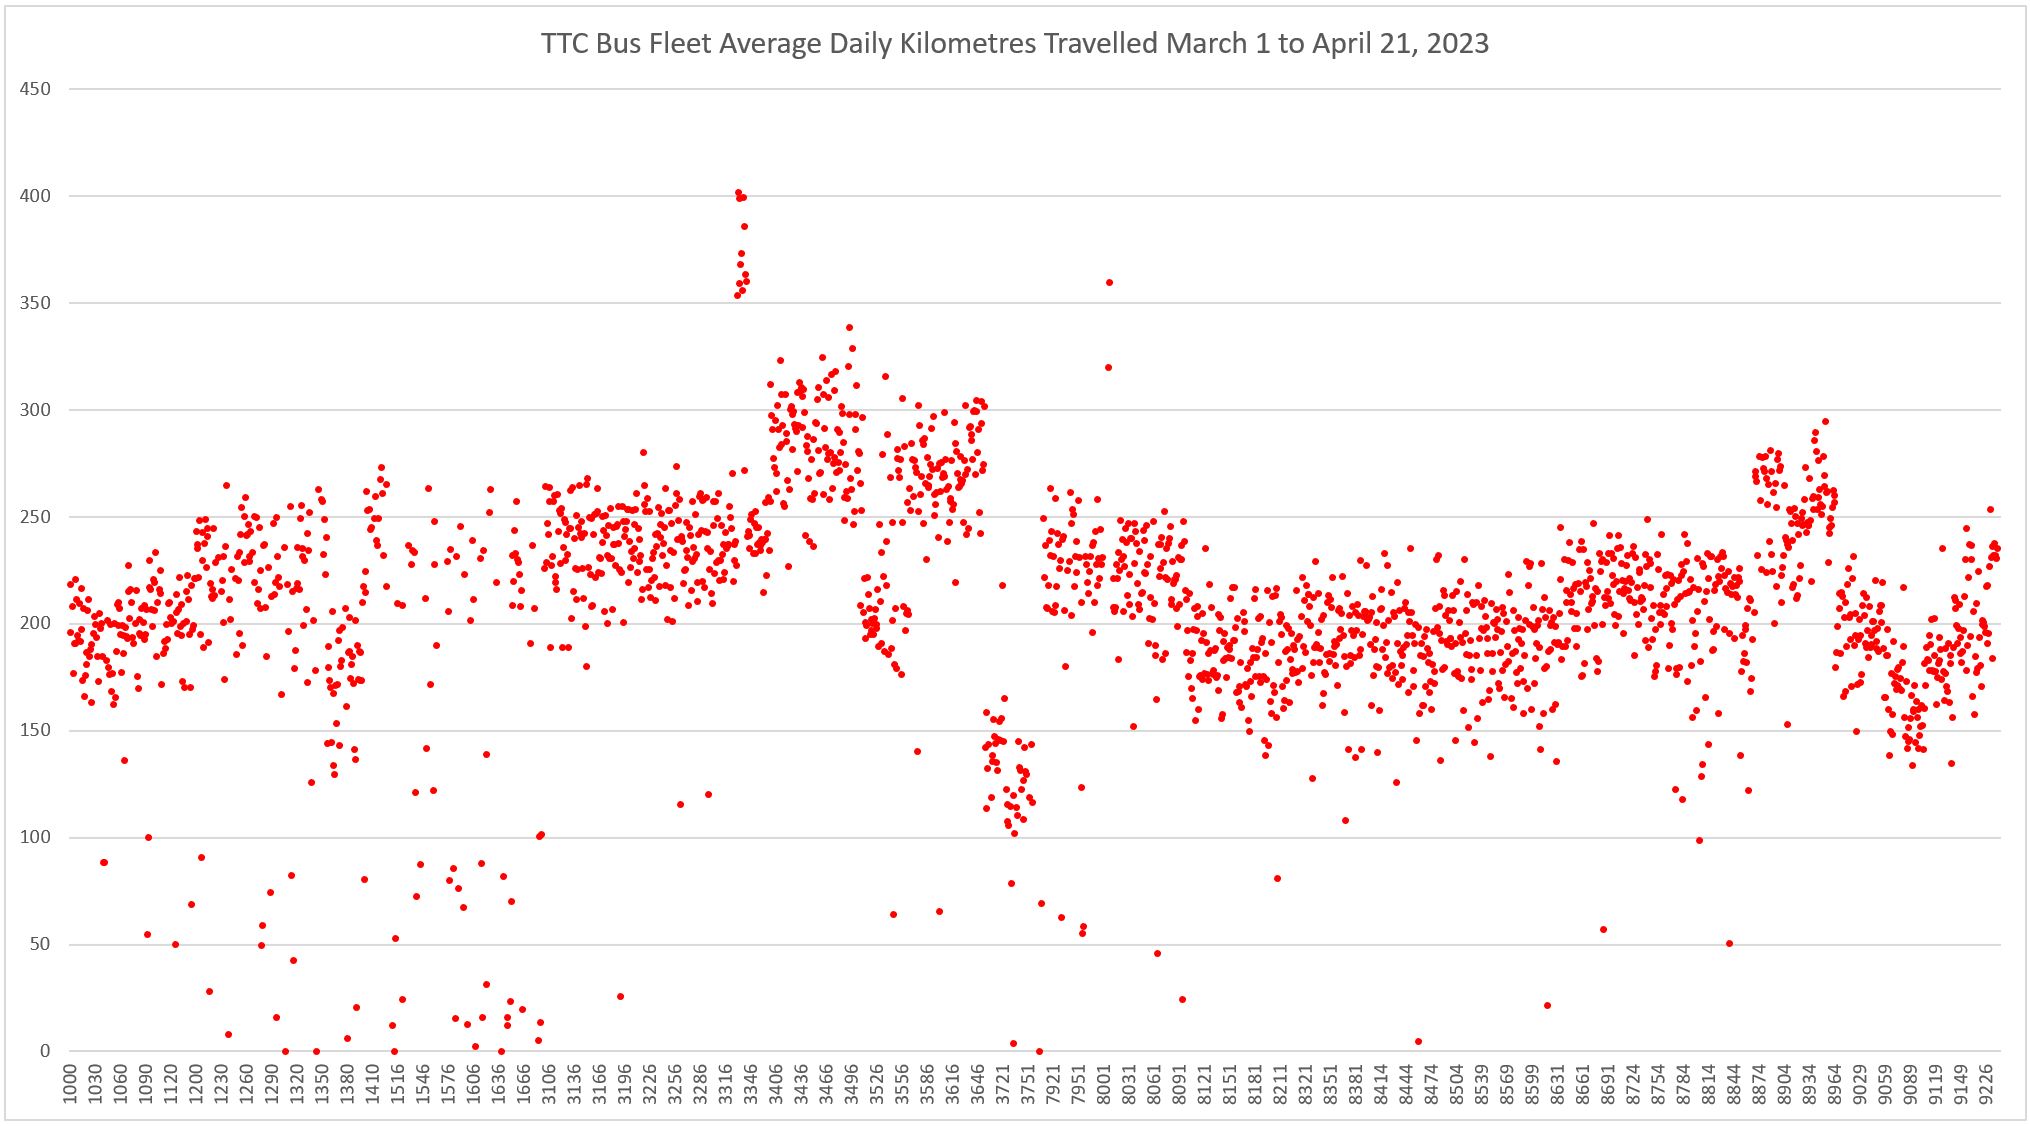
Yet another way to look at the data is to plot the daily average distance traveled by each vehicle considering only the days on which it was active. In other words, if the bus went out in service, how long did it stay there?
In the chart below, buses with no tracked mileage are not plotted. Note that the horizontal axis skips over breaks in fleet numbering. For example, there are no buses in the 2000, 4000, 5000 and 6000 ranges.
Items of interest here include:
A few buses sprang to life briefly, but have daily averages very close to zero.
Low average mileages are evident for older buses in the fleet:
7900 to 7979: 2006 Orion VII Diesel
8000 to 8099: 2007 Orion VII Diesel
1000 to 1149: 2006 Orion VII Hybrid
1200 to 1423: 2007-2008 Orion VII Next Gen Hybrid
1500 to 1689: 2008 Orion VII Next Gen Hybrid
The battery buses 3700 to 3759 stick out with consistently lower average mileage than other parts of the fleet. Some eBuses were completely inactive during the 51-day period:
New Flyer: 3705, 3706, 3715, 3720, 3724 (5 of 25 buses)
Proterra: 3729, 3732, 3736, 3739, 3744 (5 of 25 buses)
Buses assigned to 900 Airport Express have higher daily mileages (3330-3341, 8007, 8008) because they run on a very fast route.
Blocks of buses have higher daily mileage than others because they operate from garages with faster routes.
The TTC has just started to take delivery of over 300 new hybrid buses, and hopes to buy a comparable number of eBuses starting in 2024, subject to federal funding. If these displace the little used older fleet and increase the number available for sustained, all day service, this will be a significant contribution to what the TTC could achieve.
There will be a jump in service requirements in November 2023 when the SRT Line 3 is replaced by a bus shuttle from STC to Kennedy Station. That new fleet is arriving just in time. A budgetary oddity is that this service will be paid for from the Capital Budget as part of the cost of the Scarborough Subway Extension, and so it does not represent a net new cost to the TTC. Meanwhile, Queen’s Park is foot-dragging on paying for conversion of the SRT right-of-way as a bus roadway that would speed travel and reduce bus requirements.
Having more, working active buses to provide better service requires more operators and mechanics. A bus that sits in the yard costs next to nothing to “operate”. If hundreds of new buses sit idle (or allow middle-aged buses to be sidelined) this would be both a waste of capital and a betrayal of the promise of better service with a rejuvenated fleet.
The TTC has not produced a public fleet plan in years, and especially not one showing the effect of various scenarios for service growth or retrenchment. Current plans see only a 1% growth and this translates to small expansion of the bus fleet, especially considering that some bus services will convert to LRT when and if Lines 5 and 6 ever open.
Council’s goal to “green” the fleet may reduce diesel emissions, but the much larger target and goal is to move riders from private autos to transit. This cannot happen without better service and a working, fully available fleet.
Updated April 24, 2023
The chart below contains the same data as the scatter chart above showing average daily mileage for each vehicle, but with the dots colour coded to show the division to which the bus was assigned as of January 2023. The variation due to service characteristics in different parts of the city show up particularly for buses operating on faster suburban routes.
This is a follow-on to my article about the number of spares on the bus fleet.
The question of the day is why do we have so many surplus streetcars and subway trains. This article will provide some history of how the fleets and service levels evolved in recent years.
First off, I must report an error in my previous article which includes a table showing that the TTC has 551 spare buses. The actual number turns out to be 478.
The reason for the error is that a chart in the CEO’s report incorrectly shows the total bus count at 2,114. That was the value when this chart was originally used back in early 2021, but it has not been updated to reflect retirements of old vehicles. The actual number of active vehicles, according to the TTC’s Scheduled Service Summary for March 26, 2023, is 2,041. (This number does not appear as a total, but is obtained by adding up the number of active buses for each group in the fleet. See the last page of the summary for details.)
This still leaves the TTC with more buses on their hands than they strictly require for scheduled service plus maintenance, or to put it another way, with headroom to run more service without buying more buses.
The TTC has three new bus orders in the works for delivery in 2023-24:
135 40′ hybrids from New Flyer
68 60′ hybrids from New Flyer
134 40′ hybrids from Nova Bus
It is not clear how many existing buses these will replace and what the resulting fleet mix will be by the end of 2024.
Separately from these will be a new fleet of over 300 battery electric buses. This contract (or possibly contracts) has not been awarded yet while the TTC awaits confirmation of federal funding for “green” buses.
The TTC Board met on April 13 with an agenda that did not give any indication that there would be lengthy debate on any item. I previewed the major issues in a previous article and will not repeat those comments here.
Updated June 13, 2023 at 2:50pm: The proposed expansion of Broadview Station Loop has been deferred to an unspecified date. Street trackage at the loop will be replaced this year as planned. The planned removal of most bus service from Broadview Station will not occur. Routes 8 Broadview and 62 Mortimer will continue to serve the station. Route 100 Flemingdon Park will be rerouted to Pape Station where it will interline with 72A Pape to King and Parliament.
Other changes have been made in future plans and this article should be used only for historical reference to the original plans. See also:
The big items in the public portion of the agenda are the monthly CEO’s Report and an update on TTC’s finances and major capital projects to the end of 2022.
There are also two reports on collective agreements and non-union salaries. Although the details lie in confidential attachments, the public reports give an overview of the various labour contracts and salary drivers across the organization. I leave perusal of these to interested readers.
Finally there are a few references to the TTC’s eBus program scattered through reports. I will consolidate this info in its own section at the end of the article.
Correction April 18, 2023: It turns out that the size of the bus fleet shown in the graphic below is wrong. There are only 2041 buses, not 2114, in service as of March 2023. The article has been amended to reflect this.