
Riders of the western branch of TTC’s Line 1 Yonge-University-Spadina have suffered through long-standing areas of restricted speed opertion for years. However, the problem has crept onto the eastern branch is recent months making for very slow trips over the most heavily used part of the line.
On the past weekend (September 19-20, 2026), Line 1 was closed between St. Clair and College for track repairs, but this is only one in a seemingly unending series of works.
Subway service becomes less and less credible through many types of delay, but also the sense that nothing is done. Much debate recently in social media and now in election campaigns focuses on Platform Edge Doors (PEDs) whose supposed purpose is to keep riders off of the tracks (regardless of their motive) and resulting delays. An installation-in-progress at TMU (formerly Dundas) Station is laughably inadequate to this task.
Any goal of increasing transit use is doomed if the service offered is slow and unreliable. Without downplaying the potential value of PEDs, a far more pervasive problem is part of the daily subway experience – slow zones.
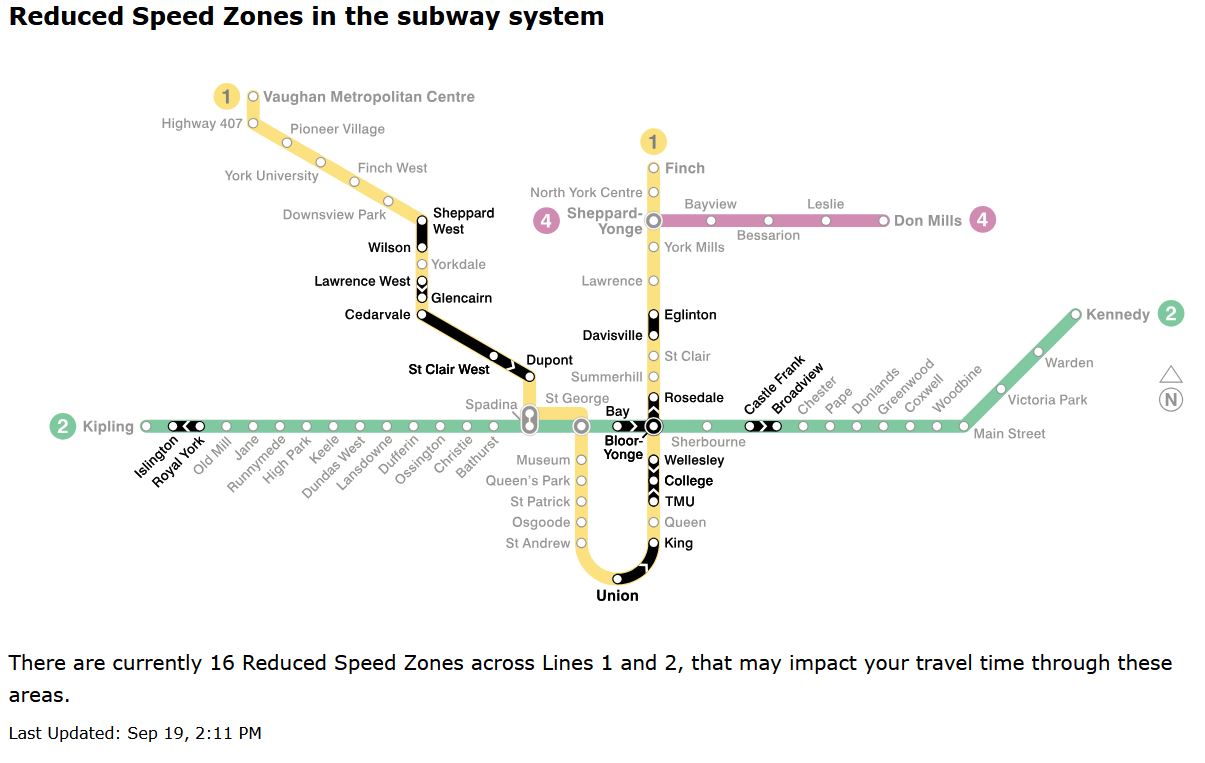
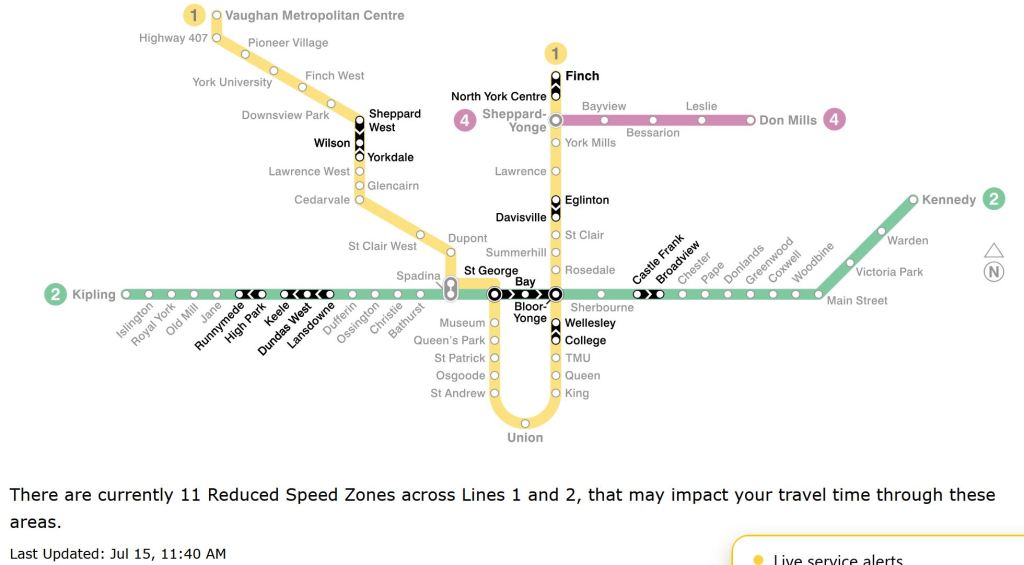
Here is the map of slow zones taken from the TTC’s site on Saturday, September 19. The “downtown” part of Line 1 is particularly bad, but the “Spadina” leg of the subway is close behind.
These are detailed in tables taken from the same TTC page (click to expand).
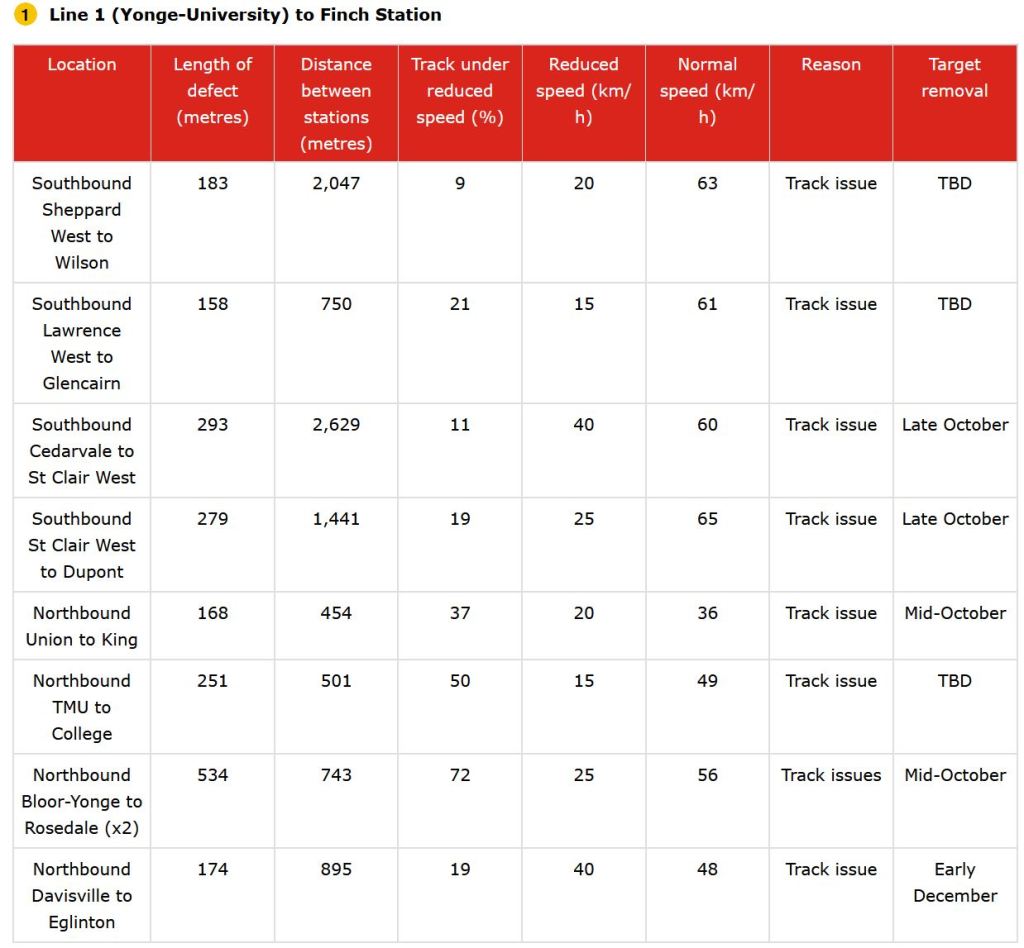
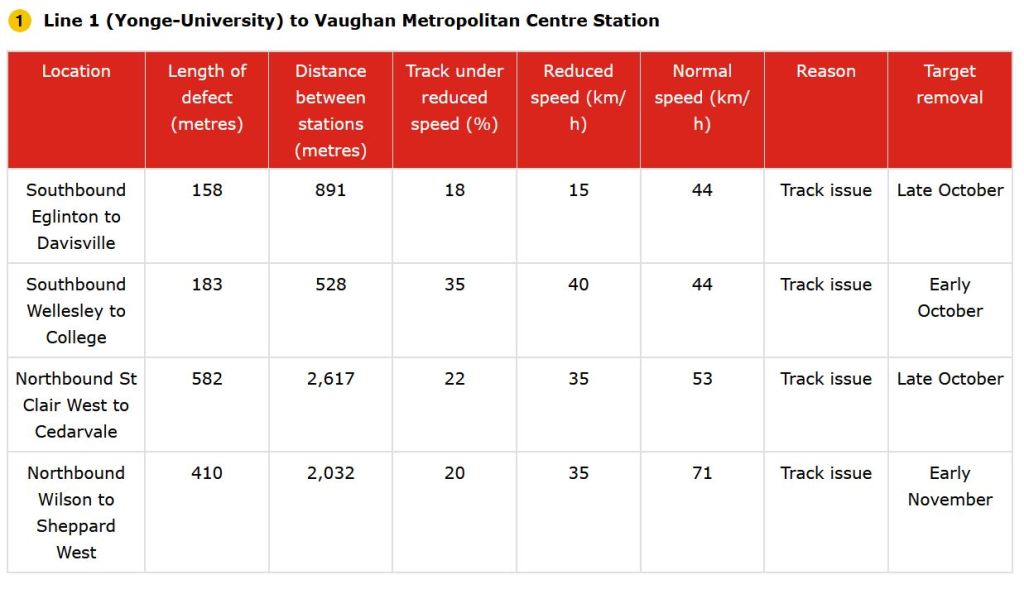
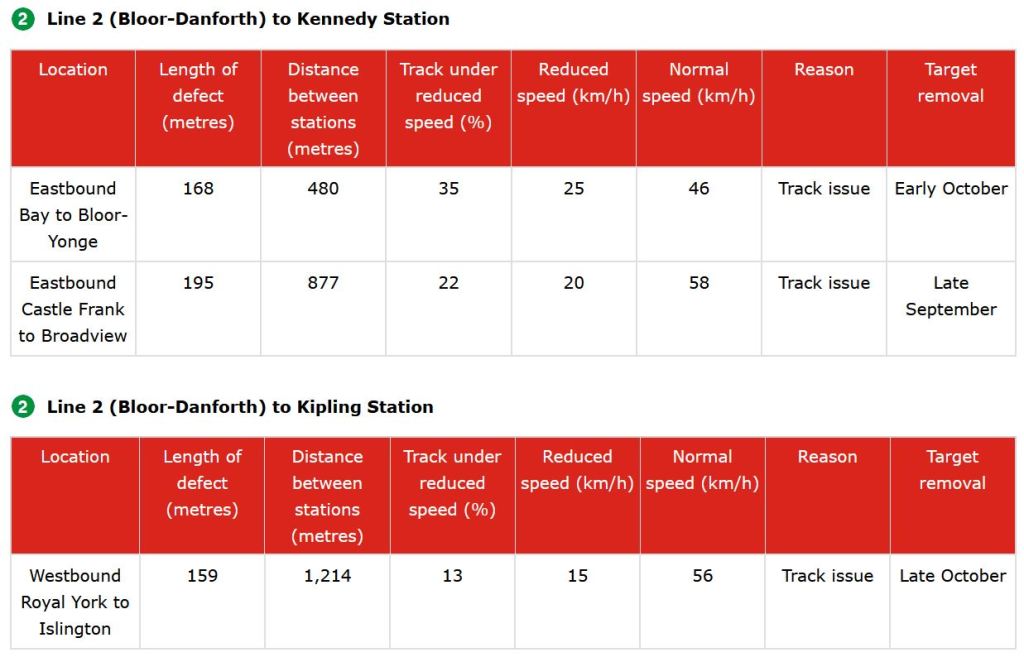
One recently eliminated zone at Queen Station both ways was described as being for “Ontario Line construction” with a resolution date of “TBD”. That sounded like a very long-running project, but it has vanished.
I recently learned that Queen Station has settled about 1cm thanks to work underneath it. This begs the question of whether this condition has been stabilized, and if the slow order was an attempt to minimize further problems as Ontario Line excavation digs below the existing structure.
Another issue with the number of slow zones is the TTC’s ability to perform maintenance work. The work car fleet, which suffered problems with hydraulic leaks (among other issues), is still not back at full strength. Without enough work cars, there is a limit on how much can be undertaken.
The background to this shortage goes back nearly a decade to the transition between CEOs Andy Byford and Rick Leary. Byford’s team had a plan to refresh and expand the work car fleet, but this was deferred by Leary as a cost-cutting measure. Older equipment needs more routine inspection and maintenance, and fails more frequently. This creates a scheduling problem both among projects needing the cars, and a cascading effect when they are pulled from service for maintenance, sometimes on short notice.
Parts of the subway, especially on Line 1, require major reconstruction to permanently correct track condition issues. This would require an extended shutdown, more than a weekend, and the thought of a weekday “bus shuttle” is daunting. Even Byford did not launch such a project.
In past articles, I have published charts showing the areas of each line affected by slow orders, and the full sets from 2024 to September 2026 are shown below. Here is a link to a PDF for those wishing to download them.
In these charts, the coloured bars extend between stations and the arrows within the bars show the direction of the slow order. The double arrow “<>” indicates “both ways”. (Click to expand.)
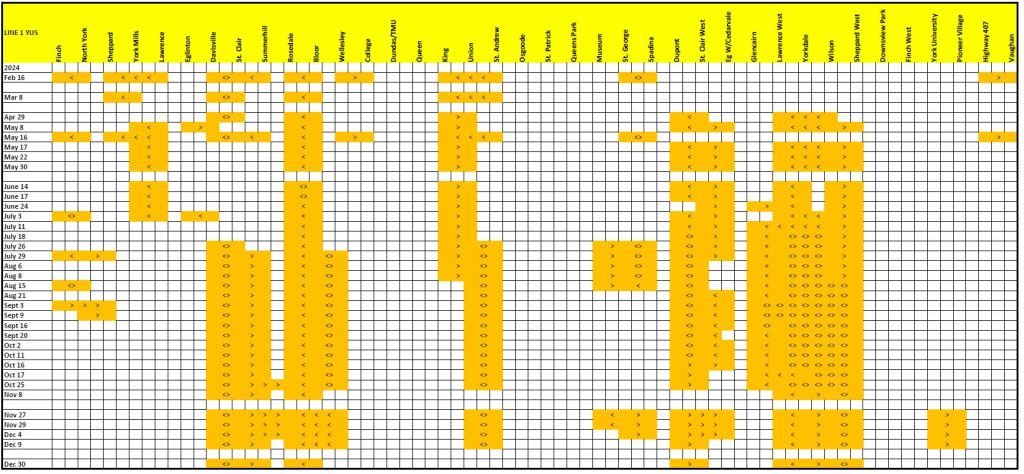
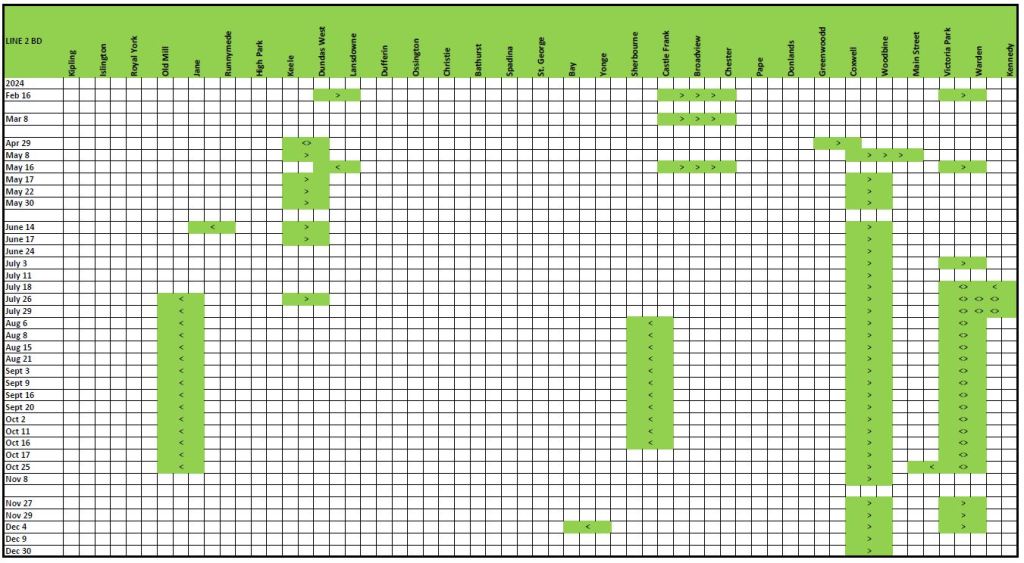
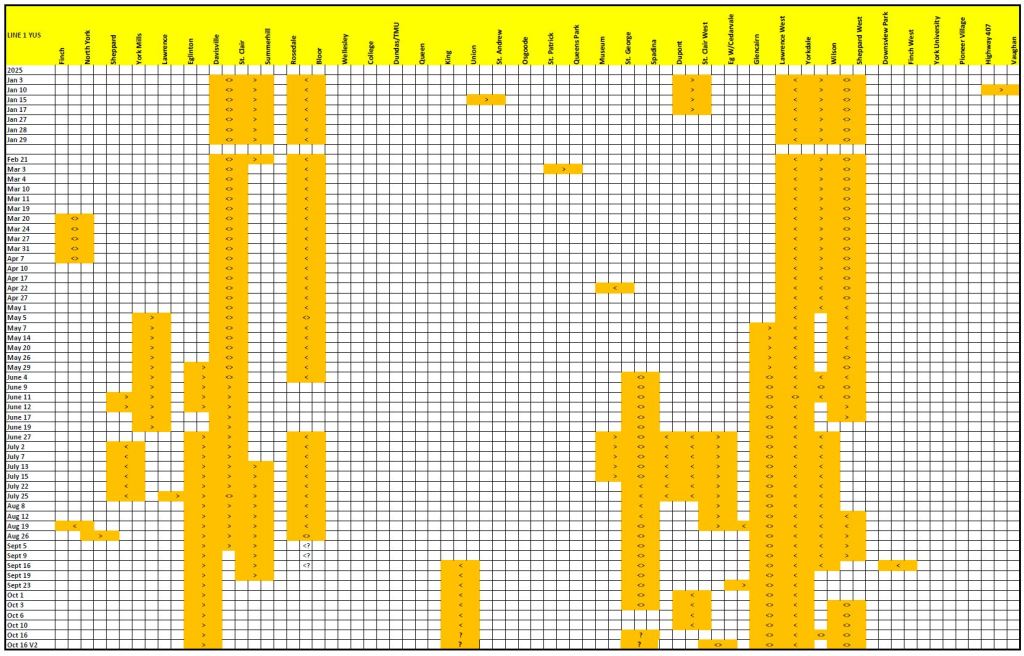
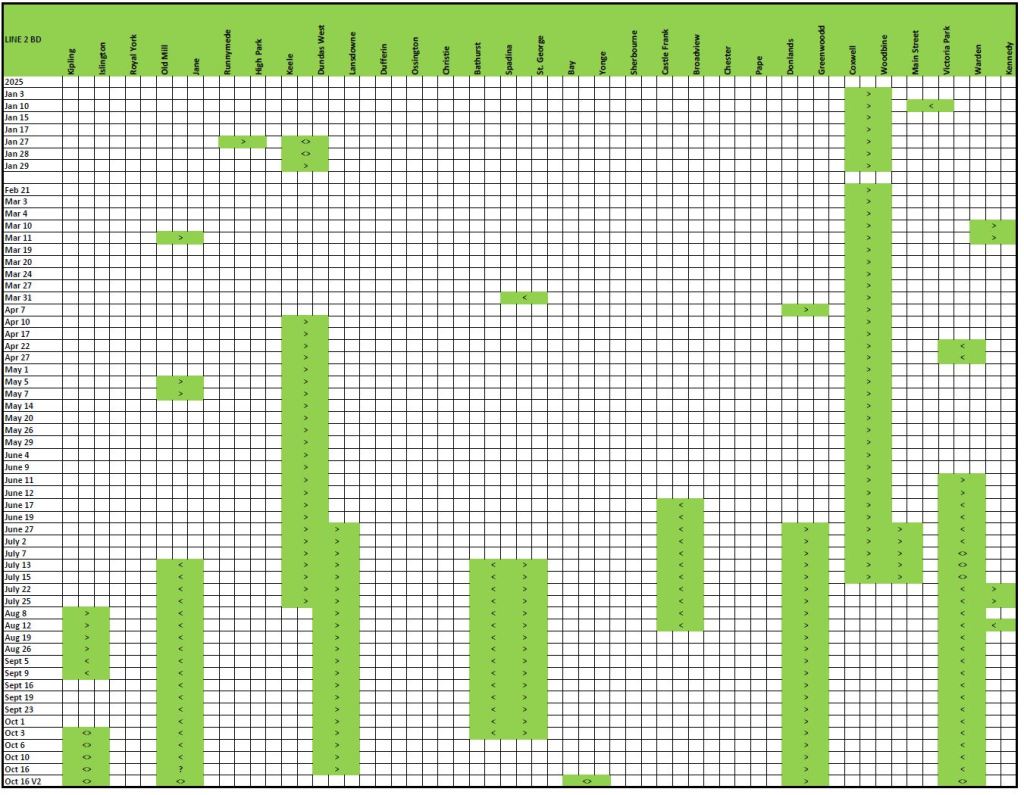
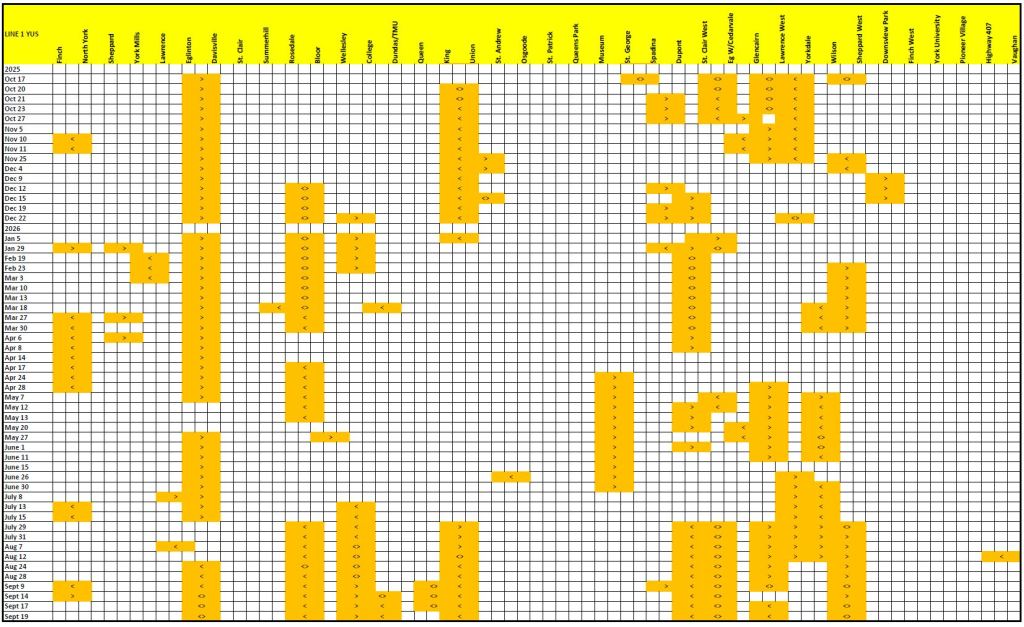
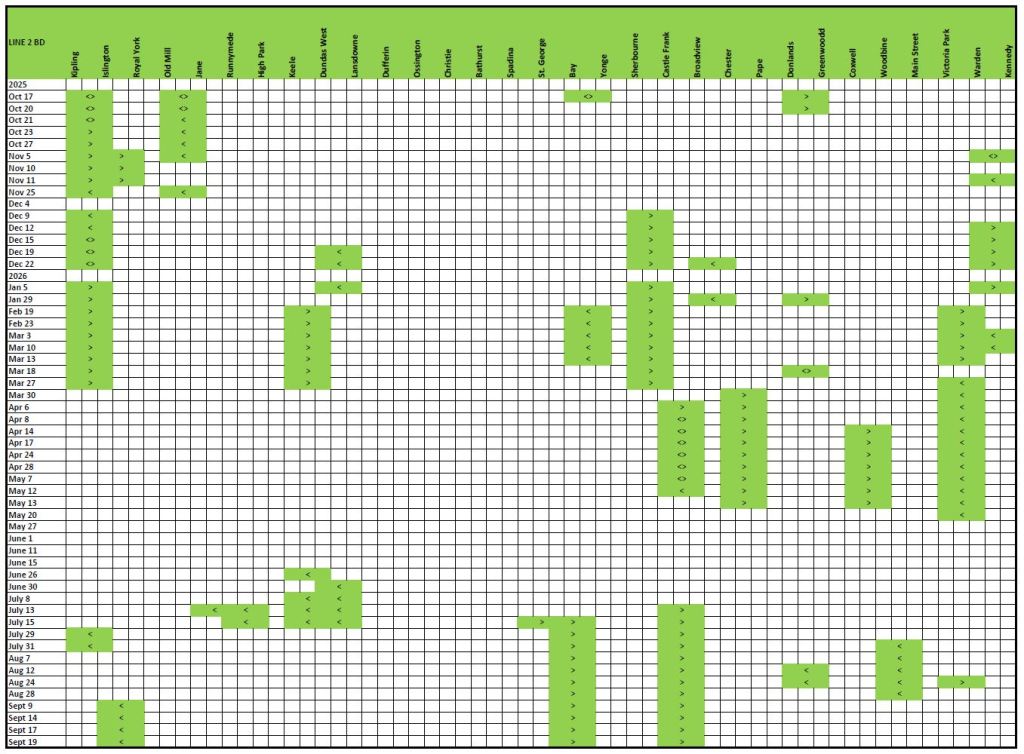
What is glaringly obvious here is that there are portions of the subway that have been almost continuously under slow orders notably:
- Eglinton to Davisville
- Rosedale to Bloor
- Cedarvale (Eglinton West) to Sheppard
- Islington to Kipling
- Warden to Victoria Park
These share a common factor: the track is out of doors built on ties and ballast as opposed to the concrete slab of a tunnel.
Another factor specific to Line 1 is the curves which are far more common than on Line 2. These are areas where rail wears more quickly, and the tighter the curve, the greater the wear. The oldest part of the line has tight curves between Wellesley and College, at Union Station and between Museum and St. George.
A notable lull in the number of slow zones occurred for the World Cup period where the total count dropped to 2, the only time it has been this low in three years.
This did not last, and only weeks later the count grew again.
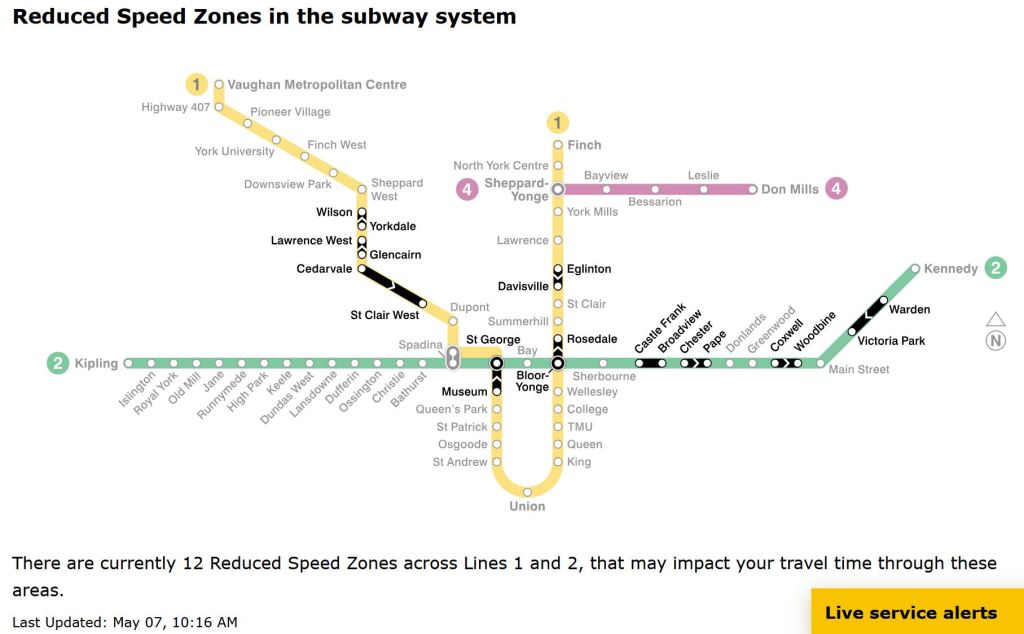
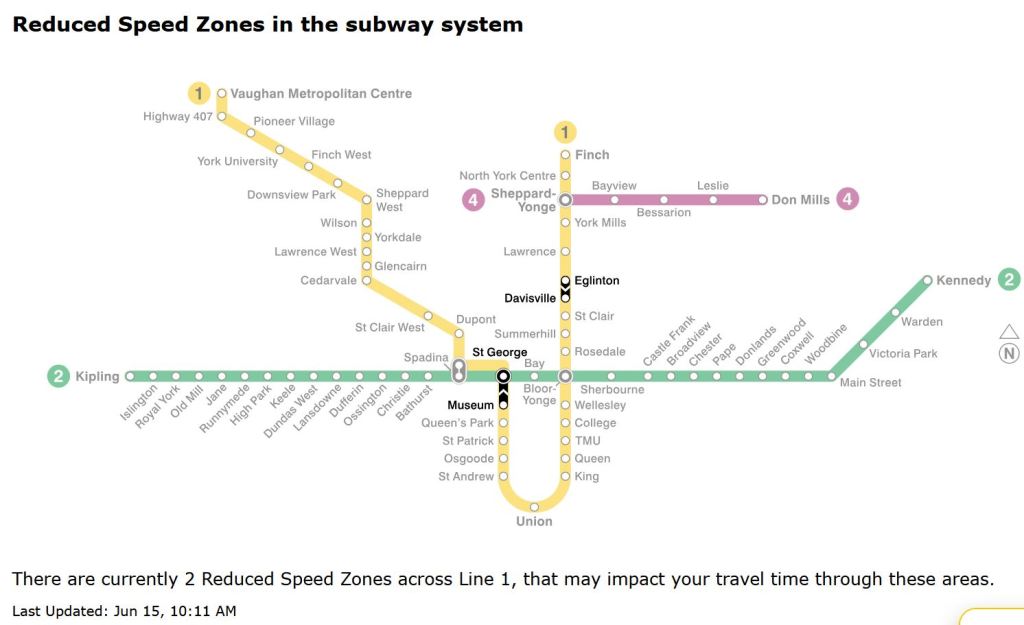
What happened? Before the games, there was a push to eliminate slow zones to put on the best show for subway service. However, a regular quarterly inspection of the system was deferred so that its results would not trigger a new set of slow orders just before the games.
The CEO’s monthly report to the Board cites many issues such as service and vehicle reliability, but is almost completely silent on slow orders and their effect. For example, there is a chart of delay causes. Note that the effect of RSZs is explicitly omitted.
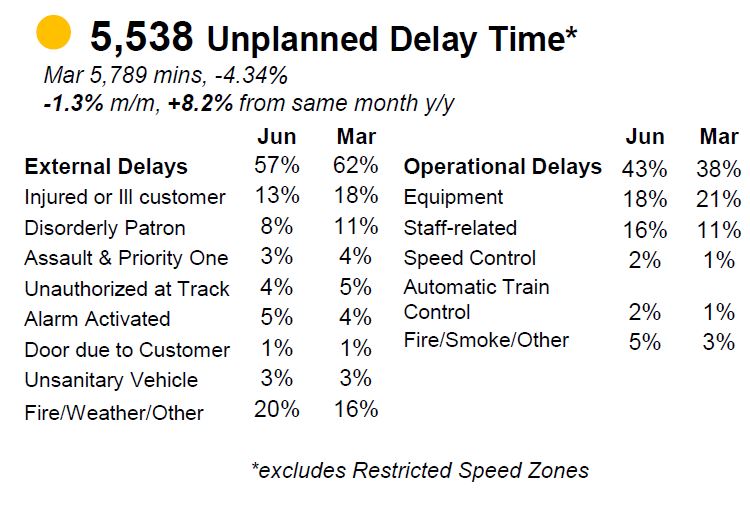
One problem for delay reporting is that the stats are organized by incidents. A train breaks down. A passenger is ill. The event lasts for a fixed period, and this counts toward the number of delays and total time. It does not reflect the number of trains held in the backlog, the number of passengers affected, nor the upheaval of replacement service if any.
By contrast, a slow order affects all passing trains and riders for days, weeks or months, but there is no accounting for this.
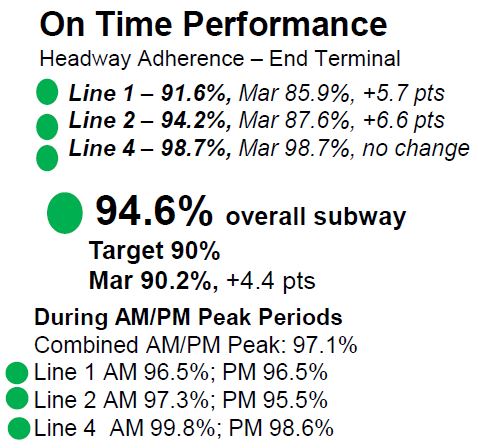
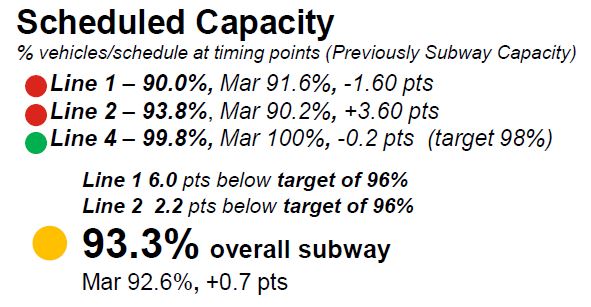
The CEO’s report includes two indices of service quality:
- On time performance (OTP)
- Proportion of scheduled capacity operated
These metrics can hide more than they tell.
OTP is measured relative to the scheduled headway (interval between trains) with a leeway of 100% as defined by the official Service Standards.
For services that operate better than 6 minutes, the vehicle is considered on-time when the headway deviation is less than 100% of the scheduled headway. For example a service that operates every 3 minutes is deemed on-time if the headway deviation falls between 0 minutes and 6 minutes. TTC’s goal is to have 95% of all trips operated within ±100% of the scheduled headway over the entire service day. [Service Standards at p. 18]
In other words, peak service trains are supposed to arrive every 2.5 minutes, but the headway can be up to 5 minutes and they are still “on time”. Off-peak trains scheduled 5 minutes apart can have a gap of 10 minutes and fall within the standard. Put another way, half of the service could be missing, but what remains would be “on time”.
If trains are missing, most commonly due to a delay that blocks service for a period, the number of trains/hour passing a point will be less than the scheduled level. The functional capacity of the line would be less than advertised. However, if the trains simply run more slowly, but all of them show up, this does not affect the stats.
Thanks to the new Automatic Train Control system (ATC), trains can run closer together on Line 1 than with the old block signal system, and this at least partly offsets the effect of slow orders. If the same proportion of Line 2 were under slow orders, its block signal system would limit the ability of trains to physically bunch up through the slow sections.
Another problem lies in reporting both OTP and capacity averaged over an entire month with no breakdown of time period or locations where service fell further below target.
There are other problems with the CEO’s Report, but that’s for another article. The issue here is that major aspects of subway maintenance and service quality are not reported nor tracked at the Board level.
What Can Be Done?
The first and vital act is that TTC management must publicly announce the extent of its problems including:
- track condition
- scale of issues – what can be repaired vs major replacement/upgrade of infrastructure
- status and adequacy of the work car fleet for the ongoing workload
This has implications for the capital program (replacement and expansion of the fleet) and for the scope of work (major reconstruction as opposed to running maintenance), as well as for staffing levels. Procurement of new cars is not a speedy process.
If more aggressive plans for service replacement are brought forward, these must include aggressive transit priority measures so that buses are not snarled in traffic. TTC management does intend that more extensive suspensions, partly offset by changes in subway operation, will occur in 2027:
Planning for 2027 closures is underway to increase maintenance windows and minimize customer impacts, including through expanded use of single-track operations on Line 1. [CEO’s Report, p. 5]
Regular reporting on status is also needed. The maps and tables on the TTC’s site are a start, but there is no formal tracking of trends and progress at the Board level. Moreover, there is no metric to track the cumulative effect of trip delays for passengers.
There should be no gaming of the system by timing major inspections to fall just after reporting intervals.
The TTC had a wakeup call with the SRT derailment in July 2023, and this prompted a review of conditions on the subway. There are also ongoing problems with slow orders on the streetcar system hampering its operation. While we are patting our backs about ridership recovery and talking of future growth, Toronto should pay attention to infrastructure maintenance and service quality if it hopes transit can be an attractive alternative to other travel modes.
 Steve Munro
True, but I recall Byford floating the idea in public. I also recall councillor Josh Matlow ridiculing Byford’s idea as impractical. So here we are years later, with aging roadbed, due to our culture’s apparent inability to make hard decisions. Sad.
LikeLike