
This article continues a series reviewing the operating speeds of streetcar lines in detail looking at:
- Evolution of travel times on 511 Bathurst from September 2019 to June 2026 by route segment.
- Detailed profiles of operating speeds over the full route for the same months.
- Locations where streetcars spend long dwell times including stops, traffic signals and road congestion.
The two intervals compared here are:
- June 1-5, 2026: This was just before the upheavals of the World Cup period, but without any construction diversions that would distort the data. At this point, red lanes were installed on Bathurst from Bloor to Nassau (north side of Western Hospital), and from Dundas southward.
- January 13-17, 2020: This was early in the operation of 511 Bathurst with the new Flexity streetcars, after the holiday period but before traffic conditions changed with the pandemic in March.
Locations of substantial delays lie mainly south and west of Queen and Bathurst, although the focus on priority has been further north. Some benefits of the red lanes are evident, but the south end of the route needs a detailed review to determine why supposed priority areas on Bathurst and on Fleet are locations for delay.
Service Designs
Note that scheduled travel times in 2026 are lower than in 2020. One might think that this is due to the adjustment for effects of the red lanes on Bathurst, but in fact the shorter travel times were implemented in November 2025.
June 2026:

January 2020:

Methodology
For a description of the methodology behind these charts, please refer to the Overview.
Comparative Travel Speed by Route Segment
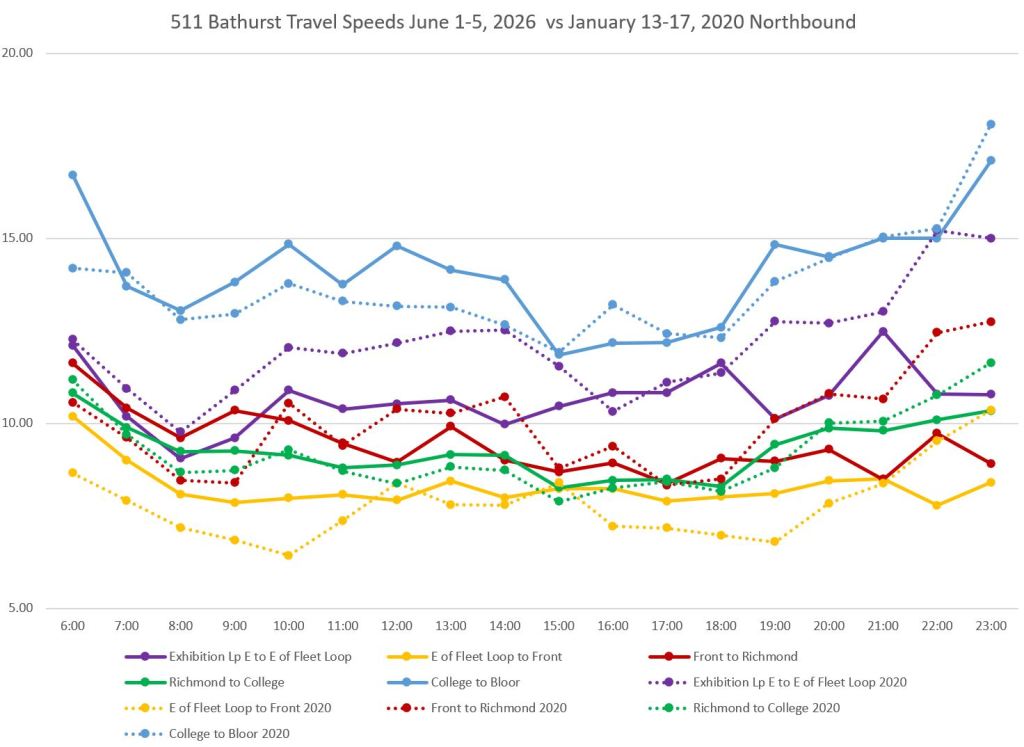
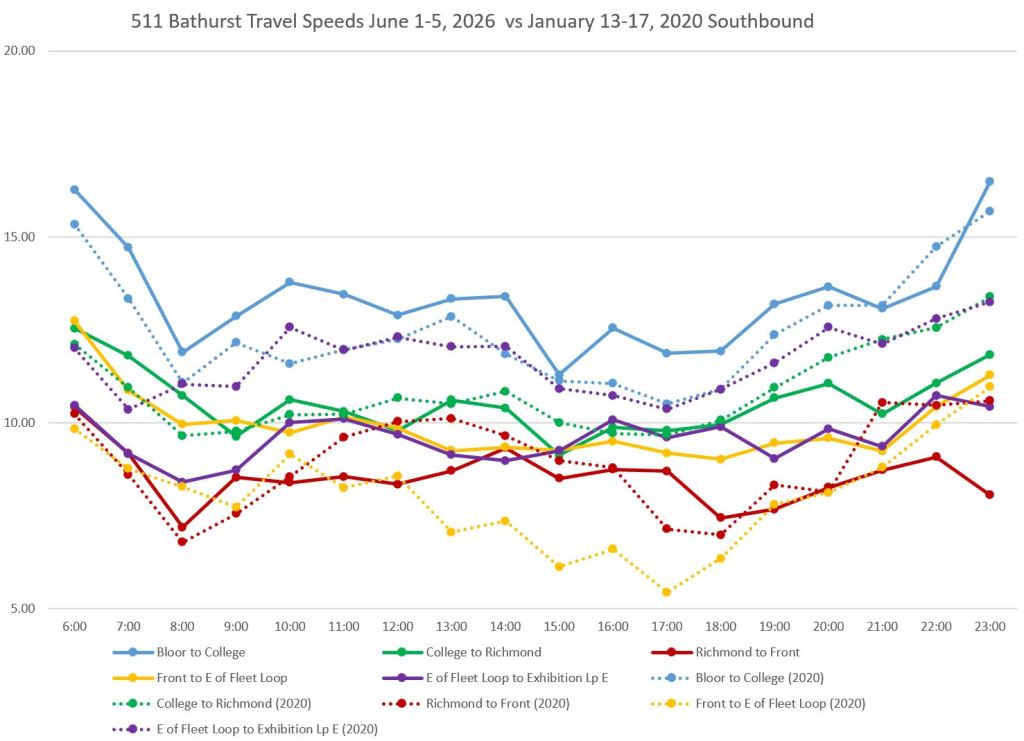
Some segments of 511 Bathurst have faster travel times in 2026 compared to 2020 likely due to the red lanes, although this is not consistent over the day:
- Bloor to College, both ways (blue)
- Front to east of Fleet Loop, both ways (yellow)
Detailed Speed Profiles
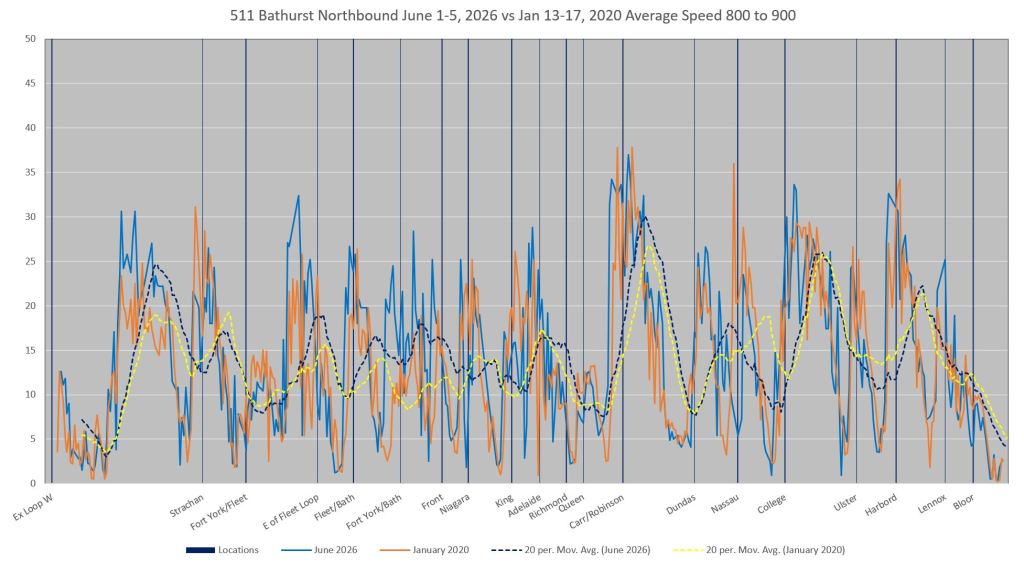
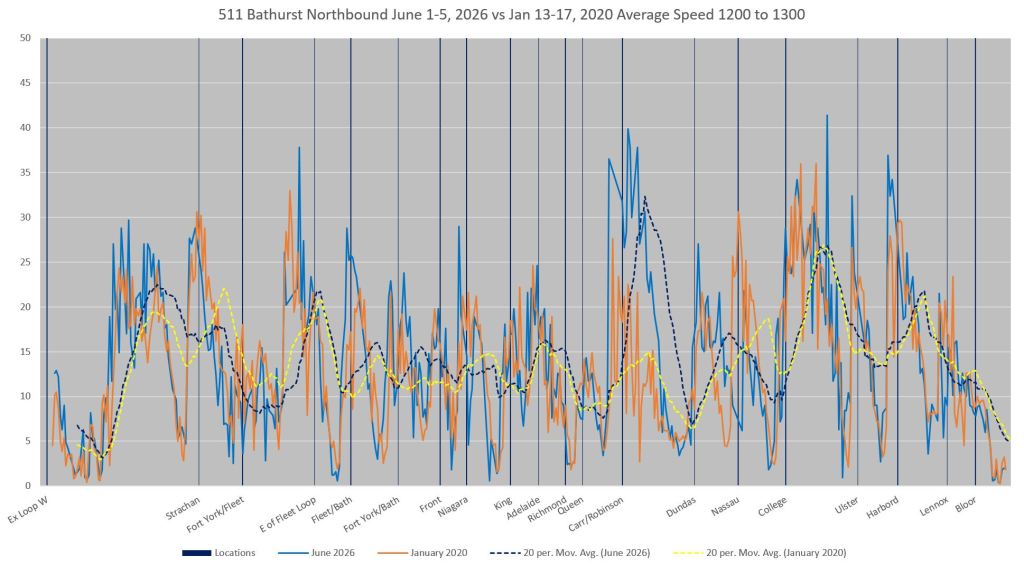
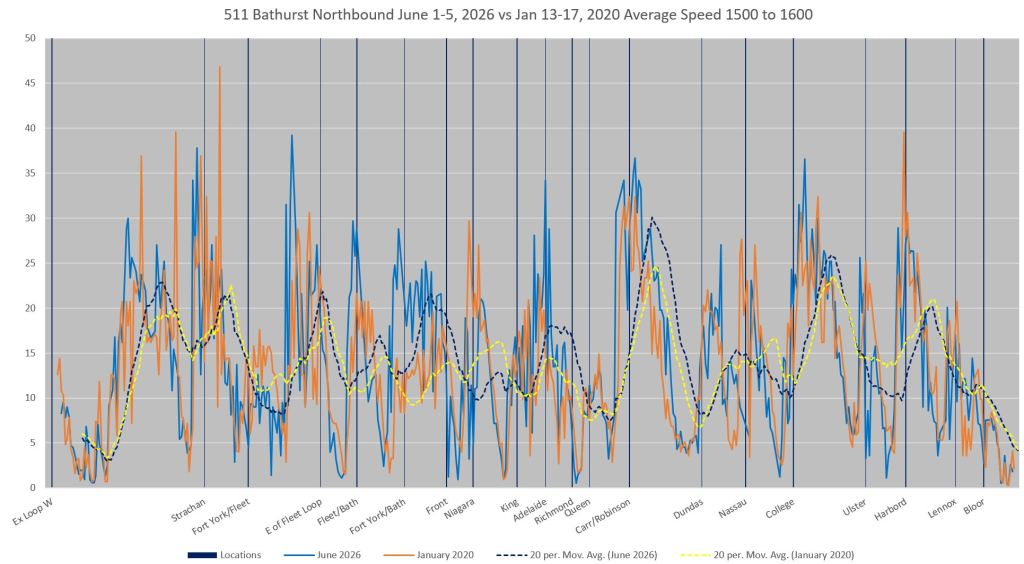
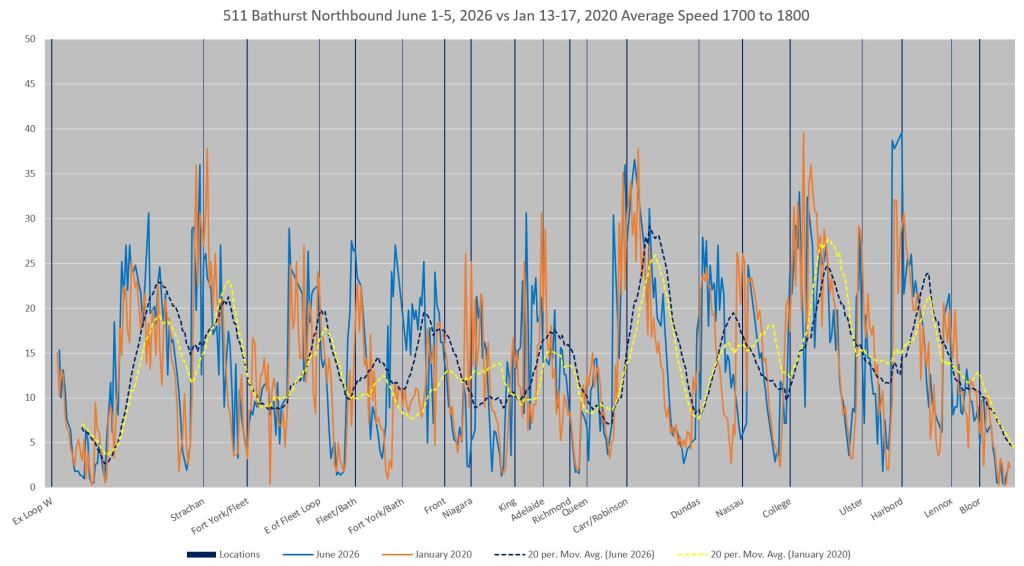
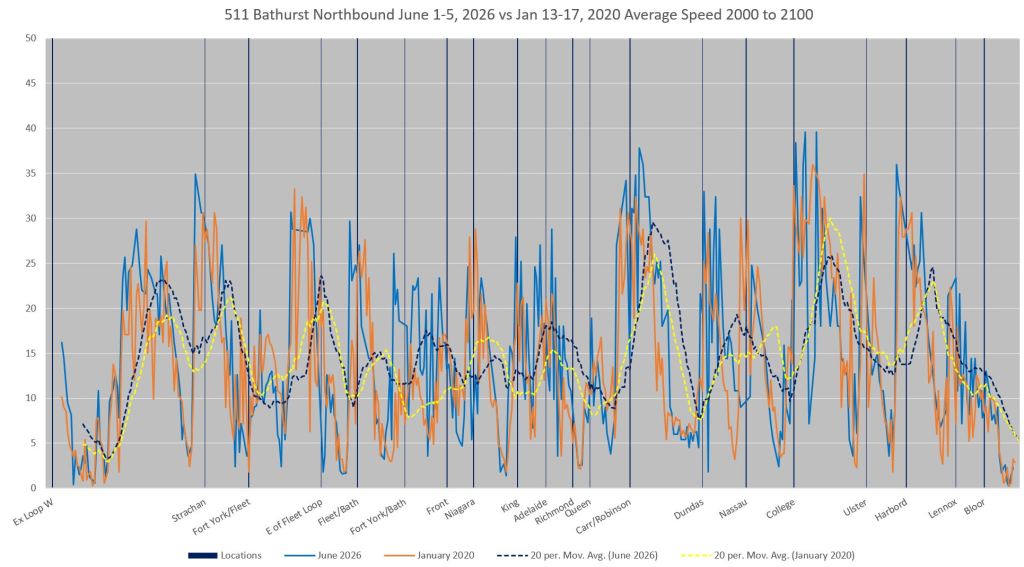
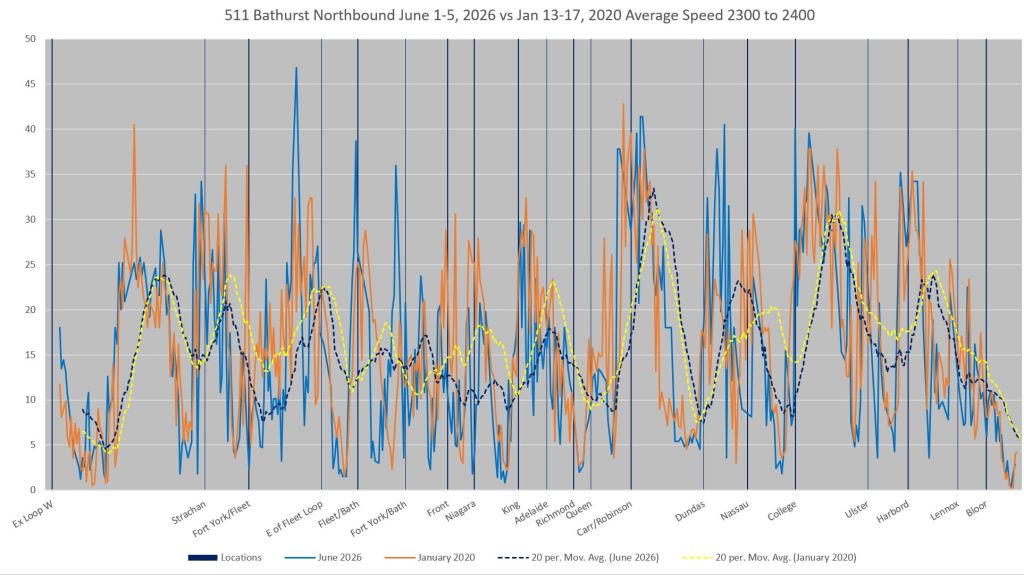
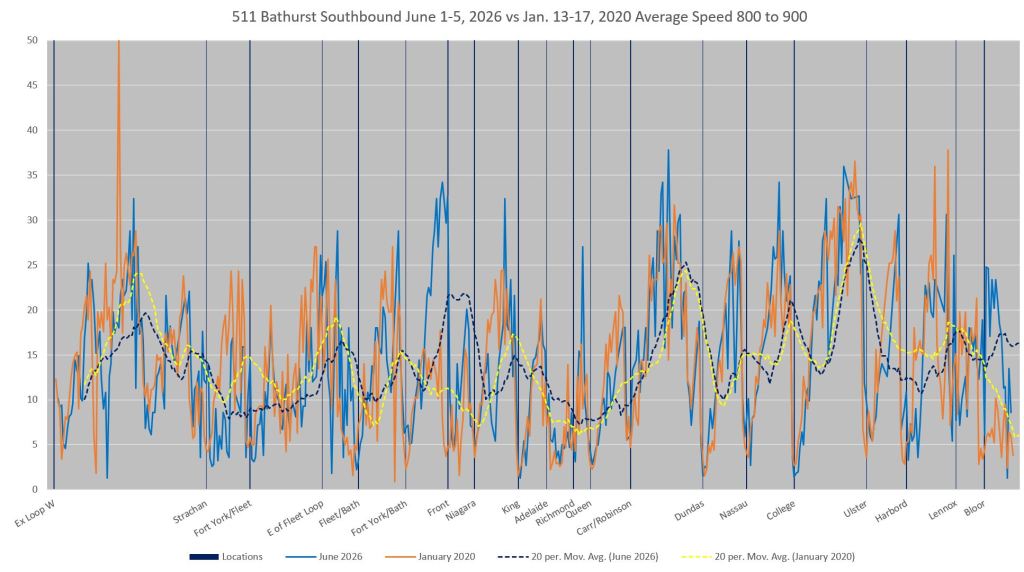
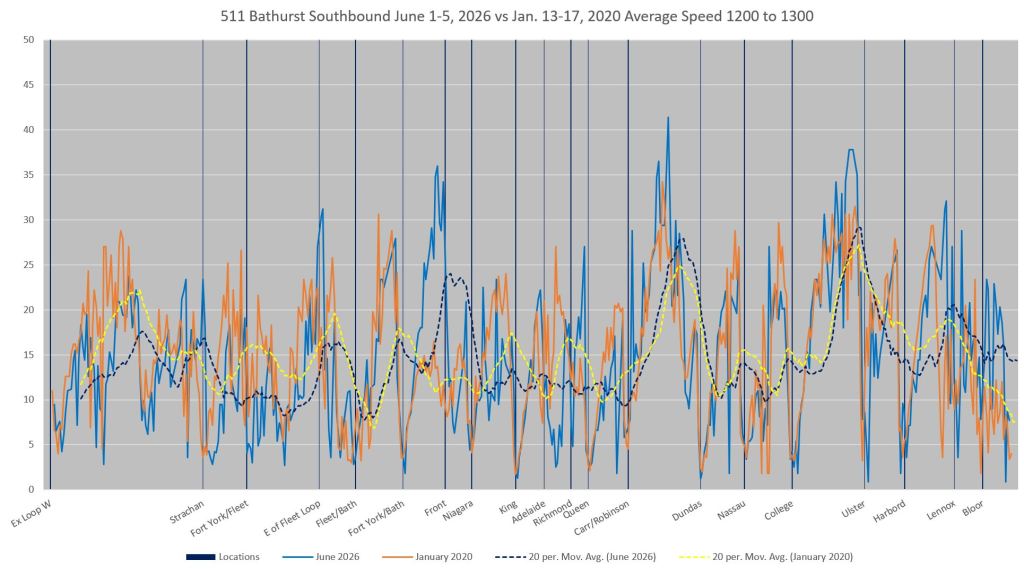
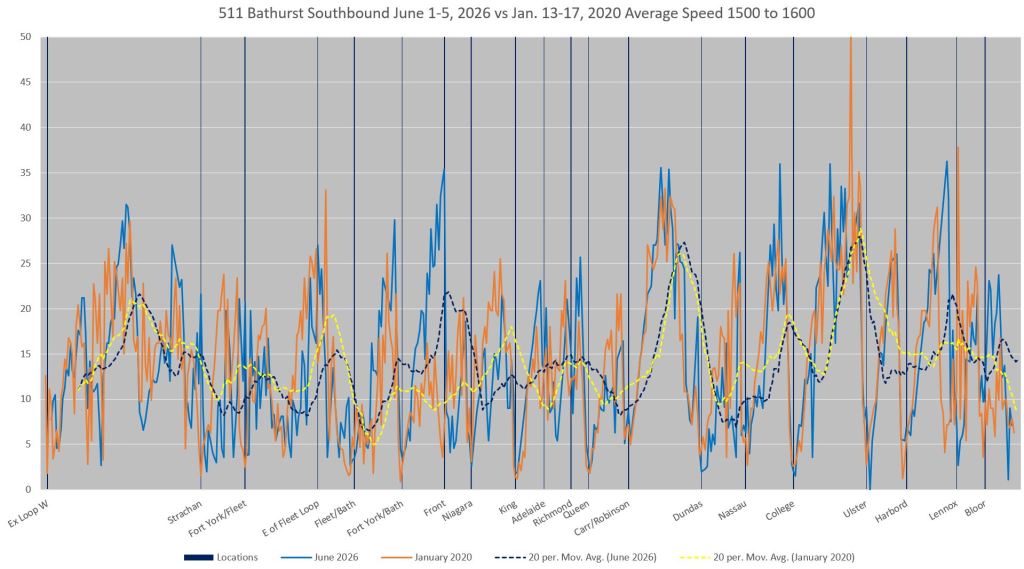
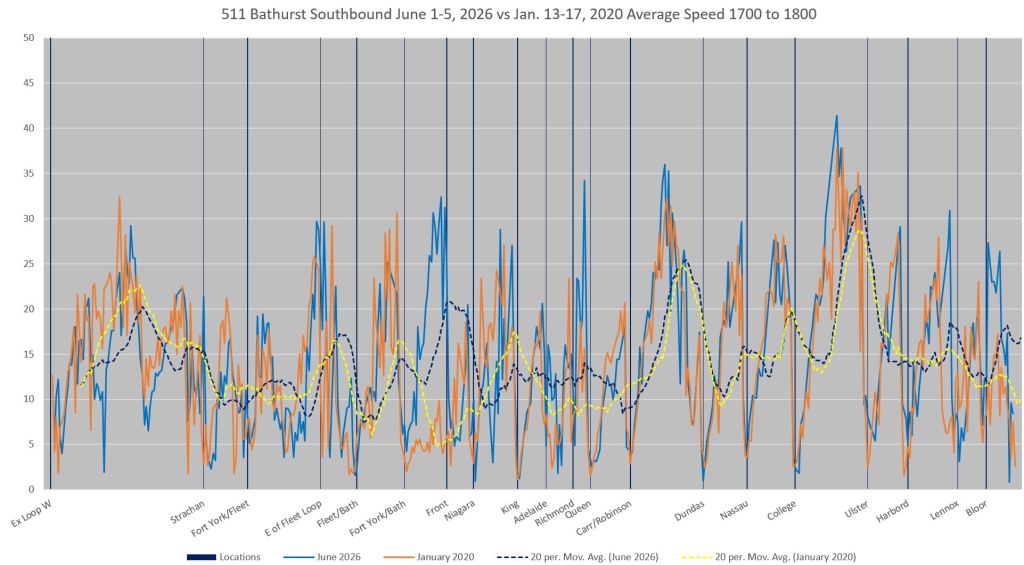
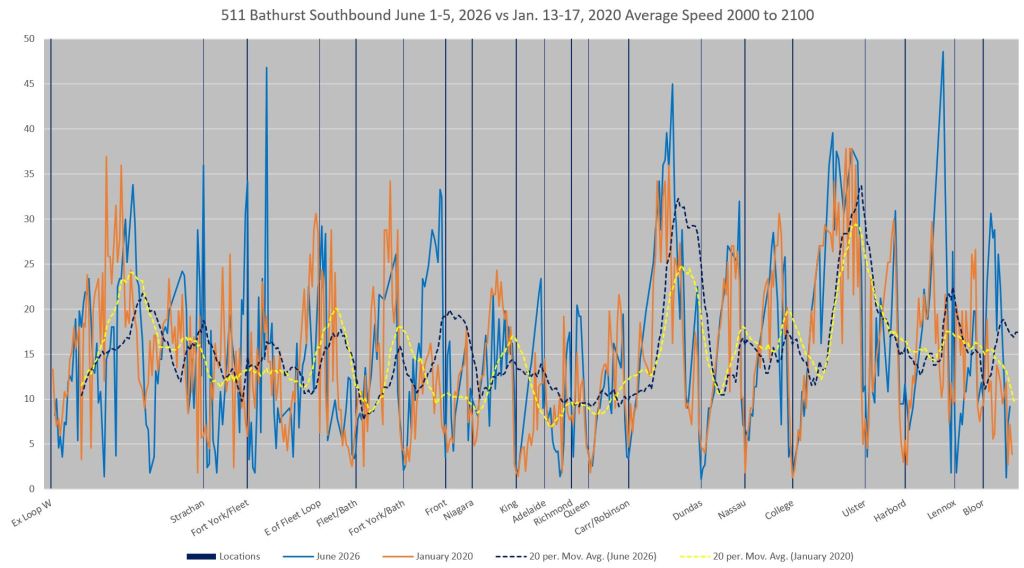
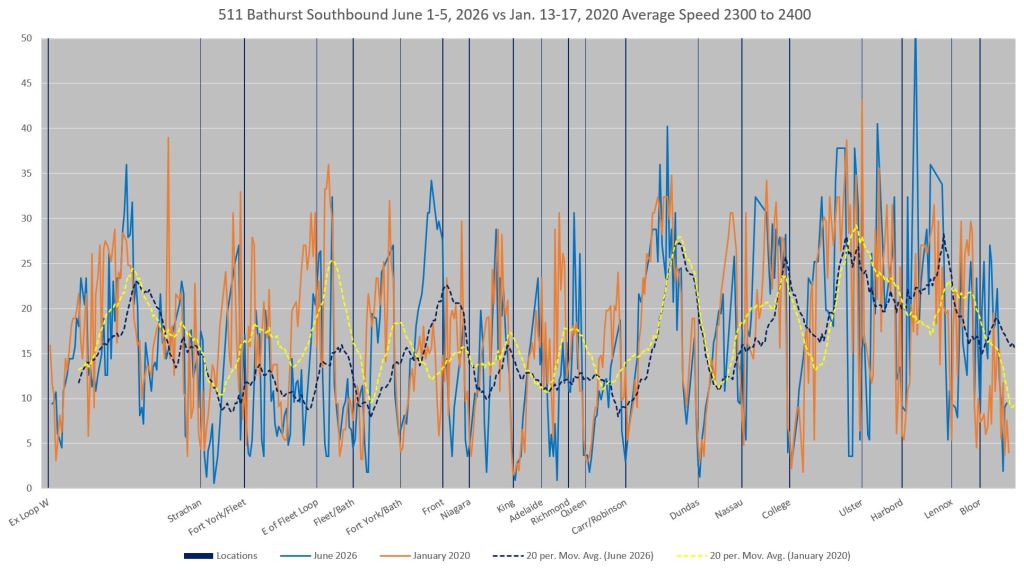
In the segment chart above, the area from College to Richmond is treated as one unit, but there are no red lanes between Nassau and Dundas, and so the effect is mixed measured over that distance. The detail charts below show improvements in speed:
- Between Bloor and College
- South of Dundas to Robinson (north of Queen), but more so northbound than southbound.
- Between King and Queen, but only in the afternoon and PM peak.
- Between Fleet and Niagara northbound
- Between Niagara and Front southbound
Northbound
Southbound
Dwell Times
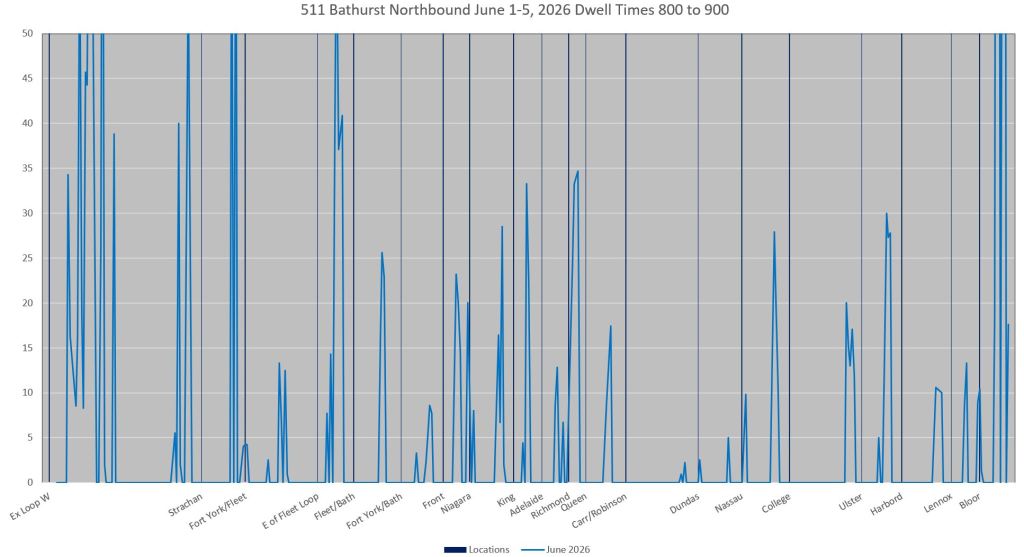
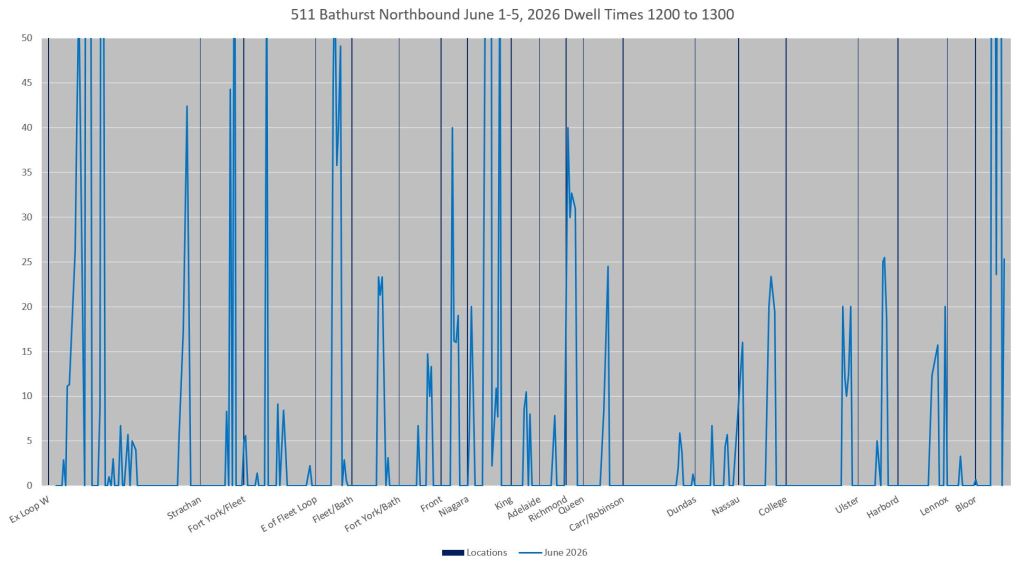
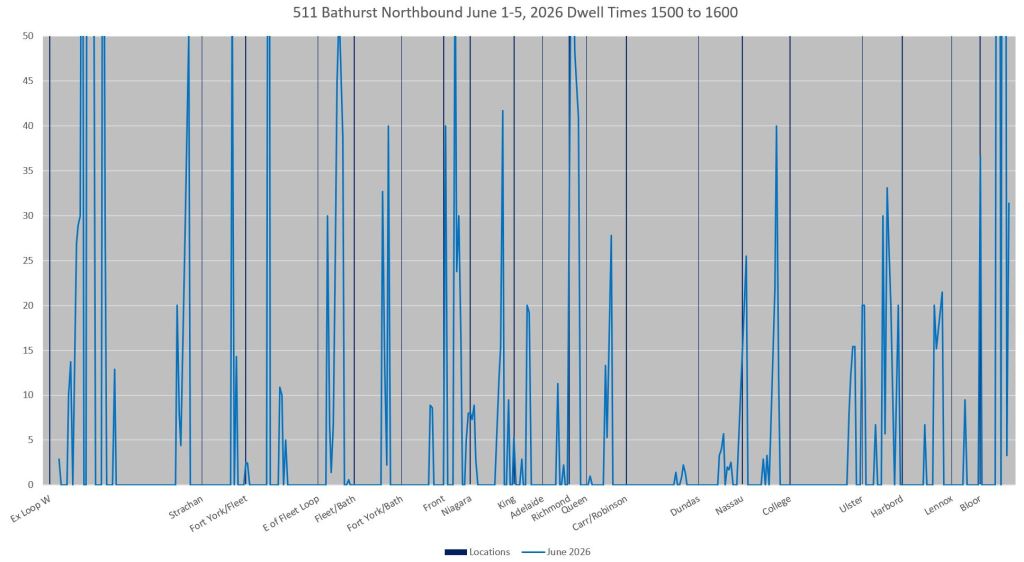
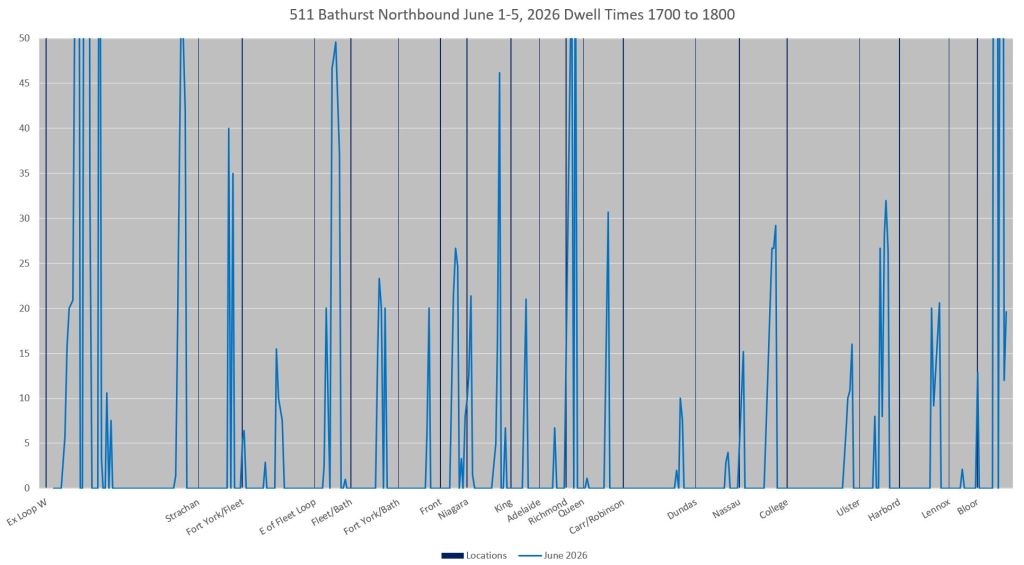
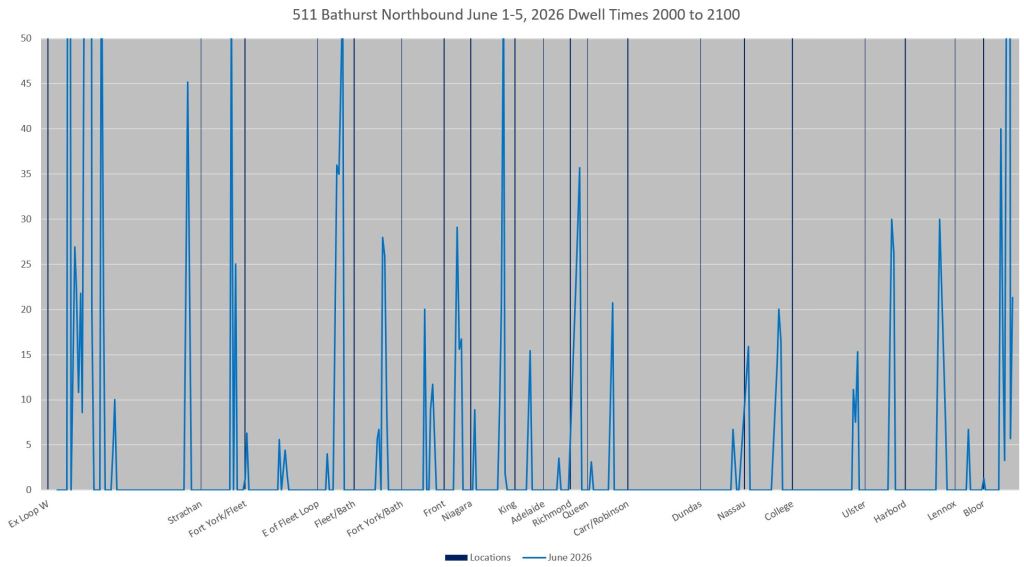
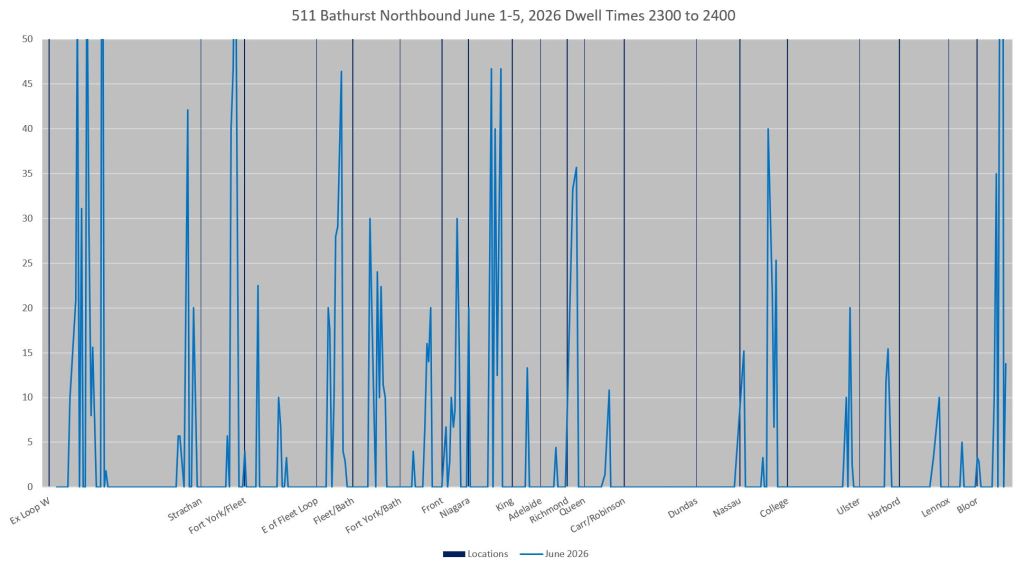
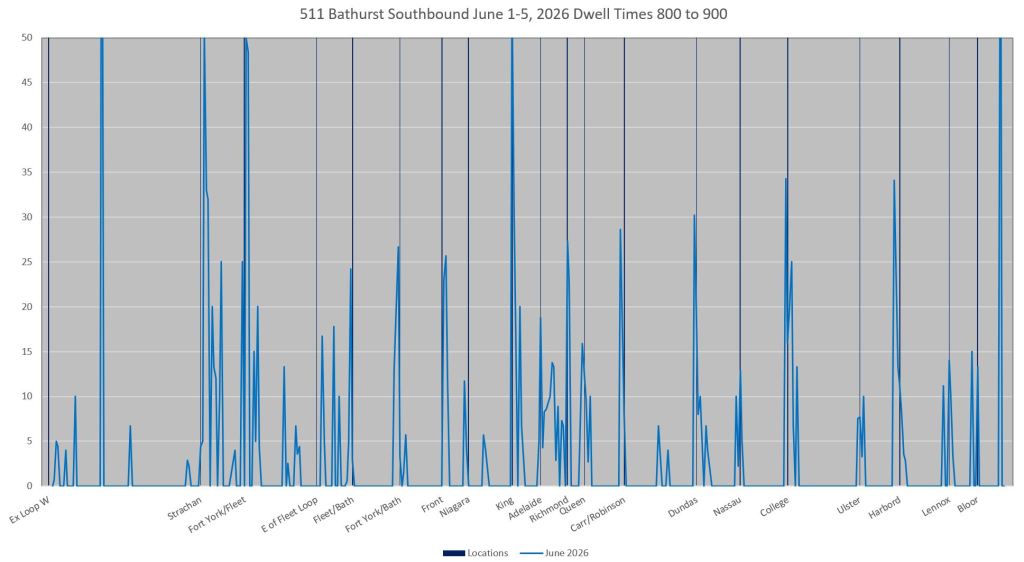
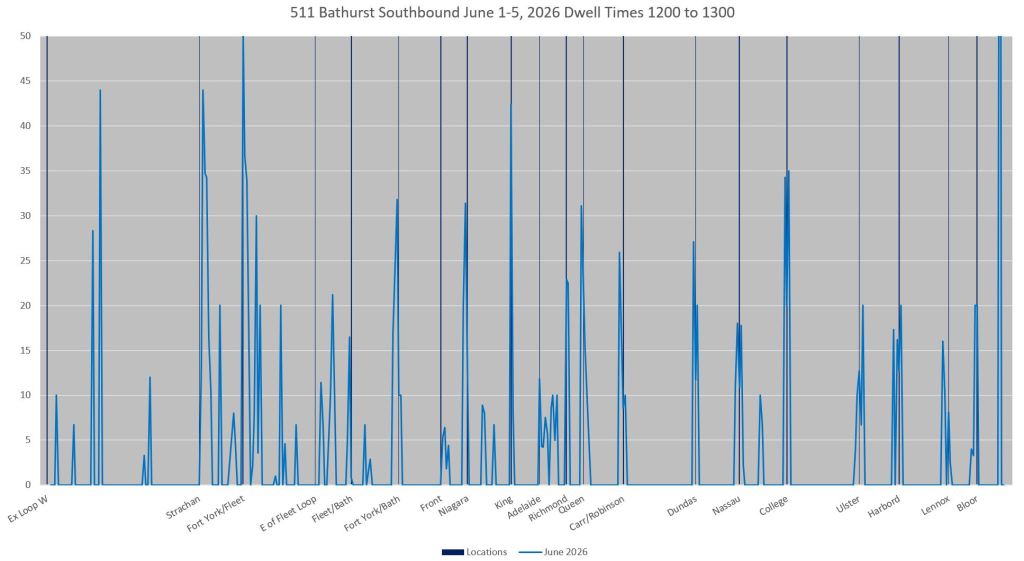
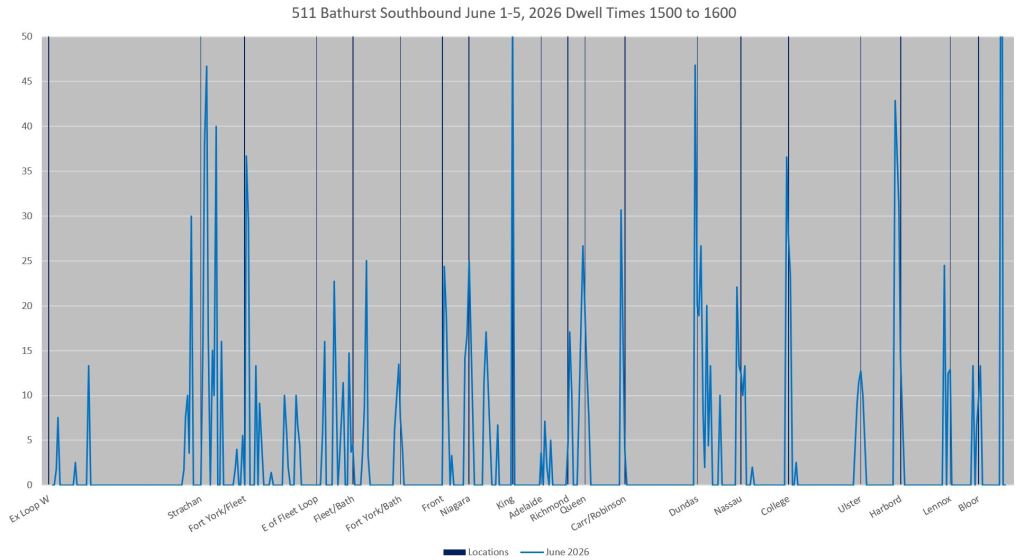
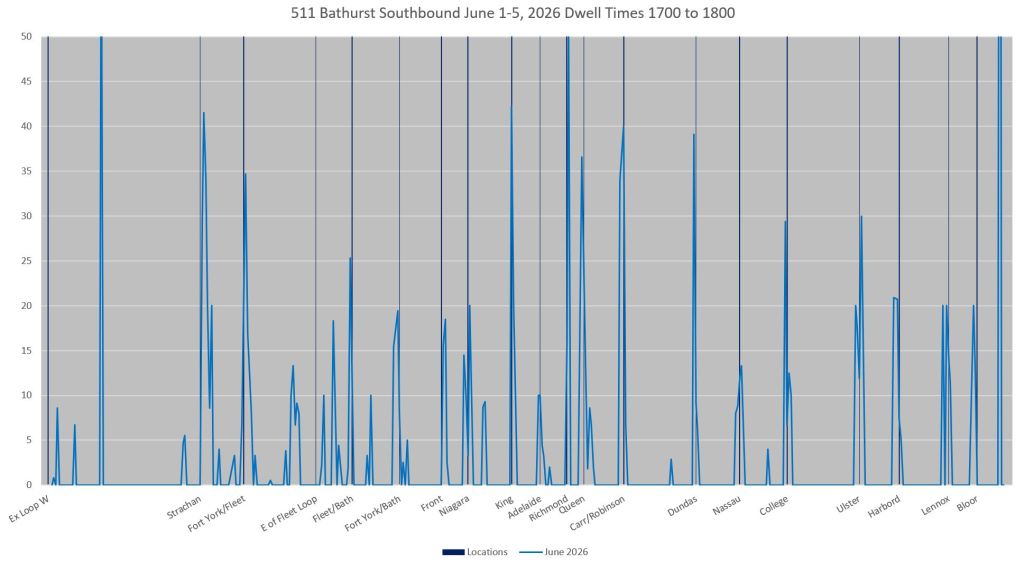
The charts in this section show locations where streetcars spend time sitting for some reason: loading passengers, waiting for traffic signals, waiting for the road to clear in front of them. Where there is a backlog of traffic (or streetcars), these can show up as a cluster of peaks because streetcars have to inch up to their stop or to an intersection. This area requires study to determine why streetcars in what should be a priority area are delayed so much and in so many places.
Northbound
There is a notable difference in charts of northbound dwell times north from Queen with fewer and smaller peaks, although these do grow in the afternoon and PM peak. Many locations south of Queen on Bathurst and along Fleet show cars being held, and some of these are not at transit stops. Although this area is substantially red or reserved lanes, streetcars are held there regularly.
Fleet and Bathurst eastbound shows delays with queuing effects (the spike in dwell times is spread out on the approach). This implies problems with streetcars on 511 Bathurst and 509 Harbourfront having inadequate priority to make their turns north or south onto Bathurst. It is also an example of the problem of the lead time for route selection which would call out any priority signal.
Southbound
As with the northbound service, delays and long dwell times are more common south from Queen and along Fleet Street.
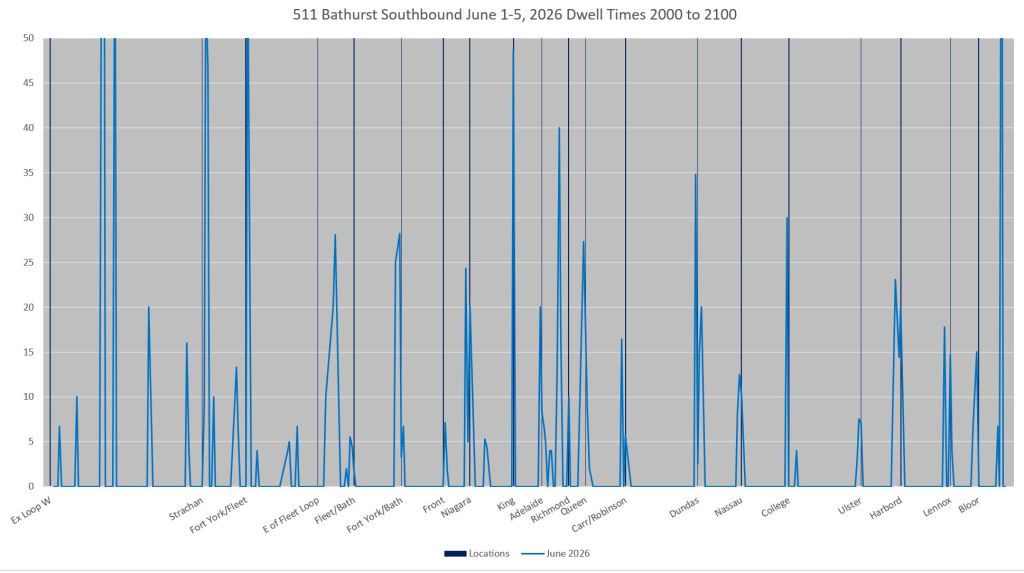
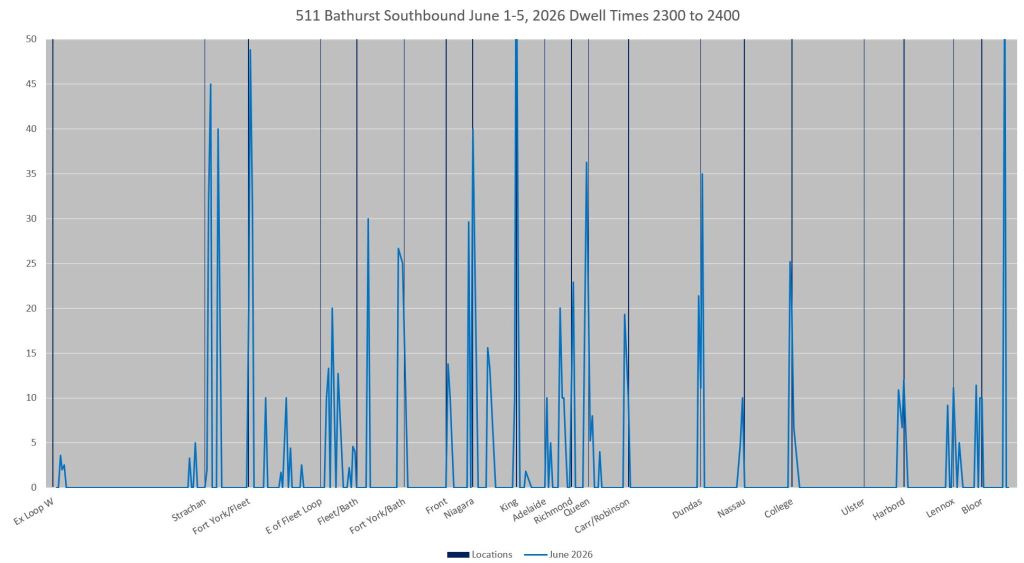


I use this route occasionally and find the wait times for streetcars to get in or out of the grounds at Strachan are ridiculous. The signals are setup with heavy priority to get cars in/out of Liberty Village and off/on to Lake Shore, and they don’t seem to differentiate between day and night. 3 minutes of green time for Strachan on a Sunday at midnight, and the streetcar has to sit and wait through all that while zero cars pass by.
Steve: Yes those long waits show up in the dwell time charts, and they put the lie to claims that transit priority is in place all along 511 Bathurst.
LikeLike