
When John Tory became Mayor of Toronto in the 2014 election, he quickly discovered that his transit briefings as a candidate were far from the truth. Service deteriorated under Mayor Ford, and although Tory opposed a plan to increase bus and streetcar service during the campaign, he had a change of heart. The then-new Mayor supported the purchase of more buses and a partial restoration of service standards, notably those affecting off peak service.
What has happened between the start of 2015 and fall 2017?
Over the past three years, TTC ridership growth has levelled off and is dangerously close to slipping into decline. Many factors are cited, including the “do nothing” option of “every other city is losing riders so we’re no different” approach. That is not exactly a call to restore riders’ faith in the TTC.
An important issue is the question of actual service levels. Looking at the service budget and actual operations, one might get the impression that service is growing.
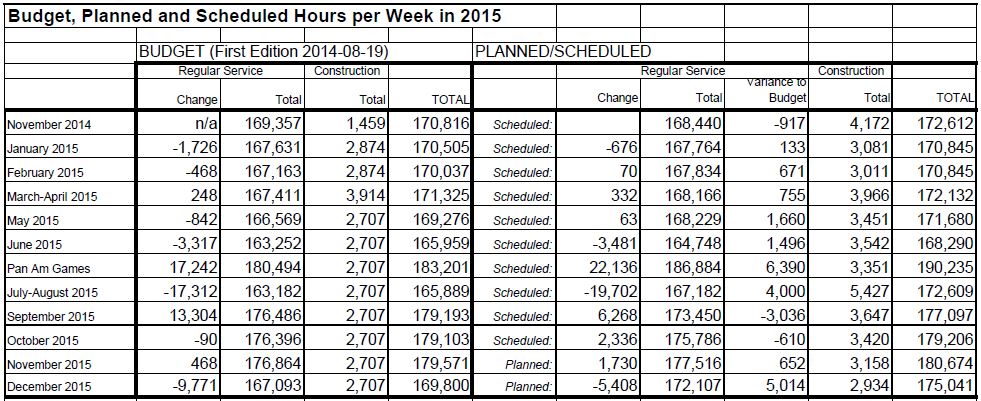

The budgeted service in 2017 is higher than in 2015, but the details are important:
- The budgeted regular service in 2017 is only slightly higher than in 2015. For September, the budget is 2.1% higher in 2017. However, not all of the planned increase was actually operated in response to the ridership numbers and budget pressures.
- More than half of the total increase in service hours is due to construction, not to actual improvements.
One can argue that without the extra construction service, riders would have even worse service than they do, but this does not change the fact that regular service has improved very little over three years.
This can be seen in detail in the chart linked below which compares peak headways (the time between vehicles) for the January 2015 and September 2017 schedules.
The bus changes summarized in pie form show the breakdown.


The total number of buses in service during peak periods is up from 2015, but this is entirely due to substitution of buses for streetcars either for construction projects or to offset the late delivery of Flexity cars from Bombardier.

When the total count of buses in service is adjusted for vehicles running on streetcar lines, the AM peak value is down slightly, and the PM peak is up only by 20 vehicles.
This does not account for extra vehicles dealing with congestion delays on the TYSSE project in 2015, nor the Crosstown project in 2017.
On a route by route basis, there are more routes with service cuts in 2017 relative to 2015, or with no change in peak service at all, than there are routes with better headways. Most streetcar routes have service cuts in both peaks.
This is hardly a system that is actively trying to attract ridership with better service and more capacity.
In coming months, the TTC expects to publish an updated bus fleet plan (October 2017) and a Ridership Growth Strategy (November 2017). A fleet plan requires not just buses, but also garages, operators and maintenance workers. Both of these reports will be vital inputs to the Capital and Operating Budgets. Good intentions alone will not bring more service to TTC routes.
An important component of the fleet plan will be the target spare ratio for vehicles. The TTC has increased this value in past years to ensure that its fleet gets the pro-active maintenance required to field revenue service every day. However, adding to spares makes the fleet larger without changing scheduled service.
Absent the details of coming budgets, it is unclear how much provision, if any, has been made for substantial service improvements. Capital subsidy programs such as Ottawa’s PTIF (Public Transit Infrastructure Fund) may let Toronto buy more buses, but if Toronto Council will not fund the operation and maintenance of the added vehicles, then this is nothing more than a make-work program for the bus builders and a way for the TTC to retire much of its fleet sooner than planned.
There is an inherent dishonesty in many transit funding announcements because they address only the initial cost of provisioning vehicles and building infrastructure, not actually running and maintaining them. The TYSSE alone will add about $30 million (net of new revenue) in costs to the TTC’s budget, and it is far from clear whether they will receive added subsidy, or be forced to trim service elsewhere to handle this. (Part of the increase was already digested in the 2017 budget as startup costs for the new subway, but most of the cost hits in 2018.)
Meanwhile, Bombardier is supposed to ramp up streetcar deliveries this fall reaching 7.5 cars/month by October. As of September 24, the second “September” car, 4446, is about to leave Thunder Bay, and it is clear that Bombardier will not make the target of four cars for this month (ending with 4448). It is hard to believe that they will actually ramp up to a much higher production rate, and this threatens service quality on both the streetcar and bus networks. Even if Bombardier does begin to deliver at the planned rate, there remains the question of whether the TTC will restore streetcar operations on all routes, or continue to retire older cars.
The TTC faces several difficult years in a political environment where added spending on transit operations will be hard to achieve in the face of “tax fighting” politicians. The one product they are selling is service. Without real improvements, not just marketing flim-flam, the TTC will lose political influence and, with that, the funding they so badly require.
Sources:
- TTC Scheduled Service Summaries (copies available on this site)
- TTC Service Planning Board Period Memos

I see from the Bank of Canada’s inflation calculator that the cumulative inflation from 2015 to 2017 is 2.5%. So in real dollars, this is actually a budget cut of 0.4%.
Steve: Don’t forget that the budget numbers are for scheduled vehicle hours of service, not dollars. Therefore inflation does not apply. However, if overall congestion goes up by, say, 1%, then a given number of hours translates to less service because the vehicles are more stretched out in time, if not in space.
LikeLike
I have been collecting the Service Summary since 2004 and some time ago I started graphing the change in number of surface vehicles by service period from one month to the next Seeing the service levels graphically makes it easier to see trends in how much service is on the road at any given time of the day.
One interesting thing is that you can see differences between different administrations at City Hall. You can see the effect of the RGS on growth in midday service levels in the first Miller Term; a growth in peak period service in Miller’s second term, along with a big jump in late evening and Sunday service associated with making all routes run all day, every day. You can see service levels almost literally flatline for the first half of Ford’s term (plus a drop in late evening service on Saturday/Sunday), then you see service growth resume somewhat at most times of the day in the second half as Ford lost control of Council.
Tory’s part of the curve has been mixed. There was an increase at most off-peak times, including weekends, in his first year, and at most times it was somewhere around (rough ballpark) 100 additional vehicles on the road. After his first year service levels have largely plateaued. Peak period service is actually mostly lower than what it was in Ford’s last year, although PM service has rebounded.
One other interesting thing to see when comparing March 2004 against September 2017 is that service growth is quite a bit different depending on the time of day.
– peak period service has only gone up 14% (AM) to 20% (PM)
– midday, early evening and Saturday service has gone up roughly 40-60%
– late evening and Sunday service has gone up 75% to 100%
Great news in terms of making transit more frequent and thus more useful and more attractive in off-peak times, but not so good news in terms of capacity growth in the peak periods.
(In fairness, it is possible that part of the recent plateau (or decrease) has been related to the introduction of larger vehicles (the Flexitys; the Nova artics) offsetting a reduced number of smaller vehicles, so that even if the number of vehicles on the road is the same, the actual capacity being operated is greater.)
Steve: But the addition of a relatively small number of artic buses is offset by the capacity loss of the move from high floor to low floor buses.
LikeLike
Responding to Brent’s post, how useful is it to look at percentage increases? I would expect to see a big percentage increase in late evenings and Sunday service, because when there are only two buses out, a third is a 50% increase (and if there are no buses out, it’s either a 100% or an infinite increase, depending on how you do the math). It would be a lot harder to get a 50% increase in peak period King service — even if the route could actually use that increase.
But I can’t think of a more useful statistic to use. 😦
Steve: A better than 50% increase in King service would be achieved by changing out all of the CLRVs with Flexitys, but that’s over a year away, and there is no guarantee that the TTC would preserve a 1:1 ratio of new:old cars. Meanwhile, ALRVs that are supposed to be on Queen run on King, leaving CLRVs on Queen to attempt to handle demands of ALRV headways.
LikeLike
What is the capacity of tandem wheeled buses compared with regular wheeled buses? Two smaller wheels instead of the one large wheel in the front. It may allow easier access for the SUV baby strollers and provide more seats.
LikeLike
I believe, but am not certain, that the smaller diameter wheels would increase the friction and possible also the pressure on the road surface. Thinner wheels, one behind the other, would lengthen the wheel well by a large amount but would not make it that much thinner because there has to be room for the wheels to turn. There is also a limit as to how thin the tire can be,
LikeLike
Steve said: “Don’t forget that the budget numbers are for scheduled vehicle hours of service, not dollars. Therefore inflation does not apply. However, if overall congestion goes up by, say, 1%, then a given number of hours translates to less service because the vehicles are more stretched out in time, if not in space.”
The question would be, to what degree has the cost of congestion increased? It would really seem we need an equivalent of CPI (or PPI or GDP Deflator) for transit service and congestion, However it is hard to believe the rate of increase time lost to congestion would be as low 1%. I would suggest to you, that it seems that the time lost to congestion in Toronto, has at least doubled in the last 25 years (at least at peak), which would imply a compound rate of around 2.8%. I would suggest that there is a real need for such a deflator as part of public discussions to anchor the discussions of transit service changes required, and also to guide the need for rapid transit corridors (the implied longer term impact of a rate of 1% vs 3% would be massive, although nearly invisible in terms of the frog in the pot). If you need to increase the number of transit vehicles on the road by nearly 3% to simply maintain service levels, without increasing ridership, is would help clarify what needs to be done, where and when. The impact on other traffic of improving transit speed would then factored back in. The reality that a bus moving in a transit corridor would increase its speed from 19kph to say 45kph, would also alter the number of vehicles required to deliver service, while making said service radically more attractive, which of course would make driving less painful for those who still could not practically use transit.
Steve: It is not physically possible for a surface transit vehicle to average 45kph and actually stop now and then for passengers. The subway manages to cover Eglinton to Finch in about 10 minutes, best case with a train in “highrate”, and that’s 8km, ergo 48kph. The normal scheduled speed is for a 12 minute trip, or 40kph. Surface routes have far more stops, not to mention cross-streets as well as designs and boarding procedures that make for slower turnover than subway cars.
Getting just from 19kph average to 25kph would be a huge jump because many parts of routes have no scope for improvement. Your assumption of time lost to congestion as doubling is way off the mark for a few reasons. First off, system wide hours include a lot of travel outside peak areas and in counterpeak directions. The “bad” section of a route may worsen, but this does not apply to the entire round trip. Even if congestion in such an area doubles, the route as a whole does not require twice the resources. What you are talking about is the perceived convenience and speed of transit, but this is not the same thing as the amount of resources required to operate it.
The reverse view of this will affect the King Street pilot. The changes will only affect the central part of the route, not the section through Parkdale and on Roncesvalles, nor through the St. Lawrence neighbourhood and on up Broadview. Therefore a 10% improvement in the route overall requires a huge improvement within the pilot area that is simply not attainable.
A further factor is that on some routes the TTC has been padding running times (slowing down the service) to reduce short turns. This artificially reduces the scheduled speed (and leads to streetcars dragging their butts across the city to avoid being early) especially during periods when there is no congestion to soak up the extra time. Reducing the scheduled speed, but not changing the number of vehicles, affects the scheduled headway, but not the number of scheduled vehicle hours. One must take care making comparisons like this, and the way the TTC presents its operating stats doesn’t always help.
LikeLike
I would note that within a BRT, it would be possible for some of the vehicles to operate in an express service, over longer routes, where the speed is more critical. I have to say, however, I was focusing nearly entirely on the impact on peak not average services. Yes 45 kph would be an extreme, however, it was to illustrate the impact on long routes, that could also offer express service (ie stops only every couple of kilometers, and really good signal priority), and well, yes even at that, it would be very fast.
Steve: And most riders are not travelling end to end over a long distance. I really get tired of hearing about absolute best case examples that do not match actual travel patterns. This discussion arose from a question of scheduled hours of service on local TTC routes.
LikeLike
Malcolm, if you search the TTC’s website, you can find service summaries. These include scheduled average speeds for every route.
The current one is this.
The 192 manages to make up to 51.2 km/h scheduled average speed. But even the York U express only manages 25.2 km/h tops — oddly enough, on the Sheppard (not west) to York U run, not the Sheppard West to York U run.
As for congestion, you can see how scheduled speeds increase in off hours.
The Bloor night bus is scheduled up to 30.4 km/h. That’s competitive with the subway at all times, and actually faster than at peak periods. But keep in mind that the bus is not on the same routing as the subway.
Steve: Several years’ worth of summaries are available on this site under the “Reference Material” tab.
Re the night service: That’s the average speed over the entire route. It will not operate at that speed in the busier downtown segment where it has to stop frequently and serve more passengers.
LikeLike
Given that Bombardier has once again failed to deliver on it’s unilaterally watered down targets, it is time to cancel the streetcar order. Furthermore, Bombardier has been shipping unfinished streetcars and their streetcars have been malfunctioning including some on their maiden journeys when they are still brand new. If the mayor does not cancel the streetcar order, then he will NOT get my vote.
Steve: The fourth “September” car is enroute from Thunder Bay (4447). The real test will come when we see what they achieve for October when they are supposed to deliver 7 cars, and November when 8 are due.
LikeLike