Construction on Broadview, Gerrard/Coxwell, Main Station and Queen East (June 2023 Update)

This article describes the transit services affected by various construction project in the east end and the changes that will take effect on Sunday, June 18, 2023. This is a follow-on to my original article, and some of the information there is out of date due to changes in the TTC’s plans.

Information and maps in this article are taken from a presentation to the TTC Board meeting of June 12, 2023.

Updated June 14, 2023: Information about the 304 King Night Bus added.

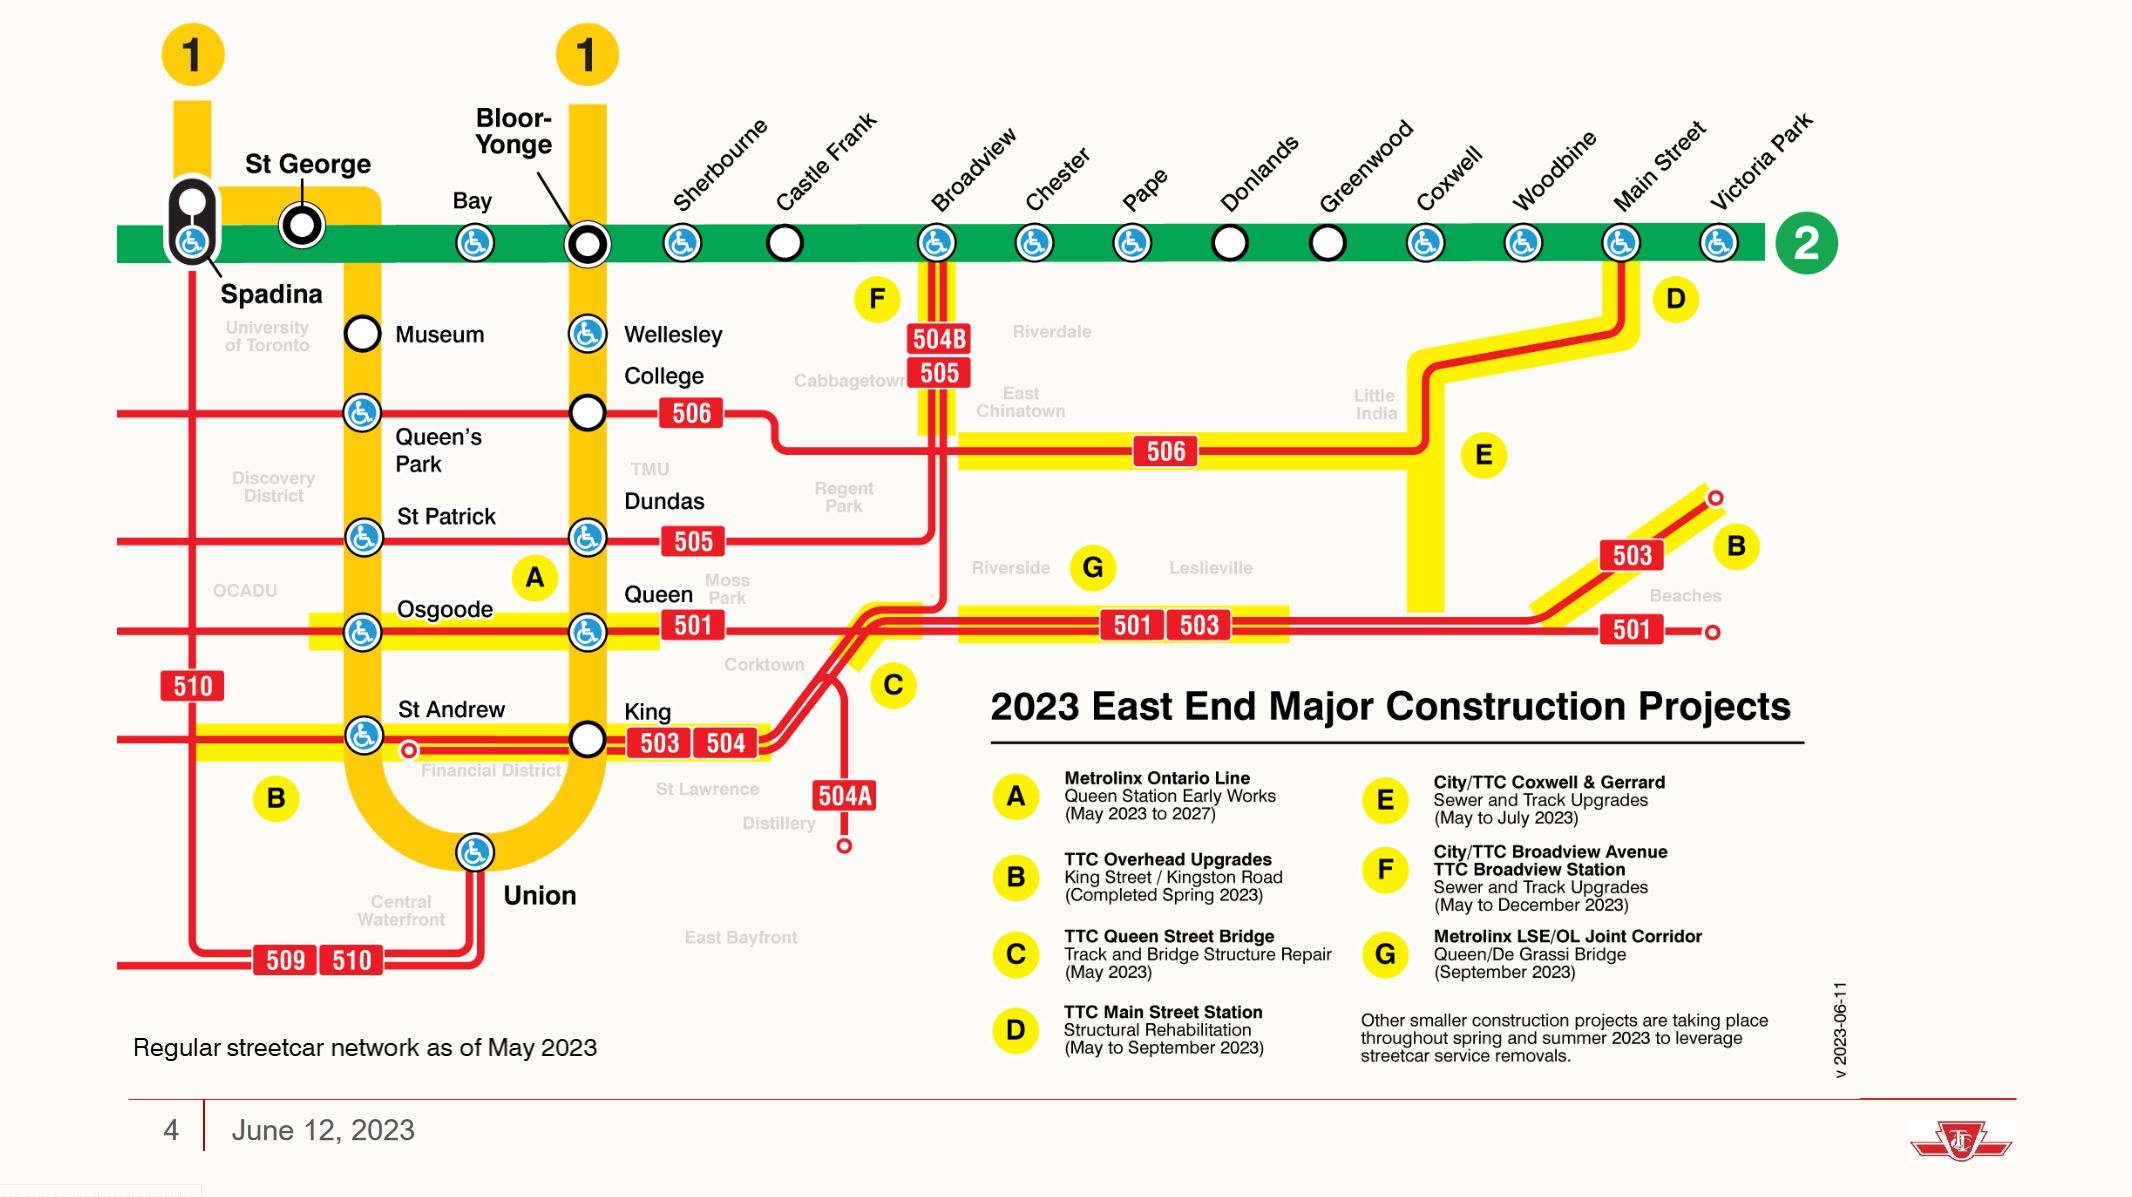
Construction projects affecting streetcar service are summarized in the map below. Some of this work is underway or completed already.

  • TTC overhead upgrades for Flexity streetcar operation with pantographs on King and Kingston Road was completed in the Spring. All routes in the system now operate with pans, although there are selected areas that have not been modified yet and operators must switch to trolley poles if cars run there.
  • Repairs to the Queen Street Don Bridge were completed a few weeks ago, and streetcars are now operating over the bridge, albeit only for carhouse moves and short turns.
  • Repairs at Main Station are underway and will continue through the summer.
  • The sewer work at Coxwell & Gerrard has completed, and work will now shift to track replacement.
  • Sewer work on Broadview is underway.

Changes Effective June 18, 2023

Here is a map showing the route configuration from June 18 to July 29, 2023.

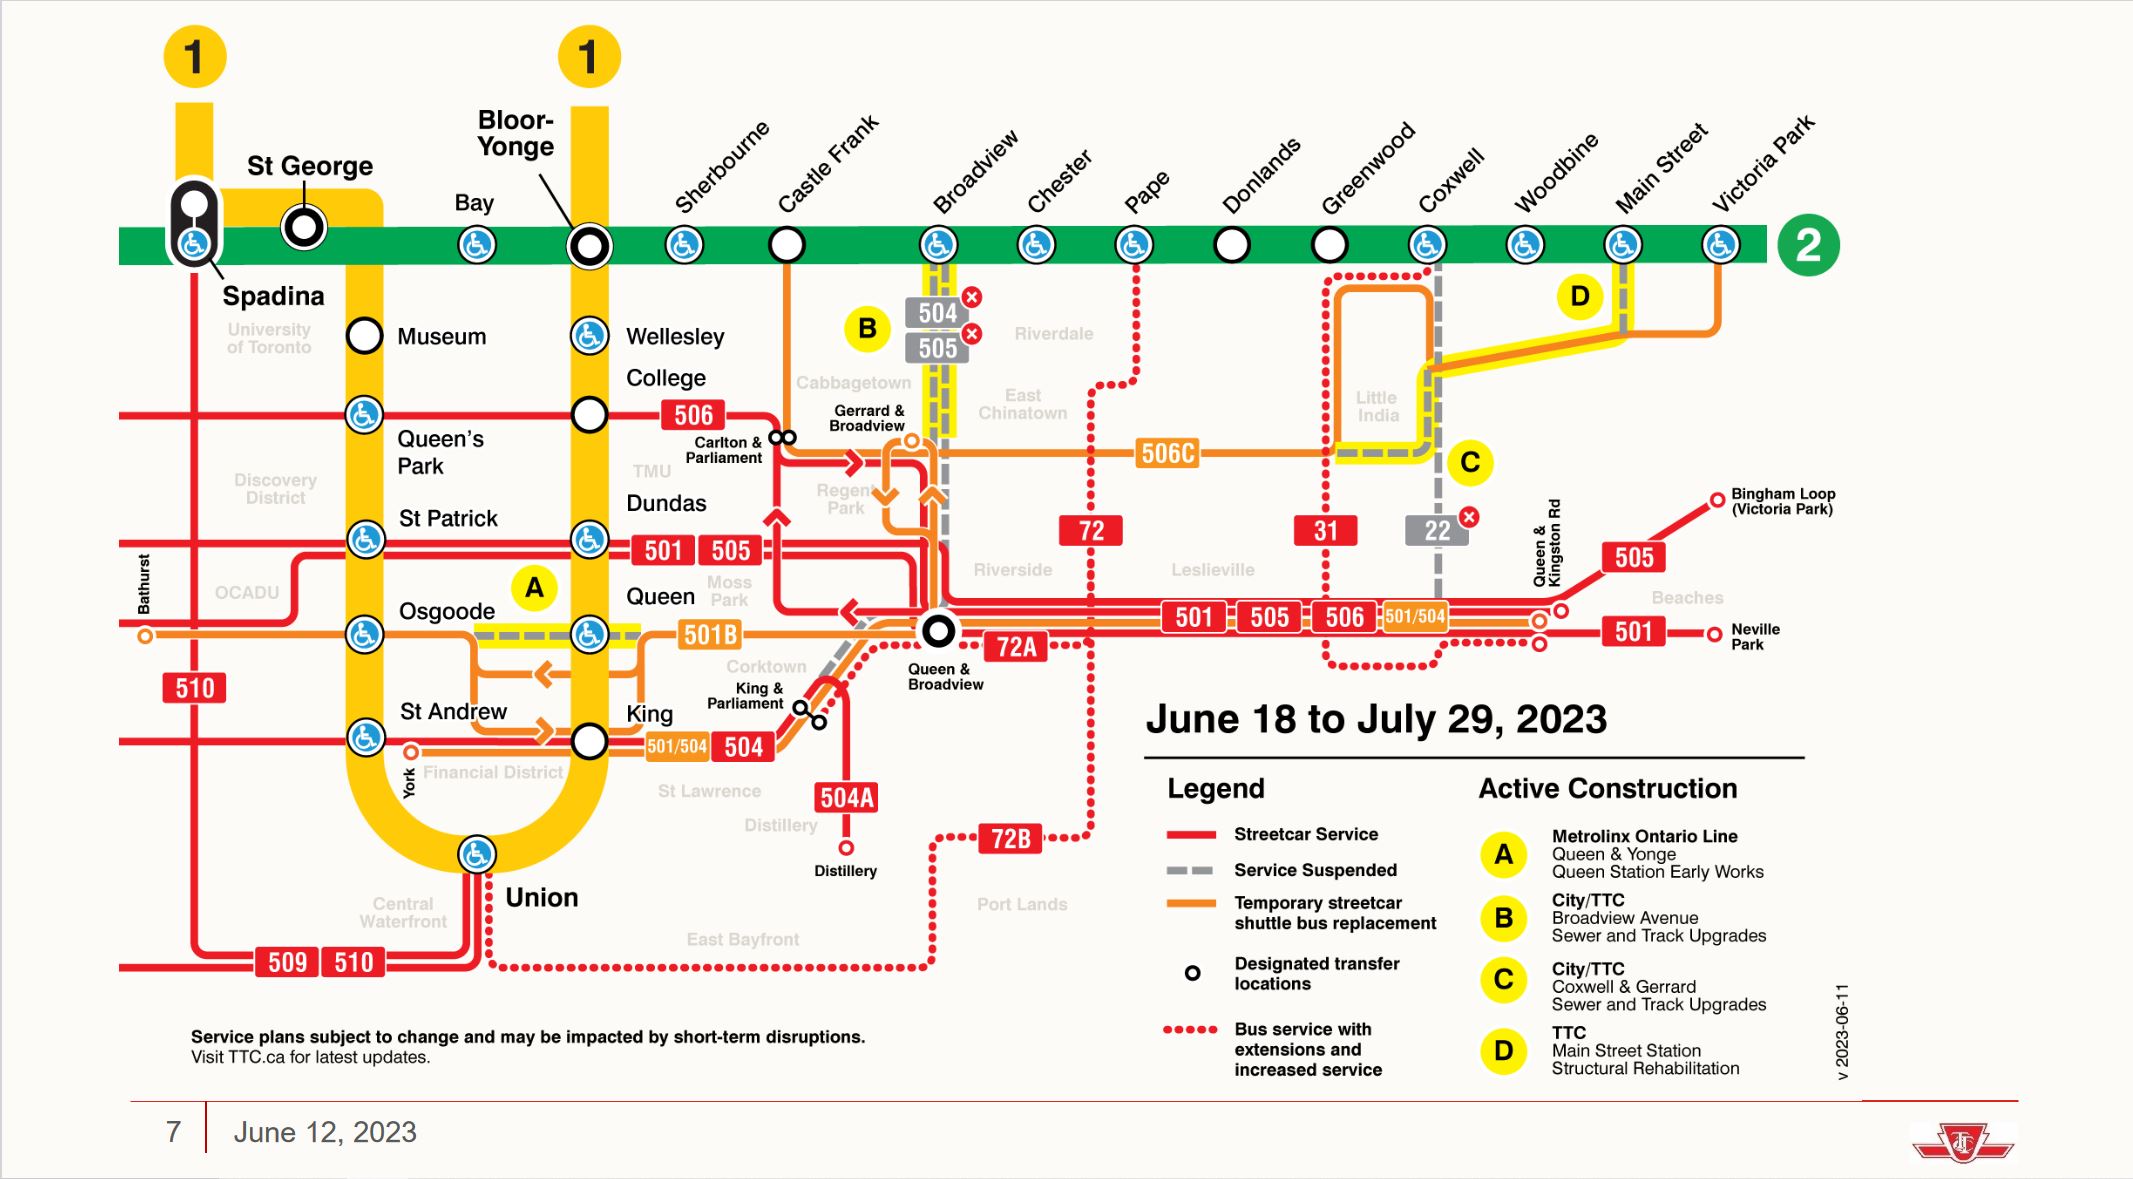
The major service change is that there will be no north-south service on Broadview from Danforth to Gerrard due to track and road reconstruction. Work in this area includes:

  • Reconstruction and expansion of Broadview Station streetcar loop to accommodate two streetcars at a time on both the 504 King and 505 Dundas platforms. The first phase of this (June 18 to early July) will require Broadview to be closed to traffic from Erindale to Danforth for track replacement. Work will shift into the loop in a second phase to allow streets to re-open. The planned expansion of the loop has been deferred.
  • Track reconstruction between Gerrard and Danforth. The first phase (July 4 to early August) will run from Victor to Sparkhall with track storage between Gerrard and Victor. (See maps in the original article linked above.)

The affected routes are:

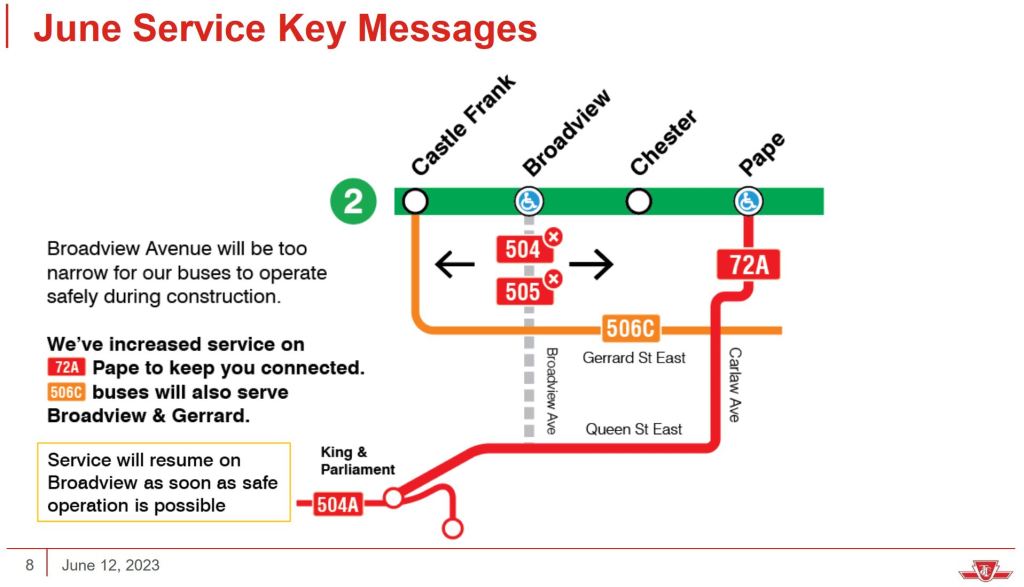
  • 504/505 Broadview/Parliament shuttle bus: This route will not operate and there will be no bus service on Broadview between Danforth and Gerrard and beyond to King & Parliament. This will be replaced by:
  • 72A Pape: This branch of the Pape bus now operates to Pape and Eastern Avenue, but it will be redirected and extended effective June 18 to operate west from Pape on Queen and King to loop as Parliament the way the 504/505 has been doing.
  • The 304 King Night Bus will operate to Pape Station via Queen, Carlaw, Riverdale and Pape.
  • Not shown on the map but also effective on June 18:
    • 100 Flemingdon Park: This route now operates to Broadview Station, but it will shift east to Pape Station effective June 18.
    • 8 Broadview, 62 Mortimer and 87 Cosburn will remain at Broadview Station, but looping arrangements have not been announced for the various stages of construction.

In the previous article, based on maps in a March 2023 presentation regarding Main Station, there was a new route “519” that would split off the west end of the 72B Pape to Union Station service. This proposal is not part of the June 18 package, and the 72B will continue to serve Union Station.

The 501B Queen shuttle bus will be modified to improve its westbound connection with the 501 Queen streetcars. Before June 18, the 501B loops north on Broadview to Gerrard, west to River and south to Queen. This loop will be changed so that buses run south on River only to Dundas, and then return east to Broadview and south to Queen. This will provide an overlap between the 501B and 501 services at Broadview in both directions.

The 501 and 505 streetcars will continue on the same diversions and schedules:

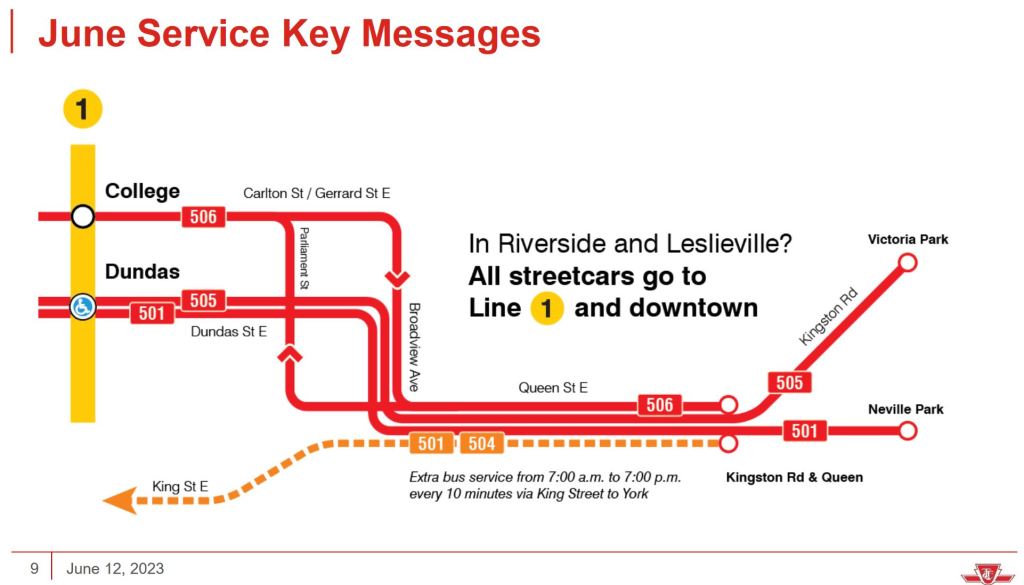
  • 501 Queen cars will operate via McCaul, Dundas and Broadview to bypass Ontario Line construction, and thence east to Neville Loop.
  • 505 Dundas cars will operate via Broadview, Queen and Kingston Road to Bingham Loop at Victoria Park.

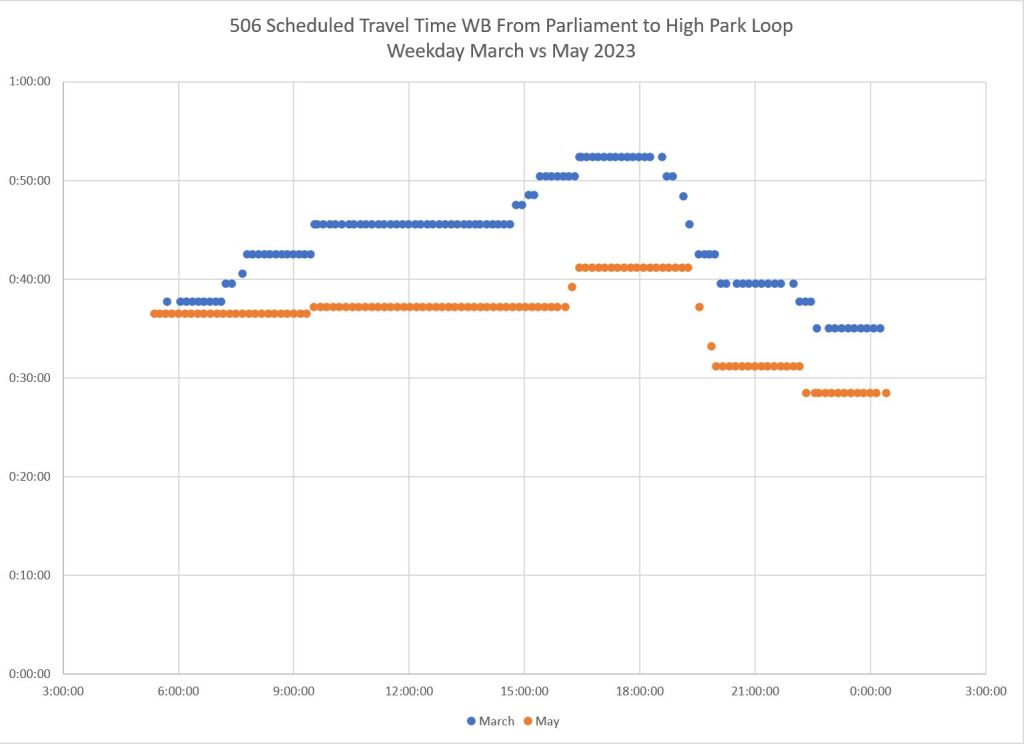
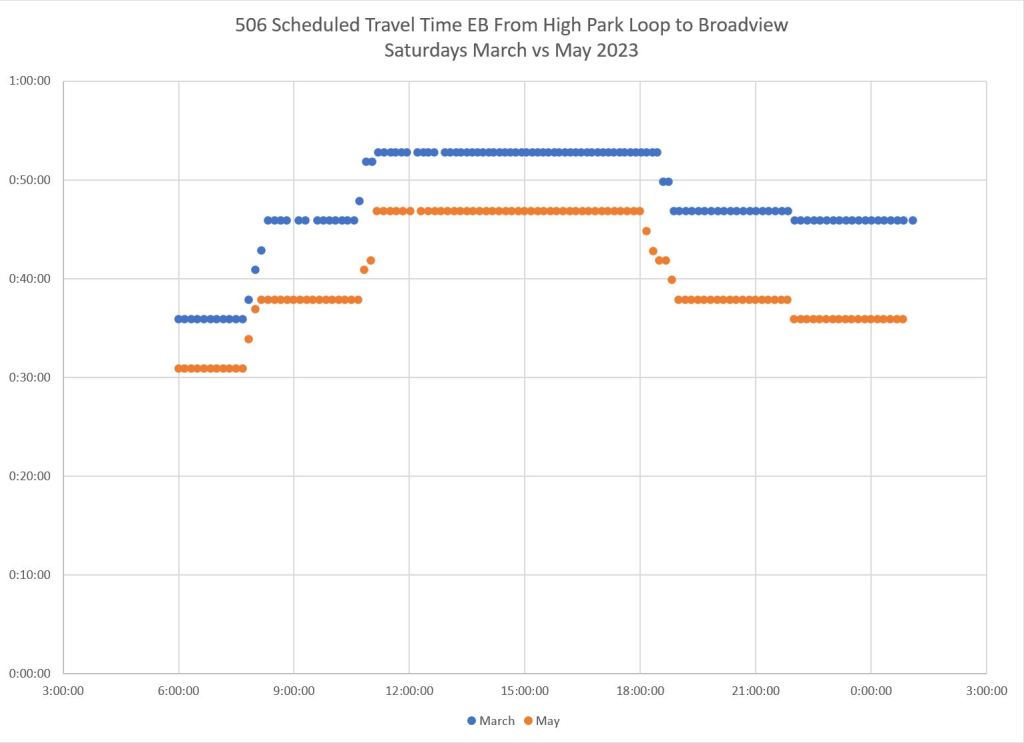
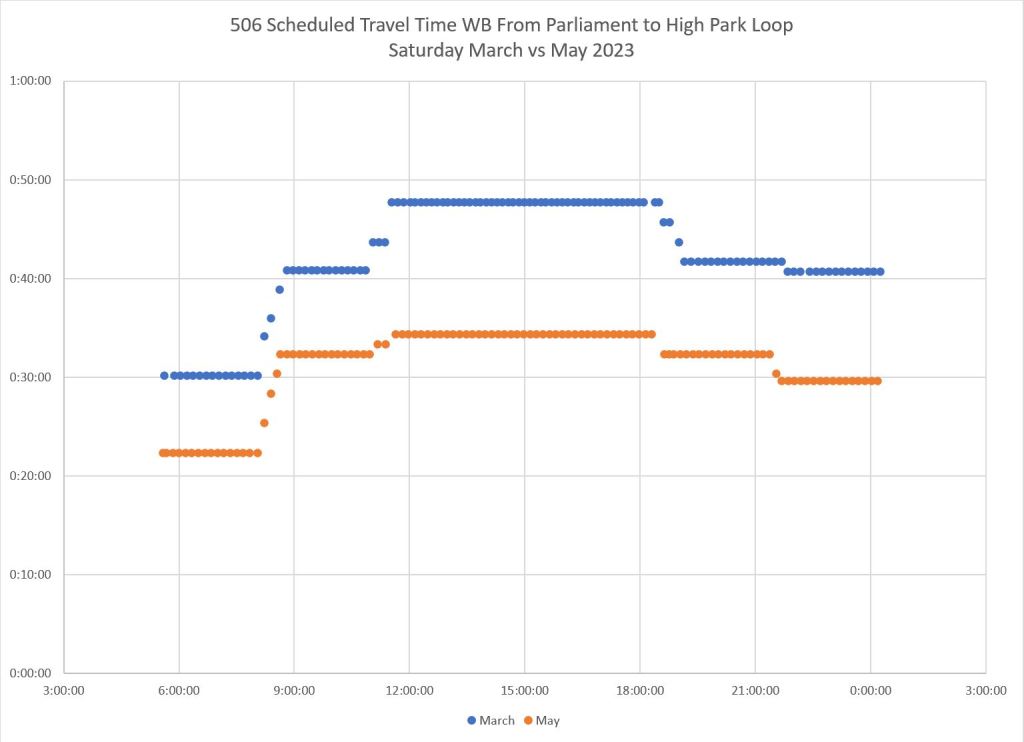
The 506 streetcar diversion will be changed westbound:

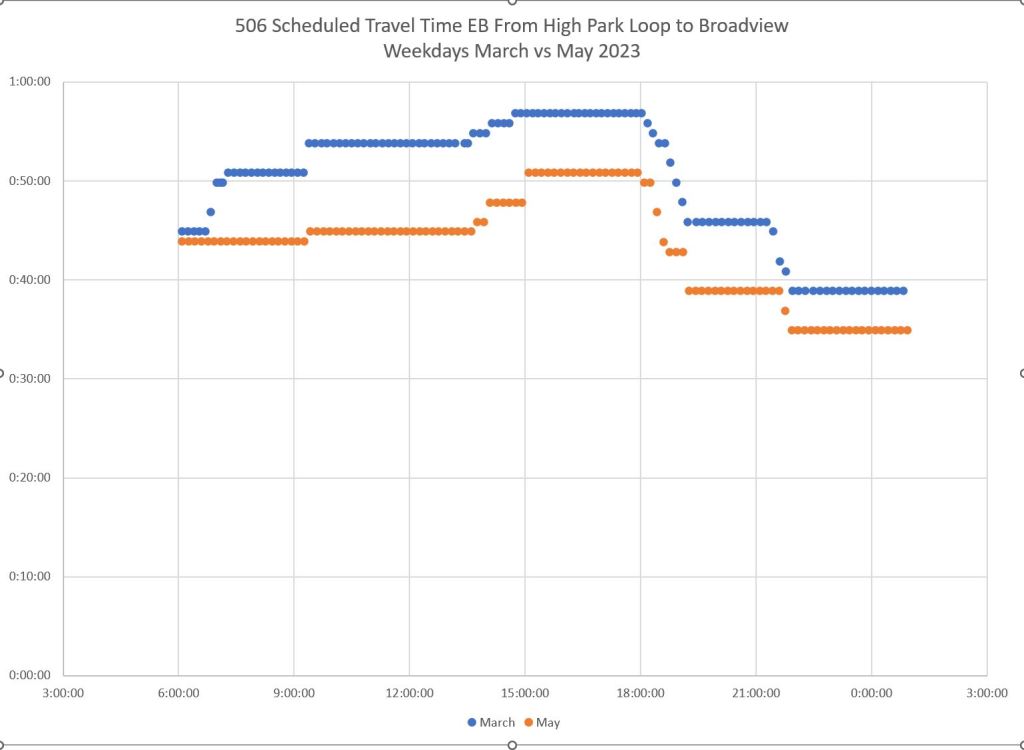
  • 506 Carlton cars will operate eastbound from Gerrard and Broadview via Broadview and Queen to Woodbine Loop at Kingston Road.
  • Westbound 506 cars will change their route. Until June 17 it is (officially) via Queen, Broadview, Dundas and Parliament to the regular route at Gerrard. This will change on June 18 to run via Queen and Parliament to Gerrard. Many cars do this already.
  • The schedule for 506 Carlton has not been updated and is still short of running time. Many cars will likely continue to short turn at Broadview and return west rather than going east to Woodbine Loop.

The pseudo-503 Kingston Road service will continue to be provided by 504/501 buses running from Kingston Road & Queen to York & King. These buses are now scheduled as part of the 501 service and should appear on tracking apps. Current plans call for the 503 service from Bingham Loop to King & York to return as a bus at the end of July, and as a streetcar in the Fall.

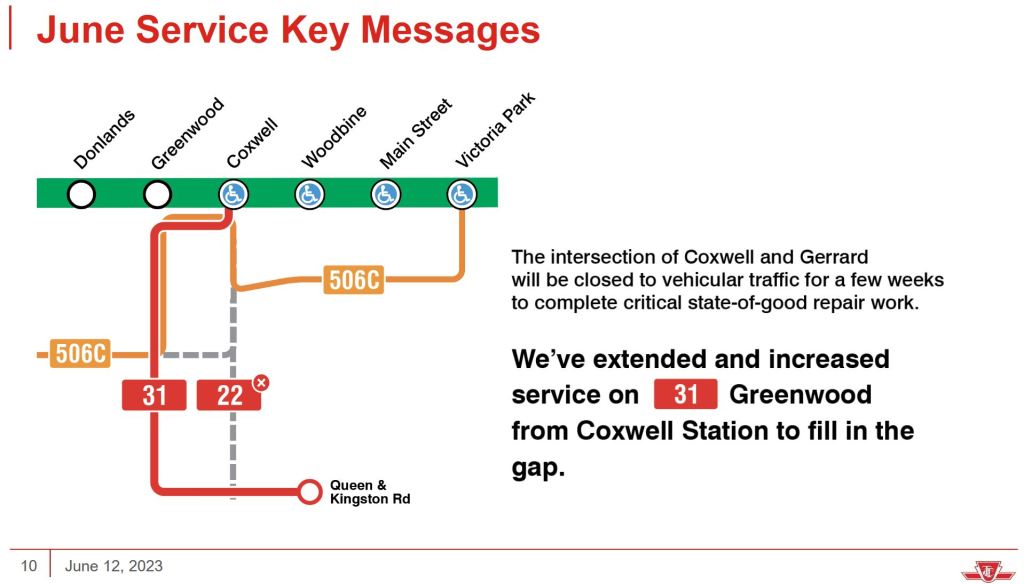
Track reconstruction at Coxwell & Lower Gerrard will cause changes in three routes:

  • 22 Coxwell, which has been operating between Danforth and Queen with diversions enroute, will be suspended.
  • 31 Greenwood will operate from Coxwell Station (its current terminus during reconstruction of its home station for accessibility) to Woodbine Loop via Danforth, Greenwood and Queen. The routing at the south end via Eastern Avenue is not known as I write this.
  • 506C Carlton bus service will continue to run between Castle Frank and Victoria Park Stations, but it will divert via Greenwood, Danforth and Coxwell to Upper Gerrard in both directions. 506C buses will make on street stops at Coxwell & Danforth. They will not enter Coxwell Station.

There will be no service on Coxwell between Upper Gerrard and Queen. The normal 22, 31 and 506C routes will resume on July 30.

Reconstruction of Main Station continues through the summer. All of the bus changes with route interlines and extensions to Victoria Park Station will remain in effect.

The TTC has three key messages about the pending changes.

Continue reading

Evolution of Bus Route Travel Times, 2020-2023, Part II

This article is the second half of a review of the change in travel times for a selection of major bus routes, many of which are part of the RapidTO “red lane” proposal, from 2020 to May 2023.

See also: Evolution of Bus Route Travel Times, 2020-2023, Part I

My purpose is to show the drop in travel times in March 2020 co-incident with the pandemic lockdown, and the gradual recovery over the past three years. The minimum times seen in 2020 establish what we would see in the absence of road traffic, not to mention a lower passenger demand, and probably show the best case for improvement with transit priority.

Depending on when I began to track various routes, there are cases when I have some pre-pandemic data from 2018 or 2019.

The situation varies from route to route and by time of day. In many cases, travel times have returned to pre-pandemic levels or higher, and some uptick is particularly notable in 2023. An important characteristic of these routes is that they do not serve the core area, but run in Toronto’s suburbs where bus ridership is strong and work-from-home had considerably less effect on demand than it does downtown.

Routes in this article include 86 Scarborough, 116 Morningside and 905 Eglinton East Express which already run on the Eglinton-Kingston-Morningside red lanes, as well as 39/939 Finch East, 54/954 Lawrence East and 25/925 Don Mills.

Note that the charts here track travel times, not service reliability. I will turn to that issue in future articles.

Continue reading

Evolution of Bus Route Travel Times, 2020-2023, Part I

This post reviews travel times on bus routes, primarily those that either have or are planned to get RapidTO red lanes for all-day transit priority. This continues from earlier examinations of the effects of changing traffic conditions on travel times over the course of the pandemic.

These articles will be the last in which I will present data for multiple routes to track post-pandemic recovery of traffic levels. I will continue to collect data, but will publish updates only if a specific route is actively under discussion for RapidTO treatment.

This article deals with routes west of Yonge Street: Dufferin, Keele, Jane, Steeles West and Lawrence West. In Part II I will turn to routes east of Yonge.

Note that an analysis of 35/935 Jane is in a separate, more extensive pair of articles in light of the current review of that corridor for RapidTO red lanes.

The format of charts used here is different from previous articles which summarized data on a weekly or monthly basis, subdivided by hour of the day. As the number of data points grew, these charts were no longer workable. Here I have adopted the style used in, among other things, my tracking of travel times on King Street which include day-by-day data, but only for a single hour of the day on each chart.

The values shown are the 50th and 85th percentiles. The 50th is the median value within a set of points where half of the trips took longer, and half of them a shorter time. The 85th is a value which captures the higher values but discards outliers that might only represent one trip within a group.

For the most part, these charts cover the period from March 2020 to May 2023, with some additional data from earlier months where I have it. My purpose in collecting the data was to monitor travel time changes with reduced traffic congestion and stop service times of the pandemic era.

Although there is no way to definitively prove this without actual implementation of red lanes, my premise is that conditions during the worst months of the pandemic show the most that is likely to be achieved by getting traffic out of the way. Additional changes such as traffic signal priority or selective elimination of stops is not specifically a red lane gain, but might be implemented concurrently. Those are beyond the scope of comparisons here.

As a general note, the onset of the pandemic travel restrictions in mid-March 2020 is quite clear in the data, as are other events such as changes in lockdown severity. Also quite clear is the effect of the mid-January 2022 and February 2023 snow storms, and on some routes, a lengthy return to then-normal travel times probably due to inadequate snow clearing.

Each set of charts is presented with data for the same period but opposite directions side by side. These charts can be quite different reflecting both geographic differences and loading patterns by direction. Charts are shown for the hours beginning at 8am (am peak), 1pm (midday), 5pm (pm peak), 8pm (early evening) and 10pm (late evening).

Where local and express routes operate together, the stats for the two services are shown separately, and a comparative set of charts shows the median values for each service.

In all cases, the Y-axis starts at 20 minutes, not zero, because data values are higher than 20 and this tactic gives charts more “elbow room”. In some cases the values drop to zero because there are no data for a specific date. This was particularly noticeable in November 2021 after the cyber attack on TTC systems.

Conclusions

  • Based on the drop in travel time in March 2020 and other subsequent covid-related changes in road traffic and transit demand, the potential for reduced travel times through transit priority varies considerably from route to route, by time and by direction. The amount of improvement through red lanes will not be uniform over each route.
  • Many trip times recovered to pre-pandemic levels or higher well before the city as a whole was “open”, and some times are now higher than they were three years ago. This accentuates the need for transit priority because longer trip times affect:
    • the cost of providing service (more buses to provide the same service),
    • frequency of service (the same buses running further apart), and
    • rider wait and travel times.
  • Express services, when they operate, offer a relatively small change in travel time versus the corresponding local services based on median travel times.
  • By analogy to the King Street pilot, the reduction in variability of travel times is at least as important in improving service reliability as any absolute reduction in the time required for trips.
  • Any proposal for transit priority should take these factors into account both for selective versus blanket implementation, and to ensure that the potential benefits are not oversold.

For those who want the details (and a lot of charts), read on.

Continue reading

Promises, Promises: 2023 Edition

The Toronto Mayoral By-Election is just under a month away, and candidates pump out announcements daily, often with a transit spin. In this article I will look at the transit-related issues they are trying to address (or in some cases avoid).

All of this takes place in a strange world where the availability of money to pay for anything is suspect. Is a promise is even credible let alone affordable? Many of the platforms overlap, and so I will take related issues in groups rather than enumerating and critiquing each candidate’s platform.

A month ago, I wrote about what a transit platform should look like:

That sets out my philosophy of what I seek in a candidate, and the short version appears below. If you want the long version, click on the link above.

  • Service is key. Run as much as possible, everywhere, and run it well.
  • Build budgets based on what you want to see, not on what you think you can afford. Just getting by is not a recipe for recovery and growth. If the money doesn’t come, then look to “Plan B” but aim for “Plan A”.
  • Fares are a central part of our transit system, but the question is who should pay and how much. Strive for simplicity. Give discounts where they are truly needed. Make the transit system worth riding so that small, regular increases are acceptable.
  • Focus on ease of use among transit systems in the GTA, but do not equate “integration” with amalgamated governance.
  • Transit property: parking or housing?
  • Foster a culture of advocacy in management and on the TTC Board.
  • Beware of lines on maps. A “my map vs your map” debate focuses all effort on a handful of corridors while the rest of the network rots.
  • Plan for achievements in your current term and make sure they actually happen. Longer term is important, but the transit ship is sinking. You are running for office in 2023. Vague promises for the 2030s are cold comfort to voters who have heard it all before.

Full disclosure: I have always maintained an “open door” to anyone who wants to talk transit, and in this round I have been approached by both the Matlow and Chow campaigns for information and advice, as well as some media outlets. This I provided pro bono and without any “leakage” of who asked me what. No other candidates asked. How much of my input shows up in platforms is quite another matter. We shall see as the campaign unfolds.

Continue reading

The Ever-Fading SmartTrack

John Tory might be gone as Mayor, but SmartTrack clings on like grim death even in his absence. A report before an upcoming meeting of Toronto’s Executive Committee shows that the total cost of the five remaining stations is estimated by Metrolinx at $1.697 billion, yes that’s with a “b”, or $234 million higher than the City’s $1.463 billion budget for this work.

Federal funding of $585 million has already been committed, but the remaining $1.112 billion is on the City’s dime. The City’s share will come from “development charges, tax increment financing and the City Building Fund” [CBF] according to the report. The CBF is an extra levy on the City Property Tax (recently extended to compensate for increased borrowing costs) that will help to pay for one of John Tory’s legacies.

Metrolinx seeks full reimbursement for this amount, but the City in March directed “the City Manager to negotiate with the Province of Ontario for the Province to commit to paying all amounts above the original Program Budget”. Negotiations are ongoing and a supplementary report will follow at an unspecified date.

The station locations are shown below, and they include a key station a East Harbour that will be the interchange between GO Transit, the Ontario Line and a possible future Broadview Avenue streetcar extension into the Port Lands. Why the City is paying for a major regional interchange is something of a mystery, but even worse is the fact that we now face a per-station cost of about $340 million for surface rail stations. The exact numbers are shrouded in the usual Metrolinx secrecy.

This is a sad story where too much political capital has been expended for anyone to ask just why we are building these stations, and especially why the SmartTrack moniker survives. With all of the hand-wringing over City budgets, the survival of at least some of these stations as City-funded projects should be reconsidered.

Charting Service Frequency (2)

In a previous article, I presented a proposed way to display service frequency on a route in a manner that, I hoped, would convey the pervasiveness of irregular service, be clear to casual readers, and in a consistent format. Several readers commented on this either on Twitter or via email, and I thank all for their contributions.

One immediate change, which I included in an addendum to the article, was to replace the vehicles/hour counts (which indicated how many buses or streetcars passed a point each hour) with an average wait time for a would-be rider. That time was calculated on a weighted basis to penalize long gaps in service.

The average wait time stat has other uses which I will explore later in this article.

My intent in developing this new type of chart is to add to the repertoire of charts I publish when reviewing a route’s performance and to show how, or if, changes the TTC makes to schedules affect service riders actually encounter.

For those interested in the details, read on. Again, comments are welcome. I would like to nail down the format before launching into a series of route reviews.

Continue reading

Charting Service Frequency: A Request for Comment (Updated)

Updated May 26, 2023 at 5pm: In response to a reader’s suggestion, I have added a sample chart that includes average wait times for would-be riders in place of the count of vehicles. To jump directly to this update, click here.

In the many articles I have published trying to review service quality on the TTC, one topic has eluded presentation: how to chart service quality over a long period while preserving the hour-by-hour, day-by-day character of the data? That question has several dimensions because a quality metric is not simply a matter of pooling stats and saying that overall things are not too bad, or even worse that service meets some sort of standard on average.

In the past I have published charts showing headways, and others showing how organized (or not) service on a particular day might be, but it has been more difficult to condense months of data for multiple times and locations.

The TTC standard for surface routes is:

On-time performance measures vehicle departures from end terminals. Vehicles are considered on time if they depart within 59 seconds earlier or five minutes later than their scheduled departure time. (-1 to +5)

CEO’s Report, May 2023, p. 18

The intent is to hit this target 90% of the time, but the TTC does not achieve this with values typically falling in the 70-to-85 per cent range. At an individual route level results can be considerably worse. Streetcar routes fared worse with a 50-to-85 per cent range, and the higher end was achieved during the pandemic era when traffic and demand were light. The numbers have fallen since then.

The TTC’s metrics have big credibility problems because they bear little relation to what riders actually experience.

There are three major reasons:

  • Quality is measured on an all day basis, or worse on longer periods such as months. Variation by day and time is completely obscured by this approach. Reliable service at 10 pm is cold comfort to a rider whose bus has not shown up for 15 minutes in the peak period.
  • Quality is measured only at terminals, not along routes where various factors can degrade service that might begin well, but quickly deteriorates with bunching and gaps.
  • Service is measured relative to schedule on the assumption that “on time” performance will automatically be reliable. However, there is considerable leeway in that standard allowing irregular service to be considered “on time”, and the TTC does not even hit their target levels in many cases.

The CEO’s Report tries to work around the limitations of the metric by noting that some routes do farly well while others encounter a variety of problems. With respect to the bus network, the report notes:

Network performance was negatively impacted by the inclement weather the weeks of February 20 to March 10, where over 60 centimetres of snow fell on the city during this time. Weekday On-time performance was 88% for Weeks 7, 11 and 12. During weekends for the period, OTP was 82%. During February, 32 of 159 weekday routes were impacted by construction for at least three weeks of the period. Overall weekday OTP was 88% for the 127 routes not affected by construction:

  • 48 routes were “On-Time” (90% OTP or better).
  • 53 routes were “On the Cusp” (85-90%).
  • 26 routes were “Not On-time” with OTP less than 85%. In summary, 80% of the routes not affected by construction scored 85% or better.

This still does not address reliability issues at the level riders experience. Moreover, for frequent service, riders do not care if a bus is “on time”, only that service is reliable. TTC assumes that on time service will, by definition, produce reliable service, but they don’t actually operate on schedule and fail to measure service as riders see it.

Irregular service also affects crowding because passenger loads are not evenly distributed. If most riders are on full buses, the following half empty vehicles are not part of their experience (except possibly their frustration with a long wait for the advertised “frequent” service). Average crowding stats do not reveal typical riding conditions. (Analysis of crowding is complicated by the limited availability of automatic passenger counter data outside the TTC. I have tried for a few years to obtain this without success.)

The charts show that bunching (headways of two minutes or less) and large gaps (20 minutes or more) are common, and that they exist across the four months of data here. They are not occasional effects, but a basic feature of TTC service. The stats at terminals, where the TTC takes its on time performance measurements, are less than ideal, but the service degrades as buses and streetcars move along their routes. Most riders do not board at terminals.

This article presents a proposed method of charting service quality on routes to provide both the detail of day-by-day, hour-by-hour conditions and a broader overview. The charts are an experiment in condensing a lot of data into a manageable size, but I am not wedded to the format. Comments are welcome. Regular readers will recognize the format from a previous attempt, but I hope this is an improvement.

The goal is to produce something that can track the quality of service over time so that the decline or recovery of TTC routes is clearly visible along with the effectiveness (or not) of any changes to schedules, transit priority or route management.

There are a lot of charts in this article, and it is a long read for those who are interested. Feedback on this method of presentation is most welcome.

Continue reading

Why Do The 506 Carlton Cars Short Turn At Broadview?

Among various problems that became evident with the many route changes on May 7 was the deep mismatch between advertised and delivered service.

Both the 501 to Neville and the 505 to Bingham Loop were often missing in action short turning usually at Woodbine Loop (Kingston Road & Queen, named after the former racetrack).

Aside from the scenic tour the 501 Queen car takes via McCaul, Dundas and Broadview, plus the usual congestion on Dundas Street, another congested location was Broadview northbound between Queen and Dundas.

In that segment, three services, 501 Queen, 505 Dundas and 506 Carlton, were all queuing for the left turn at Dundas, compounded by 504/505 buses attempting to serve the northbound stop while blocking both lanes of traffic.

Under these conditions, it was impossible for any of these services to stay on time. The situation has been partly remedied by using traffic wardens to manage the intersection, but even that depends on ensuring that streetcars get priority all of the time despite the signal setup there.

As the week of May 7 wore on, I noticed that a lot of 506 Carlton cars were not getting east of Broadview. Riders complained about cars going out of service, and I received a tip from a reader about scheduled travel time changes.

This sent me into the electronic versions of TTC schedules which are published for use by trip planning apps and which also are the source for info on their own website. These files give a stop-by-stop schedule for each vehicle on a route and allow very fine-grained examination of the schedule design. What I found was quite surprising.

Over the portion of 506 Carlton common to the March 2023 schedules when all streetcars ran through to Main Station and the May 2023 versions with service diverting to Queen Street East, the running times were substantially shorter in May than in March. The schedule as designed could not be operated, and it has become common practice to turn most of the service back westward from Broadview. Here are charts comparing the scheduled travel times.

The eastbound comparison on the left covers the route from High Park to Broadview where streetcars turn off of their usual route. The westbound comparison covers the route from Parliament, where cars rejoin the route, to High Park. Each dot is one scheduled trip plotted with the departure time on the X-axis (horizontal) and the trip length on the Y-axis (vertical). Values move up and down over the day based on expected conditions on the route.

In almost every case the March travel time is longer than the May time. It is no surprise that streetcars have to be short-turned when the schedules work against them. How the schedules came to be designed this way is a mystery, but it creates big problems for riders.

This sort of thing cannot be corrected overnight, but in the meantime the TTC should formalize the route change and post notices everywhere so that riders know how the route will actually operate. New schedules will come in late July when Metrolinx closes Queen at Degrassi for preparatory work for GO corridor expansion and the Ontario Line, and all of the streetcar routes will shift north to Gerrard. With luck, they will reflect actual travel time requirements.

Shifting the westbound Carlton cars off of Broadview at Dundas reduces the number of turns that the intersection must handle per hour. A related issue will be the degree to which traffic wardens intervene to move transit vehicles through this choke point in the network. Both of these changes improve travel times for 501 Queen and 505 Dundas cars and could contribute to more reliable service east of Queen and Kingston Road to the two terminals. I will be monitoring this over coming weeks.

Footnote:

For the benefit of readers who don’t know the whole context, the 506 Carlton car normally operates to Main Station via Gerrard. During construction at Coxwell, it has been diverted via Broadview and Queen eastbound to Woodbine Loop. The westbound diversion runs via Queen, Broadview, Dundas and Parliament including a north-to-west left turn at Dundas because there is no track for a left turn northbound at Gerrard. (The TTC was planning to add one, but the message was lost somewhere in planning when the intersection was rebuilt.)

This is part of a larger set of diversions for construction projects that will evolve over coming months.

A Travel Time Comparison From TransSee

Darwin O’Connor has left a comment noting that you can get comparisons of scheduled and actual running times from his site TransSee.ca. Here is a chart comparing the situation for eastbound travel from High Park to Broadview in March (green) and May 2023 (red). The dots show actual travel times while the lines show the scheduled values.

Note that the green dots (March) are almost all below the green line, while the red dots (May) are almost all above the red line showing that with the new schedule cars would always be late, sometimes by a wide margin.

O’Connor notes that this type of analysis chart is available on his site free for the Toronto streetcar routes.

Restoring Full Service on the TTC

“What would it cost to put service back to pre-pandemic times?”

That question comes my way as riders deal with another round of service cuts, and would-be mayors vie for attention. The answer is not simple, but an unexpected statement at the recent TTC Board meeting surprised me at how low the barrier to full service was claimed to be. Responding to a question from Commissioner/Councillor Chris Moise, the TTC’s CFO stated that the cost would be $69.5 million/year.

Although hardly small change, that is a lot less than the depth of service cuts might imply. That sent me on a dive into TTC budgets and stats to validate the TTC’s claim.

Continue reading

TTC Boosts Late Night Subway Service, Restores Beach-to-King Street Service

Effective Monday, May 8, the TTC has restored late night service on Lines 1 Yonge-University-Spadina and 2 Bloor-Danforth to every six minutes, seven days/week. This will be done with extra trains to supplement the scheduled service. The change will be formally scheduled in a future update.

Also, with the disappearance of the 503 Kingston Road car and its temporary replacement by the 505 Dundas, the TTC is now operating a supplementary bus service from Queen & Kingston Road to downtown via Queen and King from 7am to 7pm weekdays.

A direct streetcar service will not be possible until work on the Queen Street Don Bridge finishes sometime this summer, but there is another wrinkle. In the summer, Queen east of Broadview will close for Metrolinx bridge work at the future Riverside Station on the Lake Shore East Rail Corridor forcing all streetcars to operate via Gerrard. In turn that cannot begin until water main and track work at Coxwell & Lower Gerrard completes.

The additional subway service is made possible by an unexpectedly lower absentee rate among operators compared to budget. The TTC made a larger provision for covid-related sickness and finds itself with more available staff.