Route 506/306 Carlton will operate as a bus route east of Parliament Street for two weeks beginning late on May 25. Worn curves at Gerrard & Bowmore (between Coxwell and Woodbine) and at Coxwell & Upper Gerrard will be replaced.
Updated June 6, 2024: The diversion that was expected to last until June 6 finished a day early, and normal service was restored to Main Station on June 6, not June 7 as originally planned.
Updated May 31, 2024 at 4:30pm: On the afternoon of Tuesday, May 28, the TTC announced that the 506 Carlton route would be extended east to Woodbine Loop via Queen Street. This would soak up the very substantial unused scheduled time for trips through to Main Station. Although some cars did operate over this routing on May 28, many turned back at Broadview. From May 29 onward, all service ran east to Woodbine Loop via Broadview and Queen, returning westbound via Queen and Parliament. None of the cars operating off route, nor any of the replacement shuttle buses appear on the tracking apps.
There service diversion varies as work progresses:
From 11pm Saturday May 25 to 4am Monday May 27:
The first stage of the work will be at Gerrard & Bowmore.
From 4am Monday May 27 to 4am Friday June 7:
The second stage of the work will be at Upper Gerrard & Coxwell.
The extended shutdown of Line 2 on May 13 brought the TTC’s work car fleet into the spotlight thanks to multiple equipment failures leading to hydraulic fluid leaks.
In the management presentation, the average age of that fleet was cited as 17 years, but these cars vary greatly in age. Here are the affected cars.
Vehicle
Built
Function
Leak Incident Dates
RT-41
1993
Tie Tamper
Apr. 2/24 & May 16/24
RT-17
1996
Tunnel Washer
Jan. 17/24
RT-7
1998
Locomotive
Feb. 10/24
RT-56
2006
Vacuum & Drain Cleaning
Jan. 14/24 & May 13/24
RT-84
2011
Vacuum Car
May 15/24
Replacement of RT-41 with a new car was proposed in the 2018 Capital Budget along with several other new and replacement cars. The intent was to refresh the fleet and increase capacity to perform more work on the expanding subway network. Most of this program was deferred under CEO Rick Leary, although a second Tie Tamper, RT-21, does now appear in the illustrated list of work cars. RT-41 is well overdue for replacement.
Inspection of all work cars began a few days after the May 13 incident. Sources indicate that fewer than one third of the three dozen cars reviewed in the first two days passed inspection.
Planned work on Line 1 on the May 18-19 weekend was deferred, and it is unclear how the sidelining of RT-41 and other cars might affect planned track repairs.
Questions for the TTC
On May 22, I wrote a series of questions to TTC Media Relations attempting to get an official version of what I had heard from sources. Here are the questions.
Can you confirm the failure rate for inspections (over 2/3)?
Has all of the fleet been inspected now and what are the results?
Will further adjustments be required in maintenance plans?
A key vehicle that was not available last weekend was RT-41 the tamper car. According to the fleet diagram included in the board presentation there is another tamper car RT-21. What is its status?
In 2018 the capital budget included a multi-year program to replace elderly work cars and expand the fleet including [replacement of] RT-41, but this program was repeatedly pushed into future years. What is its status?
Since the pandemic the budget blue books have not been available, although there was talk of an e-version of them. What is the current status?
The TTC’s response on the afternoon of May 22 was not very revealing:
As you know from the Board meeting, we’ve already started the deep dive with external consultants AND our own staff have enhanced our proactive inspections on the workcar fleet.
The results, outcomes and findings will first be shared with our Board when they are known.
I can say that your source has misinformed you in as much as we have not yet inspected the entire fleet as this is a time-consuming process that sometimes requires workcars being shunted from one location to another.
As deficiencies are identified, they are corrected before being the work cars are put into service.
The TTC’s response was less than helpful for all questions:
The TTC did not address the failure rate for cars that had been inspected.
The TTC claimed my source was incorrect, but misrepresented the question. In fact I asked whether the inspections had been completed, and indirectly they confirmed that the answer is “no”.
Not answered.
Not answered. Tamper RT-21 is a comparatively new vehicle (it does not appear in 2018 fleet lists). It is not clear why it was unavailable when tamper RT-41 was sidelined.
Not answered. The repeated deferral of this project is a matter of record within the budget papers from 2017-2024.
Not answered. The significance of the “blue books” (so named because of the colour of the binders that held them) is that they included detailed descriptions of all capital projects and their status well beyond information in budgets or quarterly financial reports. Before the pandemic, these were routinely provided on request, but I have not been able to obtain them since 2019.
Most of the questions have nothing to do with the “deep dive” into fleet condition, but the TTC has used a simplistic response to dismiss all questions whether they relate to the deep dive or not. The one “answer” attempted to discredit a statement I did not make, and by extension the entire sequence.
Maybe, somewhere, there is a Board member who will demand answers.
Reduced Speed Zones
The tables below track the Reduced Speed Zones where track is awaiting repair. This is an updated version since the previous article. Depending on how your browser presents the tables, you may have to scroll to the right to see the most recent entries.
Although many of the entries from early 2024 have cleared off, others appear suggesting that inspections are uncovering new problem areas and adding them to the list. Little has changed through the month of May.
In a recent “Stakeholder Update” email, the TTC reiterates misleading claims about the service changes implemented on May 12.
Significant Service Increases as of May 12
As of May 12, TTC has TTC increased scheduled service on major routes, delivering more frequent and reliable trips, shorter wait times, and more room for customers on board. The latest round of service increases will bring service to 96% of pre-pandemic levels, the highest since 2019. 24 bus routes now have improved service, mostly in off-peak periods, providing more room on board and improving more than 140,000 daily customer trips.
I reviewed the changes in a previous article showing that in many cases service is actually less frequent than it was before. See:
TTC quotes service as being at 96% of pre-pandemic levels. This is measured in vehicle or train hours, not by the actual frequency of service. Some of the changes use additional vehicle hours to address traffic congestion stretching existing service further apart to give longer scheduled trip times. With less frequent buses, these changes do not provide “more room on board”.
The TTC claims that by improving schedule reliability, they simply reflect actual operating conditions and that the former service did not match schedules. This might be true, but still does not reflect the provision of more service measured as buses/hour past your stop.
The tiresome point about this is that one expects spin from what is a “communications” piece telling the official story and putting the TTC in the best possible light. For years the TTC Board under former Mayors has been content to lap up this and other management tales, but an organization hoping to win back riders cannot start by overselling its wares.
The TTC has severe budget problems, but these are not helped by overly rosy claims about improvements that, if anything, undercut calls for better funding. It’s easy and popular to slag the Feds when they don’t belly up to the bar on capital funding, but this applies equally to the City and Province on the operating side.
Riders may see the ads touting better service, but like shoppers lured into a store with a glitzy window display, they soon find what is really on offer.
In this round, the data are from January 1 to February 15, 2024. As before, the raw information has been provide by Darwin O’Connor from his TransSee website, for which much thanks.
The amount of service the TTC operates is limited mostly by budget, which in turn dictates how many operators the system can afford, but there is also the question of bus availability and reliability.
Updated May 20, 2024 at 3:10pm: Link to UITP report on in-motion trolleybus charging added at the end of the article.
Reliability
Buses that break down interrupt service and incur greater maintenance. Buses that never leave the garage might show up on the roster, but they are not really available.
For many years, the ratio of spare buses to scheduled service on the TTC has been quite high by industry standards, and this grew during the pandemic thanks to service cuts. Restoring full pre-pandemic service, let alone expanding beyond that level, does not depend on fleet size in the short term. Moreover, many of the elderly vehicles on the system will be replaced with new diesel-hybrids now on delivery, and this should increase the number of buses actually available for service. Opening of Lines 5 and 6 Crosstown and Finch West should also release buses for use elsewhere.
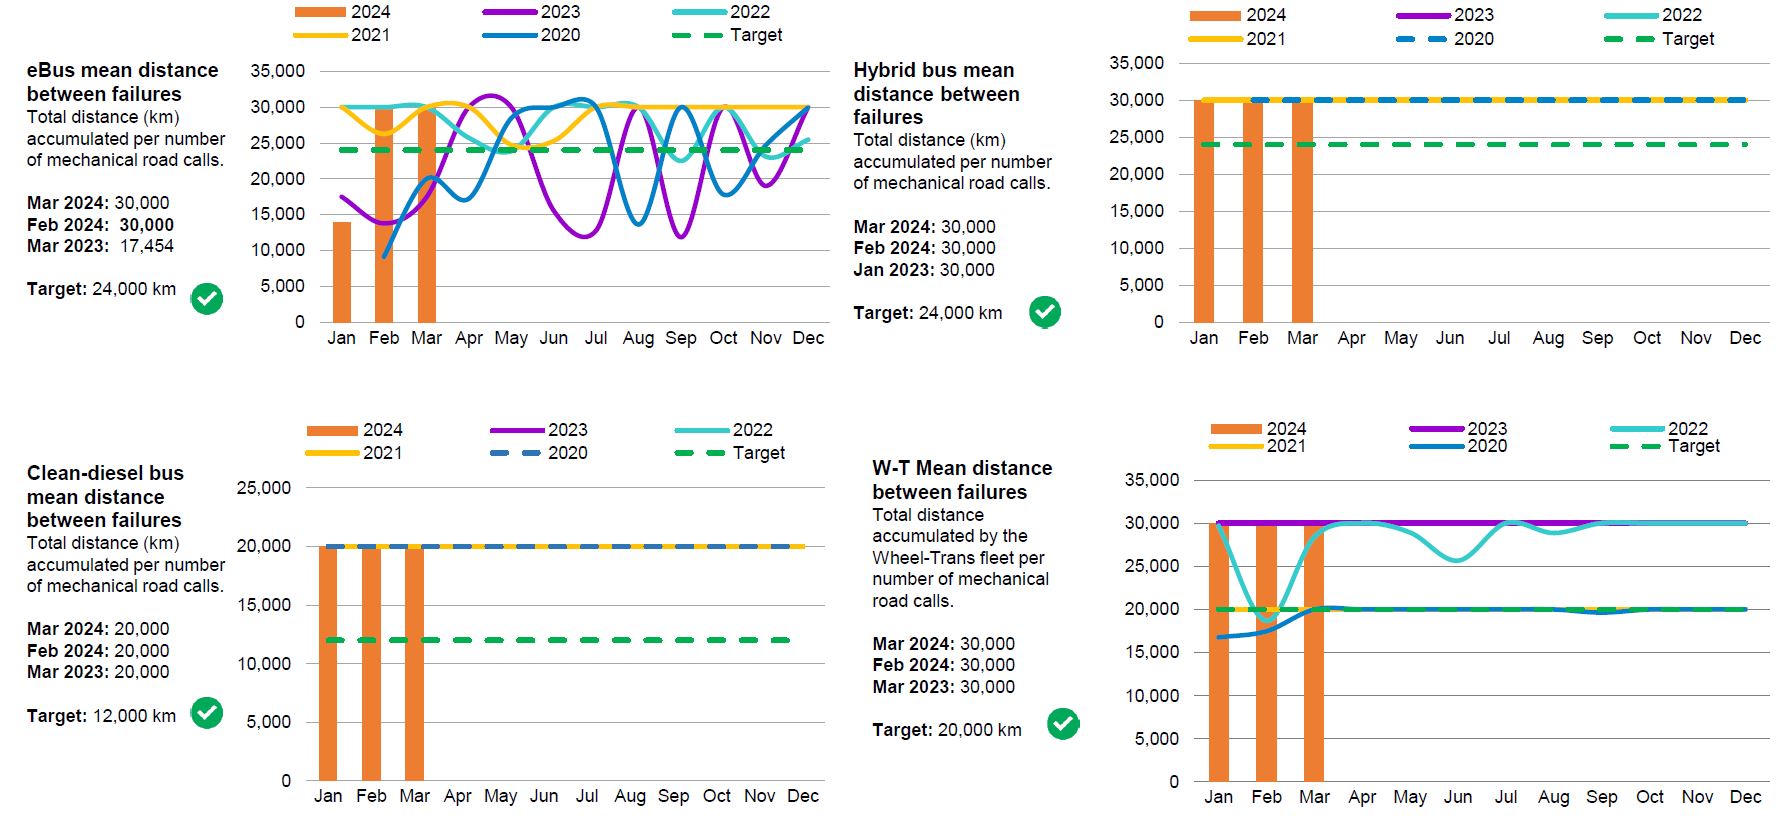
The May 2024 CEO’s Report shows the current official fleet size.
The reliability of buses is reported in an odd way by the CEO. The charts below have capped the reported mean distance to failure at a target value rather than reporting actual values for several years. We know that hybrid buses achieve at least 30K kilometres between failures, and diesel buses achieve 20K, but the actual numbers could be both higher and more variable than the charts show. Meanwhile, some values for battery eBuses are capped and others wander quite a bit. Note that both the target level and y-axis maxima vary from one chart to another.
An important factor here is that buses that never, or rarely, operate in service do not contribute to failure statistics, and this can hide the true reliability of a fleet, or subgroup within the fleet. Unused buses represent capital sitting idle and service that cannot be provided. If budget cuts prevent full usage of the fleet, this is hidden, but there could be an unseen cap on what is possible if budget priorities change.
Subway service on the central portion of Line 2 Bloor-Danforth was suspended for over 12 hours on Monday, May 13 due to a spill of hydraulic fluid on the tracks. The replacement bus service was swamped by the combination of subway demand and congestion on Danforth Avenue and Bloor Street. The situation was compounded by changing and incomplete information about the extent and potential duration of the problem.
This was initially described as a spill somewhere between Sherbourne and Castle Frank Stations with the impression that the directly affected area was small. In fact, the volume was large, 200L of hydraulic fluid, and the area ran from Spadina to Greenwood Yard (east of Donlands Station). Trains could not operate safely until the rails were cleaned and operators could brake with confidence that trains would actually stop correctly.
This was not the first such incident. At a TTC Board Meeting earlier in 2024, ATU Local 113 had raised the issue of operational safety after a similar, albeit smaller problem in January at Eglinton West Station. Following the May 13 spill, the ATU wrote to the TTC Board raising basic questions about the incident, and by implication how well-informed the Board actually was about ongoing issues with subway safety.
At the May 16 Board meeting, management gave an extensive presentation about hydraulic fluid leaks and the recent increase in the frequency of these events. It is not clear whether such a detailed presentation would have occurred without the ATU going directly to Board members. Management’s credibility and transparency have been open to question following a near-miss incident at Osgoode Station that went unreported to the Board for almost a year, as well as track and infrastructure problems including the SRT derailment, and the need for ongoing slow orders due to problems with subway track.
CEO Rick Leary has retained external consultants, Hatch LTK, to review these incidents, and there will be a peer review by APTA (American Public Transit Association).
A much broader concern is subway delays of various types and how they are handled. Some have external causes (passengers wandering at track level, for example), but some are “own goals” in the sense that they arise from operational or infrastructure issues that could have been prevented. Whatever the reason, all of them strain the subway’s ability to provide reliable service. This works directly against the drive to restore transit’s credibility and attract new and returning riders.
Far more is needed than free Wi-Fi here and a new kiosk there. Creature comforts are nice, but the service must be trustworthy. The TTC’s fundamental job is to move people. The lion’s share of delays might be due to external factors beyond the TTC’s control, but how they react to delays is key.
Growth of transit ridership is a subject often discussed in the abstract, but rarely with specifics and particularly with no thought to the financial implications for Toronto and supporting “partners” in other governments. Transit is one of those “good things” we will support at least with fantasy maps of future networks and even billions here and there for construction. Actual transit service is quite another matter.
This issue surfaces again with two 5-year plans at the TTC Board meeting of May 16, 2024:
Both plans talk about many things other than ridership, and I will leave a wider review for another day. The Corporate Plan includes one of those great time-wasters of management navel-gazing, new vision and mission statements.
The new vision statement: Moving Toronto towards a more equitable, sustainable and prosperous future.
The new mission statement: To serve the needs of transit riders by providing a safe, reliable, efficient, and accessible mass public transit service through a seamless integrated network to create access to opportunity for everyone.
The concept of actual growth is buried in five “strategic directions” rather than being the one overarching goal.
Build a Future-Ready Workforce.
Attract New Riders, Retain Customer Loyalty.
Place Transit at the Centre of Toronto’s Future Mobility.
Transform and Modernize for a Changing Environment.
Address the Structural Fiscal Imbalance.
In simpler days, this was expressed by the motto still found on the TTC coat of arms:
“Service Courtesy Safety”
The Service and Customer Experience Plan, true to its name, actually focuses on service although one might hope it would aim higher if only to inform debate on possible futures for Toronto. It does include a number of options including costs projected out five years. This is a welcome reminder of the 2003 Ridership Growth Strategy that started from the premise “here is what we could achieve” rather than “we cannot afford to even talk about improvements”.
Not mentioned in either of these is the TransformTO scheme for massive increase in transit service and ridership. TTC staff included this in a December 2023 update on their Electric Bus Plan. There has been some confusion about whether this is actually an approved Council policy, and I understand that it is not. In any event, it is another vision of the future, and it would incur very high costs for additional fleet, infrastructure and service.
A vital point about service plans is that rapid transit construction alone will not achieve high growth both because trains must run in those tunnels to carry riders, but also because those riders do not all live and work at stations. The service to and between the rapid transit lines is as important as the shiny new stations and tunnels.
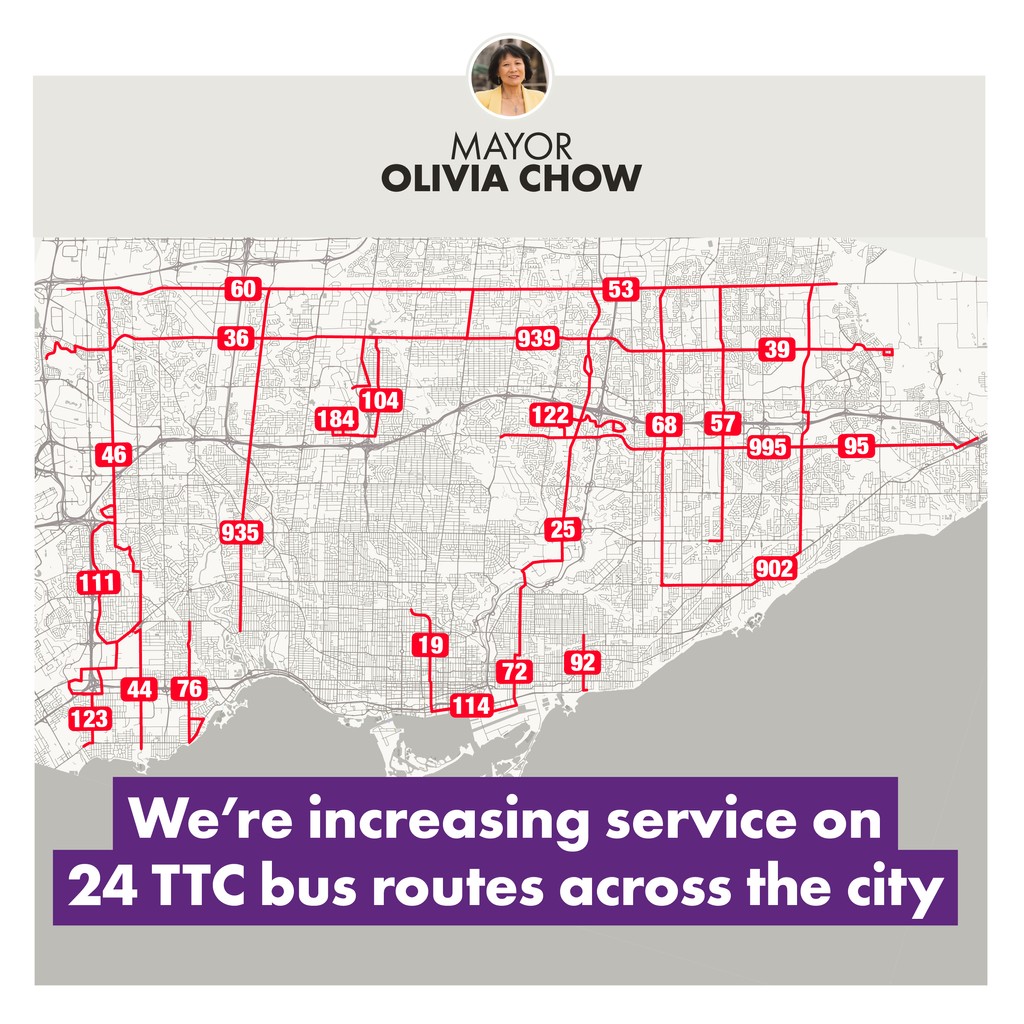
Earlier in the week, on May 7, the Mayor Chow and TTC Chair Myers, among others, held a press conference to announce widespread service improvements, and the illustration below has appear in the Mayor’s social media feeds.
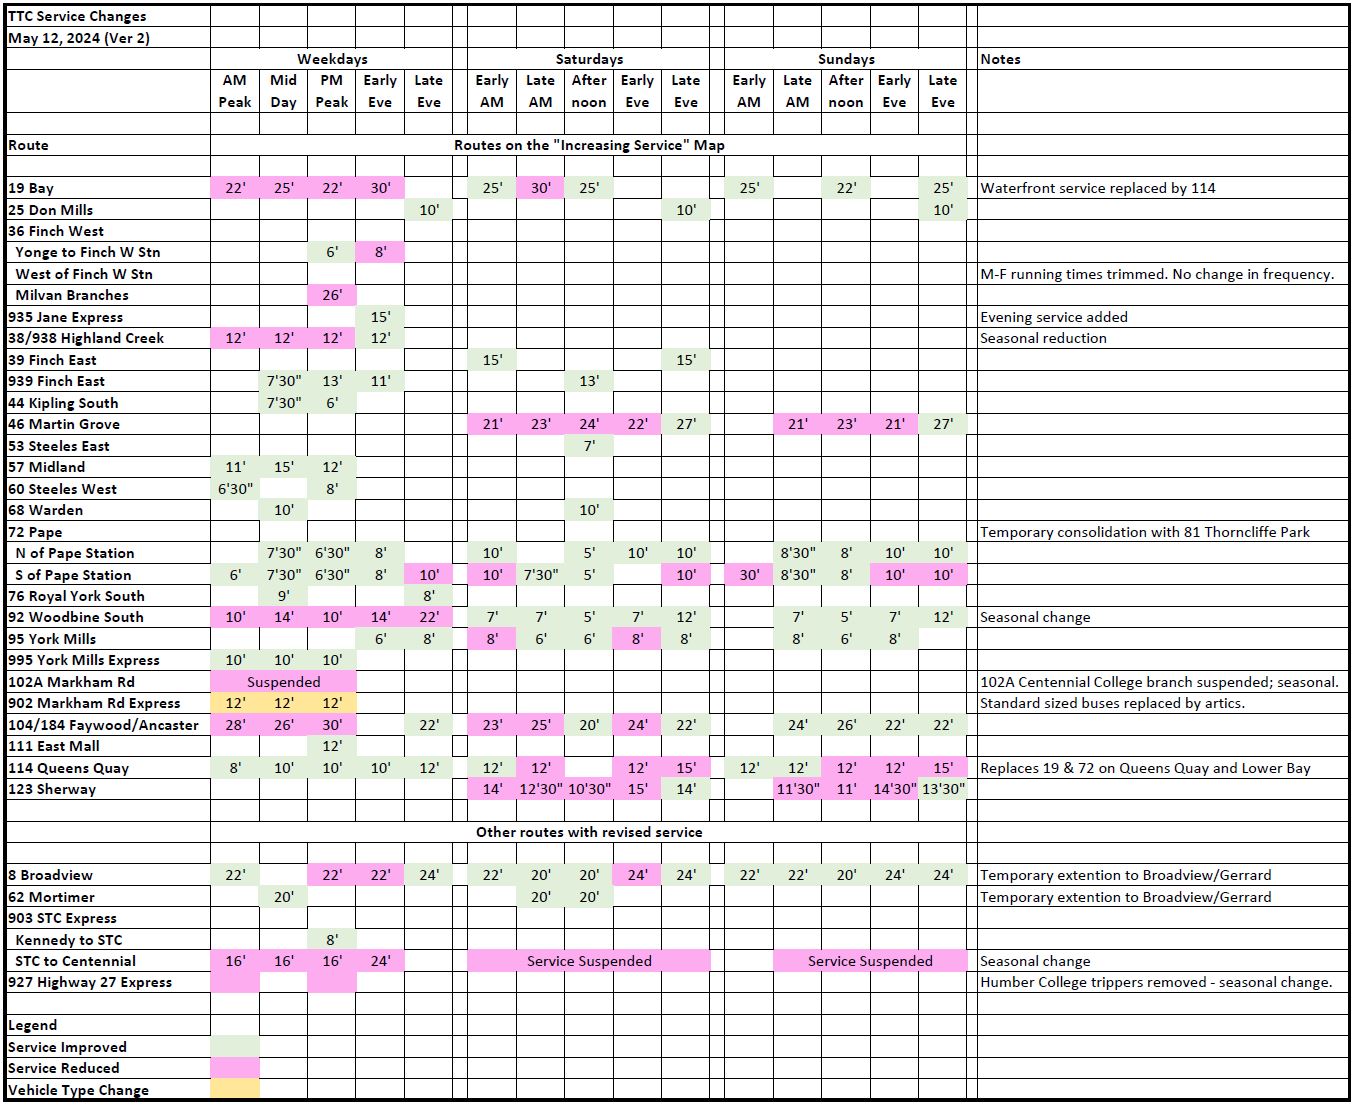
There is only one problem: several of the routes on this map will see service cuts, not increases. In some cases, there is a service increase, but on only part of a route or at a limited time through the week. The chart below illustrates where and when the changes actually happen.
In parliamentary language, one might say that “the Mayor was badly advised”. However, it is her name and face on an announcement that simply is not true.
TTC management has a long history of spinning service changes to emphasize the gains, such as they might be, while downplaying the cuts. The May 2024 changes were particularly challenging to anyone who wanted the details because the memo containing this information was not released until the afternoon of May 10. Normally it is available one to two weeks in advance. It may have suited the stage management of the press conference to keep it under wraps.
995 York Mills Express was singled out in the press announcement because of the doubling of weekday midday service from 20′ to 10′, but that is a rare example of a significant improvement. It is not typical of the actual changes to the bus network as a whole.
I have already written about the so-called service recovery based on vehicle hours, not on actual service frequency. The TTC itself has noted a decline in traffic and transit speeds in recent years. That, combined with more generous provisions for delay recovery time has pushed up the number of hours even while some routes see less frequent service.
This chart and the following text have been corrected to show changes to 939 Finch East Express which were missed in the first version.
A detailed route-by-route review follows the “more” break.
The TTC has announced many service changes on Sunday, May 12. As I write this, they have issued a press release and have a page listing the changes on their website that, I must say, conveys more detailed information than usually appears in their notices.
There are more improvements than cuts in this round, but they lie mainly outside of the peak period.
They have not yet issued the detailed list of changes from which I normally build a spreadsheet comparing old and new headways, travel times and vehicle allocations. When this is available, I will update this article with the usual spreadsheet. I hope to get the details tomorrow (May 8).
Updated May 10, 2024 at 10:00 am: The TTC has still not released the detailed memo describing the changes. This is not merely an inconvenience to that pesky blogger SwanBoatSteve, but it affects internal processes for customer information online and at stops. Customer info is always cited as an important part of plans to improve service, but actual delivery can be hamstrung by delays in key parts of the process.
Updated May 10, 2024 at 5:00 pm: The detailed memo of changes was issued mid-afternoon today. This article will be updated first with the addition of maps, and a correction to the 104/184 service information. Over the weekend, I will build the usual spreadsheet showing the details of all changes. Stay tuned.
Updated May 10, 2024 at 5:15 pm: Construction project list added. Tables of service hours and fleet allocations added.
Updated May 11, 2024 at 7:40 am: 39 Finch East change revised from “Weekday” to “Saturday”.
Updated May 11, 2024 at 11:55 pm: Spreadsheet with details of all service changes added.
This article is the third and last in my review of the April 11 TTC Board meeting. Apologies to readers for the long articles, but this happened to be an agenda with a lot of information that collectively gives a tutorial on the state of the transit system.
Updated May 6, 2024 at 11:30am: The section about farebox cost recovery has been updated to correct arithmetic errors in the original version, and a table is added to show the calculation.
Every quarter, TTC management produces a Financial and Major Projects Update, and this one covers the period to year-end 2023 including the financial results for Operations and a review of the Capital projects portfolio.
Within the Operating results are warning signals about the long return to pre-covid ridership, revenue and cost projections, and declining sources of funding including City reserves. On the Capital side, as is often reported, there is a very large shortfall between projected needs and known funding. This is compounded by long-running capital projects for fleet replacement, known and possible system expansion projects and the conflicts between political motivations and actual needs for facilities, fleet and future service.
Also included in this article are comparative figures for 2019, the last full pre-pandemic year.
On the TTC Board agenda for April 11, 2024, a long report describes the TTC’s 2024 Asset Management Plan. This document has been in the works for some time. It arises from an Ontario Regulation in 2017 and a City Council Corporate Asset Management Policy adopted in 2019 whose intent is that there is long term sustainability and accountability for City assets. The TTC as a local Board of the City is subject to this policy.
This is a long article reviewing an even longer document. For a general overview, some readers may prefer to stop at the break just before the chart of “condition scores”. The remainder of the article reviews some of the detail in the Plan, its strengths and shortcomings.
General Observations
Although the document gives a unified impression in its design, it was produced with information from many sources in the TTC. Some of these, notably for the streetcar system, betray unfamiliarity with various assets, or a sloppiness in editing. Some information is dated and reflects conditions a year or more ago with little or no mention of works in progress and how they would affect the review. Any future budget planning must be based on current, accurate data.
As with so much information reported by the TTC, far too many data are reported as overall averages without the granularity needed to flag key problems. Some projects risks are described as if no work has been done when in fact they might be well on the way to completion. Was it just too much trouble to accurately portray the state of some assets? That is troubling in the context of other events throwing the TTC’s ongoing maintenance practices into question.
One section of the Plan deals with “systems” which, in many cases, are networks of devices. A failure within a system does not necessarily affect just one part, but can have a farther reach as seen in the recent fire near Islington Station. Moving up a level from that, the Plan is divided into major topic areas, and several of these are related although the plan treats them as separate entities. This subdivision is, in part, dictated by Provincial Regulation.
Trains need cars, but they also need track and power, not to mention stations. It is important to see the transit network both as a complex collection but also at the detailed level. One thing the Plan does is provide a tutorial for those who only know part of the system, notably the politicians responsible for funding transit and choosing its goals.
An important part of any asset plan is the recognition of alternate futures depending on what is done, or more critically not done, in the short-to-medium term. The cumulative effect of deferred work during economic downturns is not immediately apparent, but can create a backlog requiring significant effort and spending just to get back to “normal” conditions. If deferrals last long enough, they affect corporate culture and become the accepted way of doing business. An organization can forget what proper asset management and maintenance look like after years of aiming for a too-low target.
Funding partners grouse about above-inflation cost growth when their own penny-pinching, coupled with management making the best of a bad situation, created the situation in the first place. It is important to recognize the difference between higher costs through factors like materials and labour, and higher spending required to reverse a backlog of overdue work and restore the system to good, steady-state condition.
An issue that appears in several parts of the Plan is the effect of vehicle electrification. This touches the bus fleet and related maintenance and charging facilities, and the non-revenue fleet. The change in propulsion and control technology affects maintenance workers who must adapt and be trained, as well as the equipment needed to support an electric fleet. Electrification is not just a matter of buying a new style of bus, but a pervasive change in a large part of TTC operations that will extend over a decade.
We may reach a point where diesel-hybrids are regarded as a minor “legacy” fleet from days gone by, but that time is a long way off. Co-existence of two modes will continue for many years.
The City has contemplated but not yet adopted a long-range goal not just to fully electrify transit operations, but to very substantially increase service levels. This would have a pervasive effect on the entire asset base, staffing and future budgets. The Plan includes an overview of proposed rapid transit expansion, but there is no discussion of the service increase scheme.
Overview
The 2024 Plan sets out the TTC’s many classes of assets, their condition, ongoing maintenance and replacement cycle and some information on cost. This leans heavily to the Capital side of TTC budgeting and the large known shortfall in committed and likely funding over the next 15 years. Some information is incomplete because the TTC data collection is still underway.
While this Asset Management Plan meets the requirements of the Regulation for 2024, the next phase of compliance, due on July 1, 2025, requires the TTC to have a financial plan that identifies the funding needs to ensure all assets the funding to ensure all assets are maintained in a state of good repair to meet future levels of service. The 2025 Asset Management Plan will also further inform the preparation of the TTC’s Capital Investment Plan (CIP). The TTC’s 2024-2038 CIP has identified a total of $47.855 billion in base capital needs over a 15-year period, of which $12.398 billion is funded, leaving $35.457 billion in unfunded capital needs.
2024 Asset Management Plan, Covering Report at p. 7
That paragraph does not break out “State of Good Repair” (SOGR) items from the overall budget, and yet that will be essential in deciding where to allocate available money. Moreover, the focus here is on Capital with no mention of day-to-day maintenance funded from the Operating budget.
A sense of the TTC’s scale is given early in the Plan:
The scope of assets that the TTC owns and manages is large and varied, and comprises of the vehicles, infrastructure, facilities and support systems necessary to operate and maintain the TTC’s bus, subway and streetcar services. The asset inventory changes regularly as new assets are commissioned and older assets are decommissioned at the end of life.
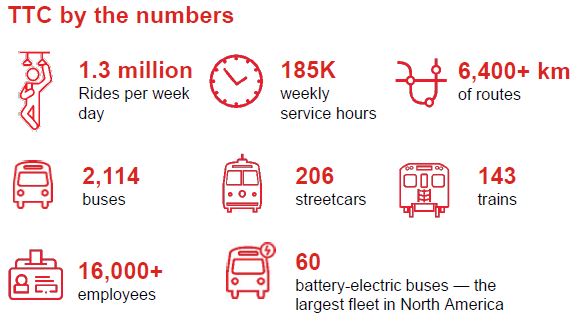
The vehicle fleet consists of 2,572 accessible buses (including 250 paratransit Wheel-Trans buses), 204 streetcars and 143 subway trains, with the fleet and other asset classes supported by more than 900 non-revenue vehicles. There are a further 6,400 small and 1,900 large items of industrial equipment, which support the maintenance of TTC assets.
The TTC maintains more than 70 kilometres of mainline subway track across three active lines (following the decommissioning of Line 3 in 2023) and 388 kilometres of Streetcar Way. Streetcars are powered by 454 kilometres of overhead/traction power feeders and 368 kilometres of overhead contact system.
Across the subway and streetcar network, the TTC is responsible for the maintenance of 77 box structures, 43 bored tunnels, 75 bridges, four culverts, 170 retaining walls and 474 miscellaneous structures. In addition there are 38 overhead structures that are maintained by the City. The Prince Edward Viaduct is jointly maintained by the TTC and the City.
The vehicle fleet is stored, maintained and operated from 22 separate facilities located across the TTC network, which include garages, carhouses, yards, and shops. There are also 58 substations to support movement of fleet and provide power to the facilities. Across the subway network (including the now decommissioned Line 3), there are 75 subway stations with 164 elevators and 329 escalators moving both passengers and freight. The TTC also maintains more than 9,500 bus and streetcar stops/shelters, alongside two bus terminals and nine Wheel-Trans hubs.
Corporate and professional services also operate from five administrative buildings across the city, and the TTC maintains 29 other buildings, including emergency service buildings, operator convenience and waiting rooms, as well as a number of parking lots.
Operation of transit services across all three transportation modes is facilitated and supported by communication, signalling, electrical and mechanical systems. These systems are made up of many thousands of individual assets, with further details contained in the relevant sections of this Plan.
TTC Asset Management Plan 2024 at p. 7
Assets are divided into five classes as specified by the Regulation, and their total replacement cost is $25.1 billion. They vary quite substantially in age with some being over a century old (early streetcar facilities) to quite recent. The condition of each class also varies.
Considering the known cost of projects now planned and in progress, to the degree these are revealed, these numbers could well understate the true replacement costs. A related complication is the ownership of some assets by Metrolinx, but their operation as part of the TTC network.
Some assets are consolidated in this table in part because the source data are in insurance reports organized for that purpose. For example, IT Systems are included under the contents of Facilities, not under Systems. However, there is no detailed review in the Plan of IT systems, their age and technology, nor of their need for “state of good repair”.
Class
Replacement Cost ($ billion)
Condition
Fleet
Revenue vehicles (buses, streetcars, subway trains), non-revenue vehicles, and the industrial equipment used to service those vehicles.
$7.1
2.1 (Good) to 3.7 (Adequate)
Linear Infrastructure
Subway track, Streetcar track and overhead power.
$2.8
1.0 (Excellent) to 4.0 (Marginal)
Facilities
Storage and Maintenance facilities, subway stations, administrative buildings; bus and streetcar stops.
$5.0
Unknown – Not enough data exists to provide a rating.
Systems
Communications systems, signals, electrical systems, and mechanical systems.
$1.1
1.0 (Excellent) to 5.0 (Critical/Poor)
Structures
Box structures, bored tunnels, stations, bridges, Prince Edward Viaduct (track beams and sidewalks), culverts, retaining walls, and miscellaneous structures.
$9.1
Very Good to Very Poor
Total
$25.1
Of particular interest in this list is the group Structures which holds over one third of the replacement value for the system. This is rarely mentioned in funding and priority debates, in part because much in this category has a very long lifespan. However, as the subway ages, proportionately more structures enter a period where preventative maintenance is essential, and in some cases major reconstruction is needed. (This is a separate systemic issue from basic problems of new subways with water penetration and other faults from the day they open.)
A second group, Facilities, includes the above ground part of the system and, like Structures comprises many assets with long lifespans such as buildings. These too have ongoing preventative maintenance needs but with a lower profile than new trains or signals, let alone new lines, for funding.
Much recent discussion of State of Good Repair focused on the Capital Budget and shortfall, but substantial day-to-day work is required to keep various assets in good shape. A shortfall in the Plan is a sense of the cost, adequacy or funding of this work even though it is integral to preventing a decline in asset quality. This ties into recent discussions about system maintenance.
Life cycle activities and the point at which they occur vary between assets according to their inherent nature, the required level of service, their operating context, use and condition. As assets approach the end of their serviceable life, life extension programs may also be implemented to prolong service life ahead of replacement or renewal. However, it should be noted that as assets near the end of service life, the maintenance cost will increase significantly. Details of the life cycle activities applicable to each asset class and the sub-assets within each class are contained in the relevant sections of the attached plan.
2024 Asset Management Plan, Covering Report at p. 6
Under each subclass of assets, there is a discussion of related risks. These show how some aspects of any Plan and Budget are related, although generally at a time frame where effects are not immediately obvious. For example, if the average age of a fleet rises, then more running maintenance is needed plus a life extension program. This affects both the Capital and Operating Budgets.
Because subsidy arrangements for these budgets differ, avoidance of Capital spending might trigger a rise in Operating spending at a higher rate for the City (or higher fares) because a lower proportion of the Operating Budget comes from other governments. However, at the local level, the temptation to “make do” can lead to declining maintenance, reliability and service.
The 2024 AMP, prepared in accordance with the requirements of O. Reg. 588/17, affirms that an estimated 50% or $12.6 billion of TTC assets are entering, or in some cases, are well into their twilight years.
If half of the assets are “well into their twilight years”, this is not an overnight change, but rather the effect of many years of deferred maintenance and replacement. This is particularly true of the subway network which was once brand new and required less maintenance, let alone replacement of major components. However, as infrastructure ages, it can move “into the twilight” with ongoing plans and budgets based on earlier years.
Proper funding should not just maintain the existing rate but grow to reduce and keep overall asset ages within a range of reliable service.
Particular concern over the lack of funding for state of good repair applies currently to:
Line 2 Bloor-Danforth subway elements (power, signals, communications systems, and vehicles) that are at/or approaching end of life.
Facilities maintenance of garages, yards, carhouses and various other buildings (HVAC, roofs, structures, elevators, escalators, and plumbing).
Bus fleet with the majority now over halfway through its lifecycle.
The streetcar network will predictably be at risk within five to 10 years without capital funding commitments for rehabilitation.
2024 Asset Management Plan, Covering Report at p. 7
Overall funding, of course, must respond to both the existing system and service as well as growth. Discussions of “growth” focus politically on major new rapid transit lines, but this can sideline plans and funding for general increase in service quantity and quality across the network.
An important part of any Asset Management Plan will be recognition of future costs that will be triggered by system expansion of both rapid transit and surface networks. Only two years ago, Toronto agreed to take on the operating and non-lifecycle costs of the Eglinton line, but that did not last. In the short term, the Toronto-Ontario “new deal” includes funding for operation and maintenance of Lines 5 and 6, but not for expansion of the existing service.
The TTC has many plans, but several of these tie back to the Annual and 5-Year Service Plans. After all, it is mobility and hence service that the TTC provides, and medium to long range aspirations for service affect the entire organization. Service might sit an the heart of the chart below, but one would be hard-pressed to see this in a typical debate at the TTC Board or Council.
Over the years, a troubling aspect of TTC debates is that “service” comes last in the discussions and is always “subject to budget availability”. Rarely is there an aspirational view of the transit network and its future. A desire for more service can run headlong into the currently planned level of fleet and facilities growth.
Attempts to engage in such discussions trigger rounds of “we can’t afford it” or “not now, maybe later” that hamper a strategic approach to all TTC planning. The lead times to scale up parts of the system require sustained commitment. It is ironic that we are willing to wait a decade and more to get a new rapid transit line, but will not invest in the short term to enhance and expand the existing system.
The Plan’s primary function is asset management. It is not a forward planning document to pursue “what if” questions about possible transit futures, although it does acknowledge that current plans have implications. Only recently did Council grasp the effect of getting many new rapid transit lines built by Ontario, but with the expectation of local funding for operations. The Ontario-Toronto “new deal” delayed, but did not eliminate this problem. Running more service and maintaining more infrastructure costs money that fares will not cover.
Level of Service
In 2013, the TTC introduced its first 5-Year Corporate Plan with the vision: To be a transit system that makes Toronto proud. The next 5-Year Corporate Plan is due to be published in 2024 and forms part of an integrated planning and performance framework the TTC utilizes. This framework demonstrates how the goals, objectives and intended outcomes of the TTC can be achieved through the alignment of key business planning activities. In addition, the 5-Year Service Plan & 10-Year Outlook (2020-2024) identifies service-related improvements to public transit service in the city of Toronto. An updated version (2024-2028) is expected to be published in 2024.
The Service Plan also identify [sic] how the TTC is responding to growth requirements, meeting the challenges of changing ridership demands and meeting the financial challenges of maintaining existing service levels and upholding the state of good repair. Given the significant pending growth in the size of the transit portfolio, it should be noted that there will be an increase in funding pressure to sustain the existing level of service for the asset portfolio.
2024 Asset Management Plan, Covering Report at p. 5