Recently, I reported on a staff presentation to the February 10, 2016, Metrolinx Board meeting in which it was quite clear that the provincial agency is moving inexorably toward some form of fare-by-distance not just for its GO Trains, but for all rail modes that operate on their own right-of-way including subways and LRT. Bus Rapid Transit, although a common part of The Big Move as a “solution” in the 905, is not included as “rapid transit” in their proposals.
Metrolinx has now published the background technical paper to this presentation. This is the second installment in the fare integration review. Part 1 came out in September 2015.
For background information, see:
In previous articles, I noted a strong inclination by Metrolinx toward distance or zone-based fares, and this continues into the most recent paper. What is also troubling, however, is the difference between the backgrounders which have some detail about the workings and effects of a new fare structure, and the staff summary reports where this is all treated as a complex issue to be reported on at some future date. “Have patience”, the Board is told by staff, even though answers to some of their questions can be found in the detailed reports.
A chart from the September 2015 report is worth looking at again.

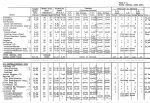
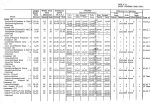
It is self-evident that any tests of fare effects, of the various sub-markets which might see higher or lower fares, and of revenue distribution models, could not possibly be conducted without an actual model with real numbers of riders and real fares attached to each type of trip they would make. However, even by February 2016, the staff presentation studiously avoids specifics and gives no hint of the degree by which fares might rise or fall. A related issue is that the tests used a “revenue neutral scenario”, one in which any reduction in one part if the revenue pie must be counterbalanced by an increase somewhere else.
This is the “we don’t want to pay more subsidy” view of fare integration where the “winners” are those who now face multiple fares, typically to use the TTC plus any other GTHA system, while those who now pay single fares within a system will be the “losers”. This fact has been hidden from public view throughout the exercise. We hear a lot about “fair” fares, but absent specifics, there is no way to decide which elements of “fairness” are included in the new formula.
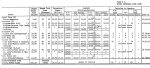
An element that emerged from the 2015 study and now forms an important part of the 2016 update is the concept of “service class”. This is a simplistic division of all transit services into three groups and three trip lengths. The groups such as “local” and “rapid” transit are defined by mode (bus or rail), not by the actual quality of service they provide. Indeed one might argue that the higher speed of “rapid” transit can be offset by the severe overcrowding and unreliability of the service. For the purpose of the fare model, only the nominal speed and presumed comfort of rail services counts. This is very much a GO-centric view of transit service.
Even GO is having its problems with comfort and crowding. For some time, the goals for service quality included the idea that 80% of peak period riders would get a seat. GO never attained this and the metric sat at 66% the last time it was reported, September 2015. This goal appears to have quietly fallen off the service targets GO seeks to hit for the obvious reason that it is not attainable without massive expansion of service beyond the point where latent demand always backfills any new capacity GO provides.
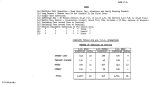
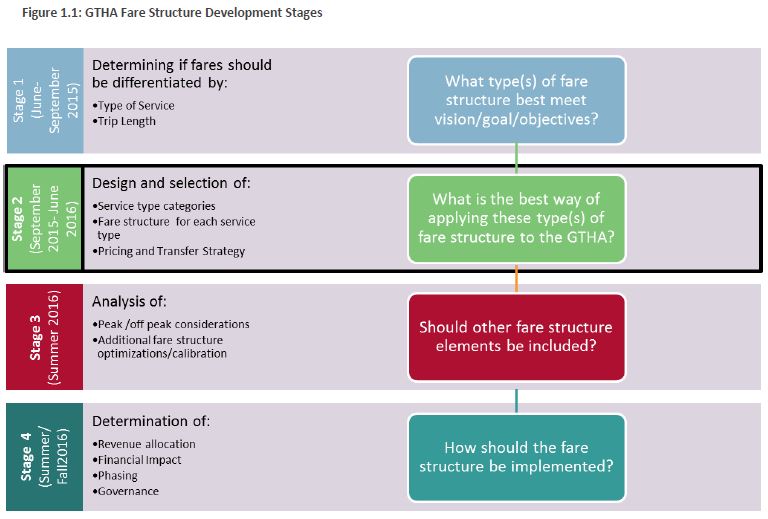
The overall fare integration study is expected to stretch into late 2016 according to the chart below. It is hard to ignore the absence of “rider effects” in the topics listed here.

However, a more detailed chart (Fig. 1.4) clearly shows that a “Preferred Option” would be recommended by Spring/Summer with the implication that any chance to debate and influence the choice has a limited window of the next few months. The Metrolinx Board is not scheduled to meet again until June 2016. Will they be faced with a fait accompli where staff have made all the decisions and the Board’s role is merely to nod in agreement? When will local Councils and transit agency boards have their chance to be heard? In the rush to get a new fare structure, will Metrolinx management do an end run around meaningful consultation at both the general public and political levels?
Continue reading →