Updated February 15, 2017 at 9:00 am: Per passenger values for revenue, expenditure and subsidy have been added on both absolute and inflation-adjusted bases.
Updated February 14, 2017 at 1:00 am: Inflation adjusted versions of the charts have been added to this article.
This morning’s Toronto Sun brought an opinion piece from Mayor John Tory about all of the wondrous new spending we would see in this year’s budget, and how our transit system would be better for it. Tory made several claims giving the impression that a great deal is happening, and that spending is just rocketing ahead under his leadership (not to mention TTC Chair Josh Colle).
Tory sets up a straw man argument with this claim:
Now there has been some misinformation out there about the 2017 budget and the TTC so I want to be clear and set the record straight. The 2017 budget does not decrease TTC service and it does not cut any bus or streetcar routes.
That is true as far as it goes, but the Mayor neglects to mention that the budget does not increase TTC service either. Indeed, if the TTC were actually able to use all of its bus fleet on bus routes, rather than making up for the shortfall in new streetcar deliveries from Bombardier, they would not have the budget headroom or staff to drive and maintain the additional service.
Tory continues by listing 10 key things the transit system will do with an added “investment” of $80m in 2017:
- Running 800 subway cars, 200 streetcars and 1,900 buses to transport 544 million riders this year.
- Providing funding to carry 1 million more Wheel-Trans passengers than last year.
- Giving more powers to Transit Enforcement Officers to help keep traffic moving, freeing up police resources for where they’re needed most.
- Buying 783 new buses.
- Finishing the rollout of Presto across the system.
- Upgrading signals on Line 1 so we can run subway trains more frequently and more reliably.
- Opening the subway extension to York University.
- Continuing the opening of the subway earlier on Sundays.
- Keeping the provision for kids to ride free on the TTC.
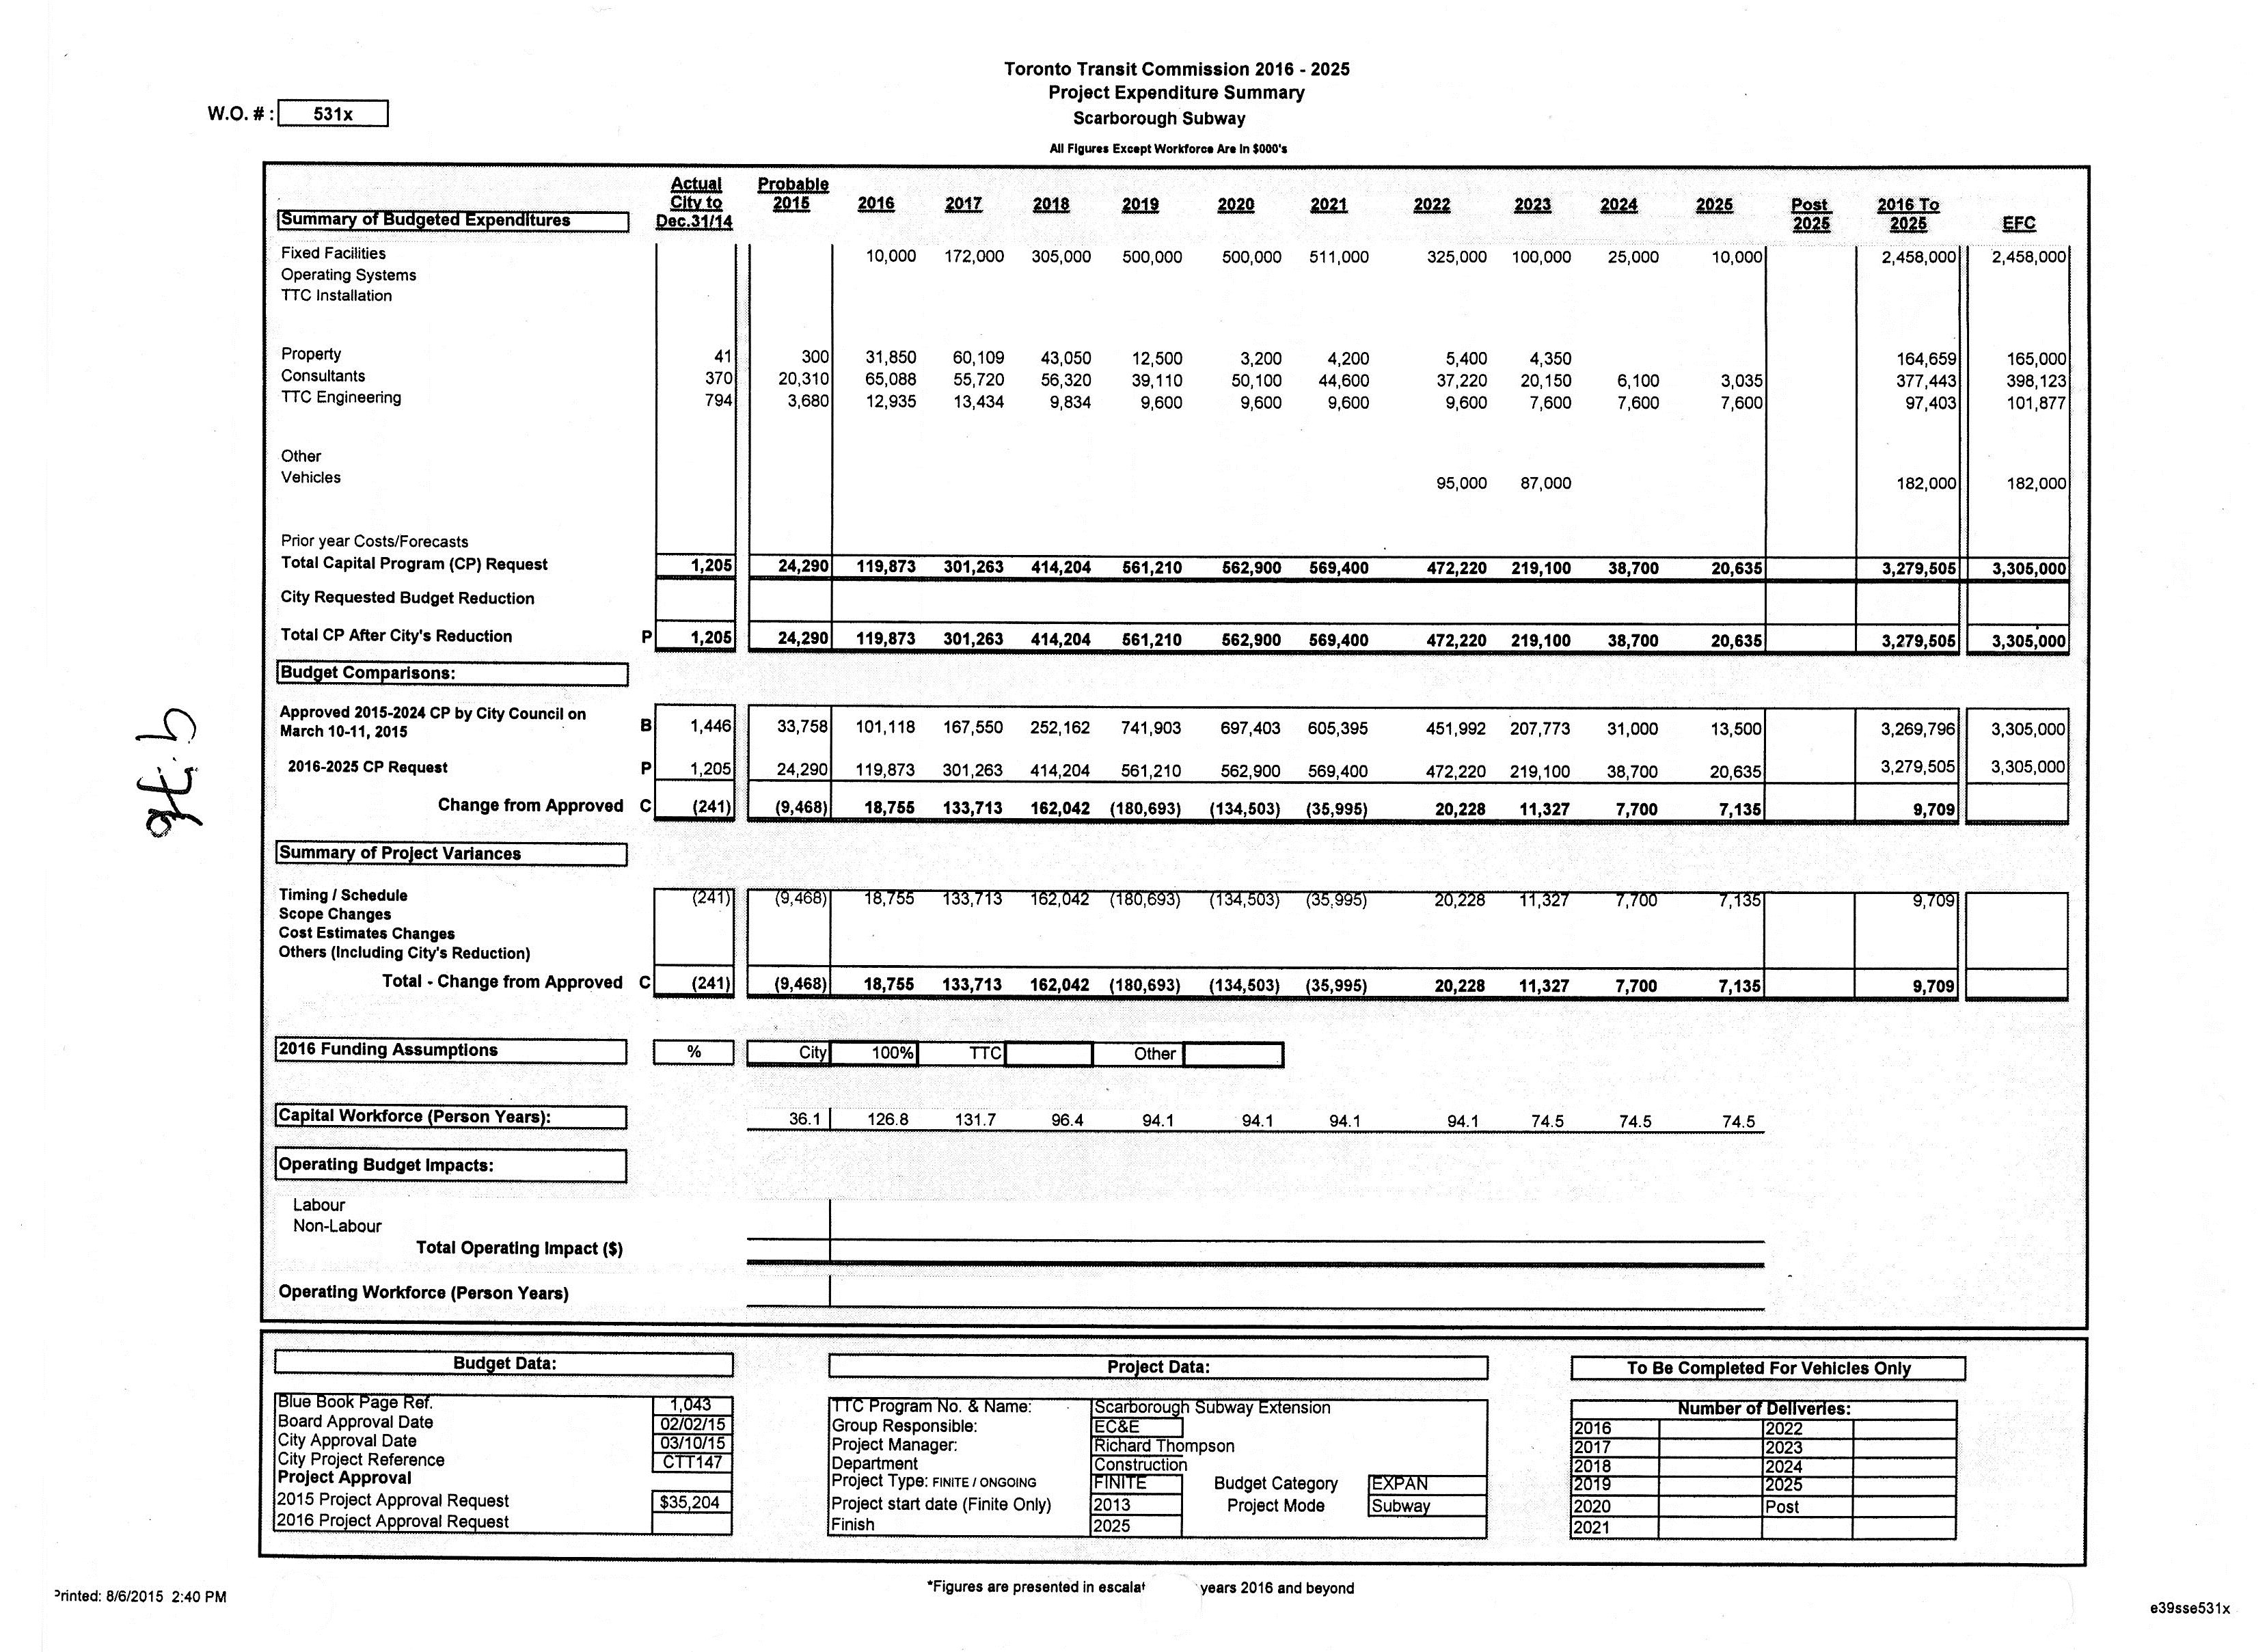
- Continuing work on the Scarborough Subway Extension.
Providing essentially the same level of service in 2017 as the TTC operated in 2016 is not an addition, it’s merely keeping the lights on. The budget contains no funding for service increases on the “conventional” system.
Wheel-Trans will see substantial growth in riding over coming years, and about $30m of the new money addresses that growth. Better WT service is long overdue, but don’t let new spending on that part of TTC operations hide the fact that regular bus, streetcar and subway routes will see no change. Indeed, crowding on the conventional system is cited by some advocates as a disincentive for people to move away from WT, or to use the conventional system for part of their journeys.
Added funding for Transit Enforcement is one of the few places where the TTC received funding for a net new service in 2017. However, looking city-wide, this is really only a transfer of duties from the police who get to show a saving in their budget. If we are serious about using transit constables for traffic management, the actual amount of spending needed will be considerably greater, and Toronto will have to take seriously a commitment to “transit first” on the roadways.
The TTC is not buying 783 new buses in 2017. The number is actually a bit over 300 according to the TTC’s 2017 customer charter (see Q4), and these are replacements for old buses that will be retired. They do not represent a net increase in the fleet to provide more peak service. Moreover, they are paid for from the capital budget, not operating, and the $80 million cited by Tory has nothing to do with this purchase.
Finishing the rollout of Presto. Oh dear, oh dear. Wasn’t that supposed to happen in 2016? Will the TTC ever have a serious discussion about fare options, the mix of subsidies and possible revisions to transfer rules, or will they simply operate as if people were still paying with tokens that have morphed into green plastic cards? During the 2017 budget debates, the TTC proposed that various discount fares could be abolished as a way to increase revenue and offset their deficit. This scheme was torpedoed by the Mayor, but the idea is still on the table and will likely resurface for the 2018 budget.
Upgrading signals on Line 1 for more frequent service? Again this is a capital, not operating, expense, and this project will not be completed until 2019 with better service to follow, eventually. That added service would entail a higher operating cost (and subsidy), and Toronto will have to pony up the funding on top of any other increases. None of the $80m has anything to do with this.
Opening the York University extension. Well, yes, although it actually does go to Vaughan, and Toronto is on the hook for paying to operate that line even in York Region. The net cost of this extension, after new fare revenue, is pegged at $7m in 2017 (mainly for startup costs) and a further $23m (for an annual total of $30m) in 2018.
Continuation of “early” Sunday openings on the subway, and associated early service on bus routes, is not an “investment”, but rather a continuation of an established service that nobody, at least until now, ever thought was threatened by budget cuts. This service began at the start of 2016, and so there is no marginal cost (year over year) to continue this in 2017.
Similarly retaining free rides for children does not represent a new cost for the 2017 budget, and hence no new “investment”.
And finally, the Scarborough Subway Extension, whatever one might think of it, is a capital project, not part of the operating budget. The funding allocated to it in 2017 is actually quite small because at this stage only planning and very preliminary design are underway.
Quoting the TTC’s CFO Vince Rodo, Mayor Tory claimed that
“$80 million is by a long shot the largest single year increase we’ve ever had”.
Sadly, that is incorrect on two counts. First, as I mentioned above, about $30m of that increase is for Wheel-Trans subsidy which is normally treated as a separate item when talking about TTC budgets. Conflating the conventional and WT increases makes the benefit look bigger than it really is.
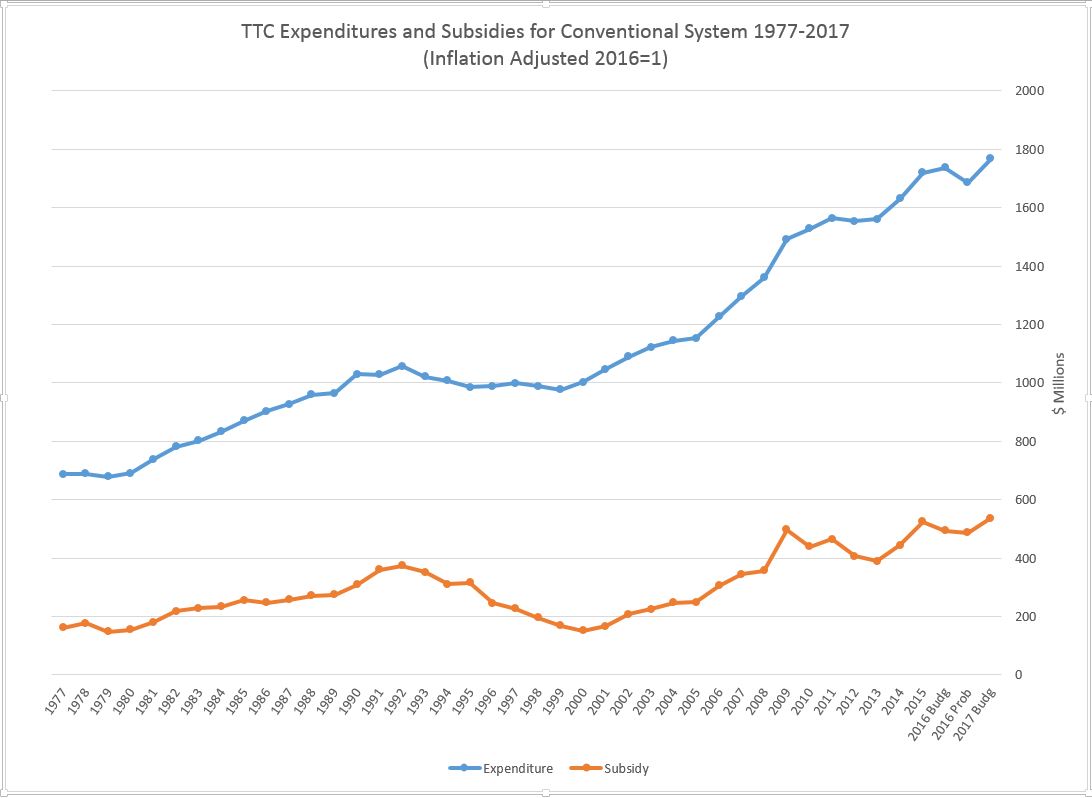
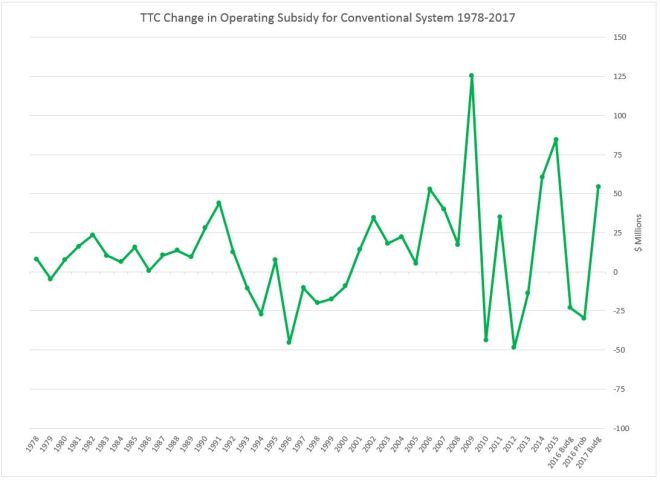
More to the point, however, the statement is simply wrong. The largest year-over-year subsidy increase for the conventional system was between 2008 and 2009 when the subsidy went up by $125.4-million. Why the big jump? 2009 brought in the Ridership Growth Strategy and a commitment to improved transit. This was undone during the Ford era and has only partly been restored under Tory.
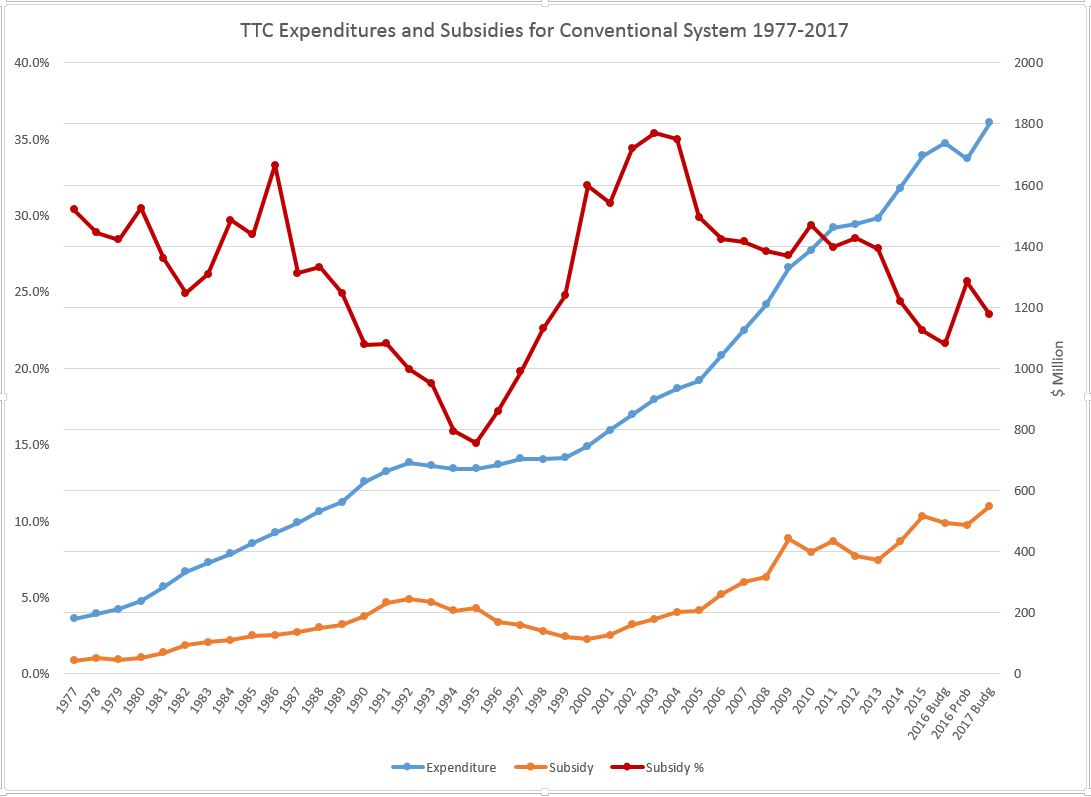
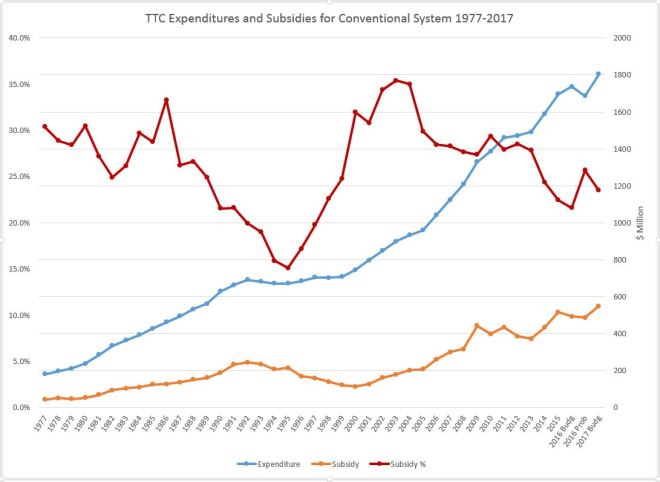
The chart below shows the growth in total operating expenses for the conventional system over the past 40 years (blue) together with the dollar value of the operating subsidy (orange) and the percentage of expenses covered by subsidy (red).
Two sets of figures are shown for 2016:
- The original set are the approved City Budget numbers.
- The second set is the “probable actual” results reported by the TTC.
Note the drop in projected expenses for 2016 compared with actual results for 2015. This is a result of the cutbacks imposed to rein in costs in the face of less than anticipated revenue. This is the largest year-over-year decline in TTC spending over four decades, and it is not a tribute to the City’s commitment to transit.
There is a very large projected growth in expenses for 2017 relative to the 2016 budget ($67.5m) and even more relative to 2016 probable ($108.9m). However, little of this will show up as additional service on the street. This situation is a bizarre, but not unexpected side-effect of a budget year in which cut-cut-cut is the only topic of interest at City Hall.
TTC management have planned to bring out a “Ridership Growth Strategy” report, but this is on hold due to budget concerns. A constant problem for transit and other budget areas at the city is that we rarely hear about what could be done, and how much this would cost to implement, only that it is time, again, to cut spending in the name of “efficiency”.
One important point about 2015 is that the operating budget included some “capital from current” spending that was stuffed in at the last minute to accommodate Mayor Tory’s announcement an accelerated bus purchase. This shows up as an “operating” subsidy although it really is a capital expense. Ironically, the TTC has never received full funding to actually operate these extra buses.
Sources:
- 1977-2015: TTC Annual Reports
- 2016 and 2017 Budget: City Budget passed by Executive Committee
- 2016 Probables: TTC CEO Report
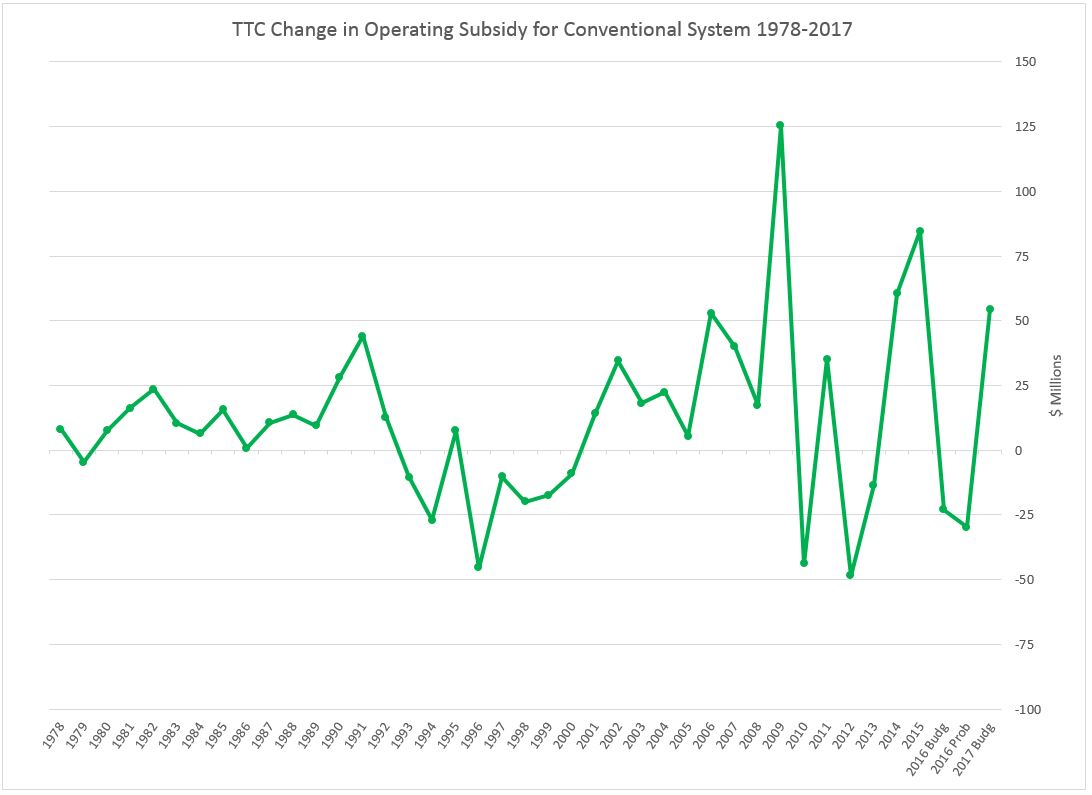
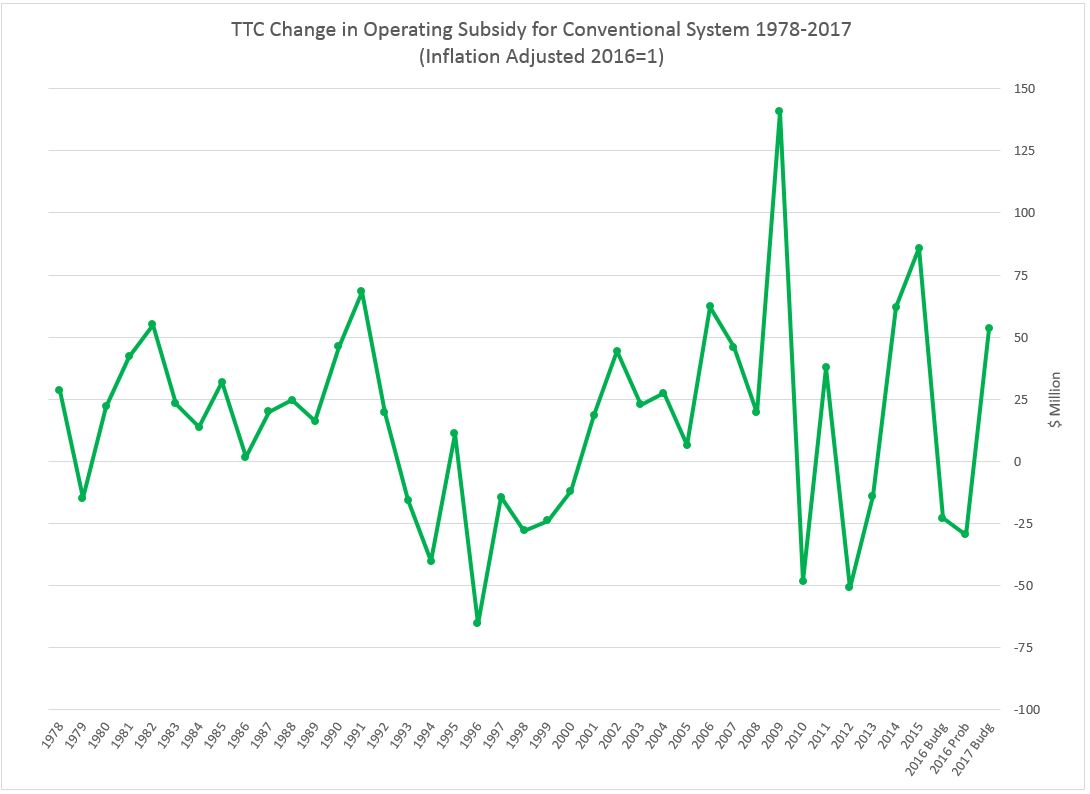
The annual changes in subsidy levels have bounced around over past decades with a big drop for the recession of the early 1990s.
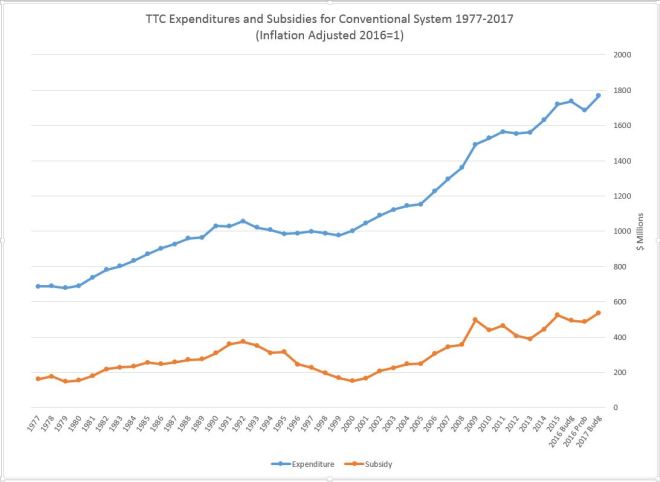
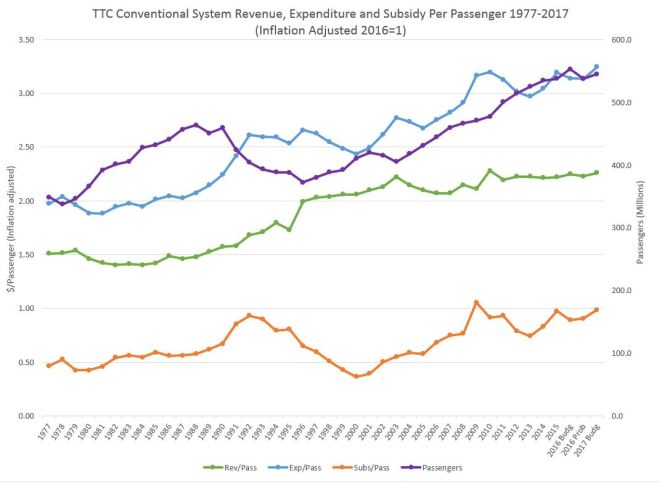
The same data with values adjusted for inflation using the Statistics Canada CPI and 2016=1:

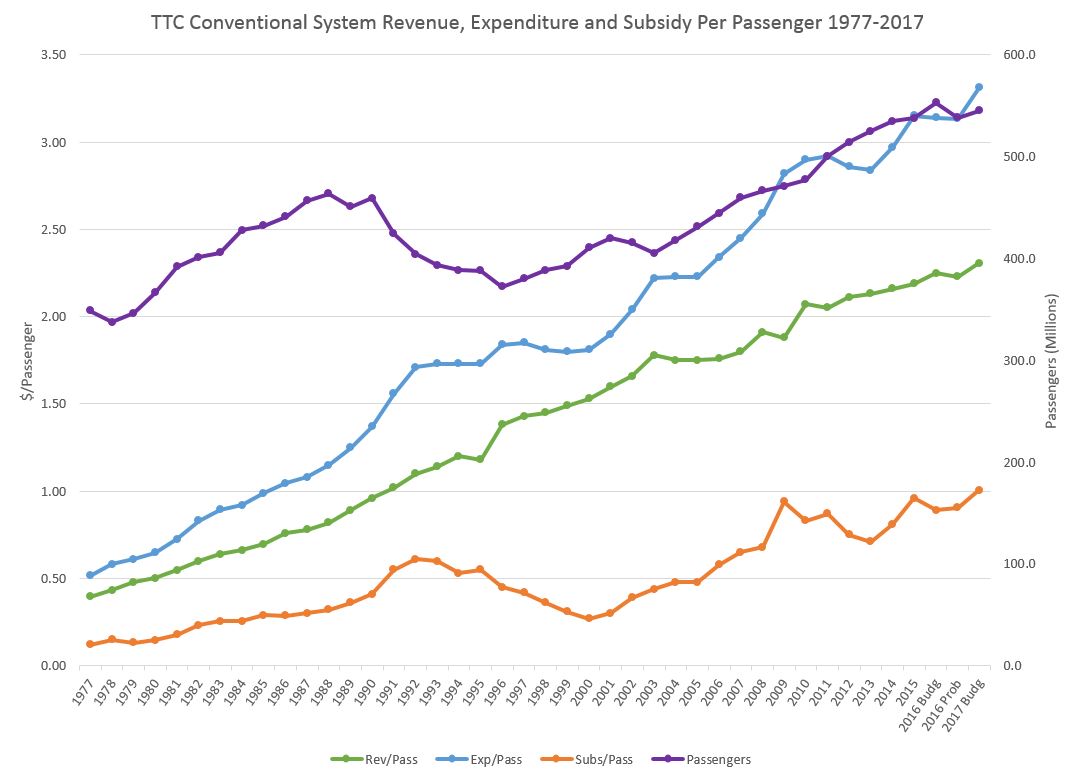
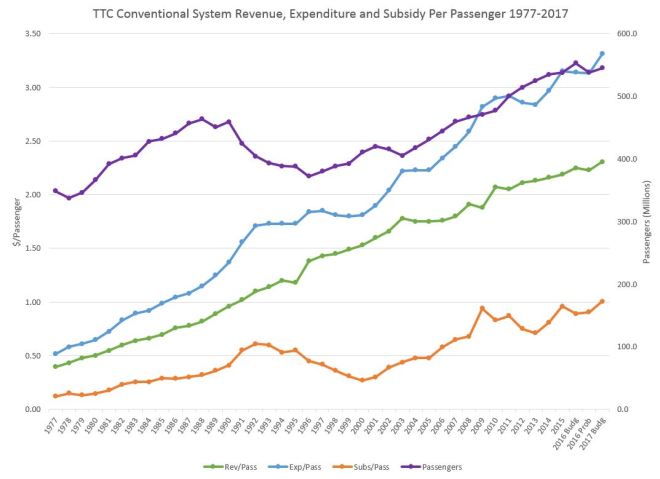
When the financial information is stated on a per passenger basis, we can see both the changes in the cost of providing service and in the subsidy each trip receives.
The chart below shows the total passenger count for each year (purple) and the associated per passenger values of revenue, expense and subsidy. Note that “revenue” includes miscellaneous items such as advertising, commuter parking and rentals that collectively amount to about 4% of TTC income.
The passenger count peaked in 1988 at 463.5 million, and then began a decline through the 1990s recession bottoming out in 1996 at 372.4m. The 1988 peak was not overtaken until 2008 with its ridership of 466.7m.
Expenditures per passenger (blue) climbed generally, but they dipped in the late 1990s, the Harris era with provincial funding cutbacks, and the Ford era.
Revenue per passenger (green) has climbed consistently with a few dips corresponding to fare freezes.
Subsidy per passenger (orange) fell through the 1990s bottoming out in 2000, and then grew to a peak in 2009 corresponding with the introduction of the Miller-era Ridership Growth Strategy. The value then fell through the Ford years, but is now back to a record level (without allowing for inflation) in the 2017 budget of $1.01 per passenger.
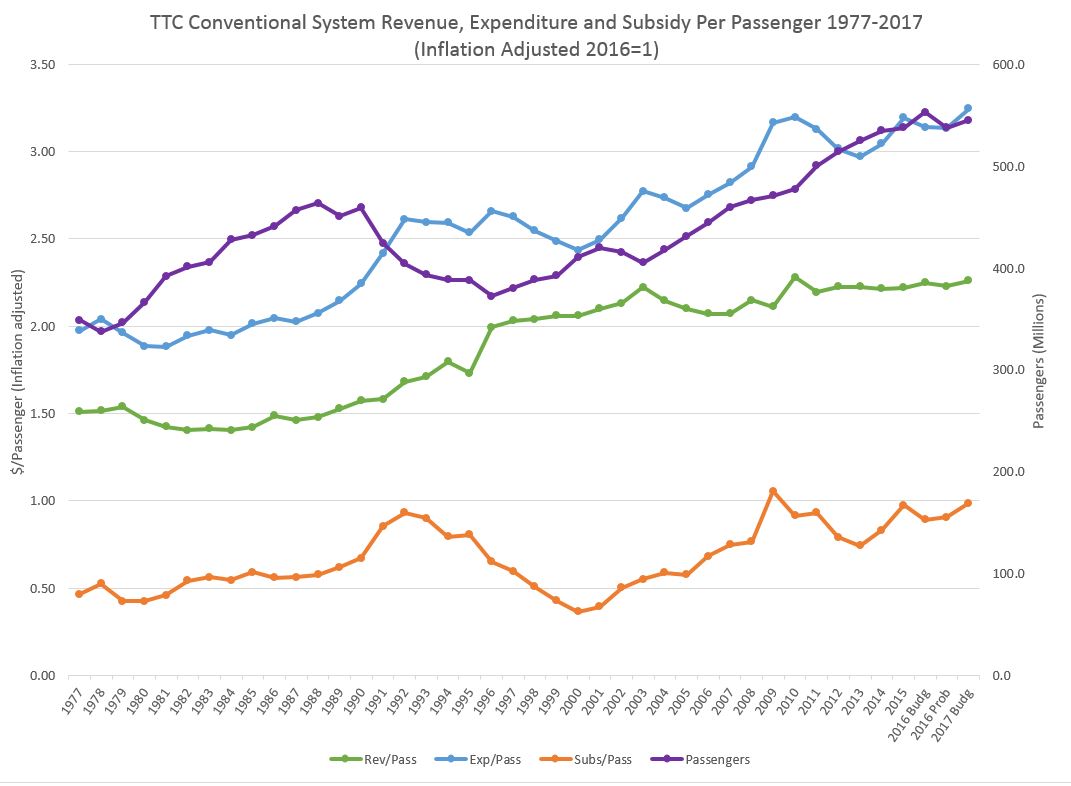
When these data are adjusted for inflation, the picture is somewhat different.
Expenditure per passenger has had periods of growth, notably the late 1980s and the first decade of this century with a peak corresponding to the RGS implementation. The value then fell during until recent years.
Revenue per passenger took a big jump at the point where provincial subsidies were eliminated in the 1990s, but the value has only grown slowly over the past two decades when inflation is considered.
The subsidy per passenger bottomed out in 2000 and hit a high in 2009 (RGS), a point from which it has not yet recovered although the numbers have improved since a recent low point in 2013.
The charts above are available as a PDF.