With Toronto’s Congestion Management Plan in the news, we hear about various ways to improve the movement of cars and, oh, by the way, maybe speed transit vehicles too. Toronto talks a lot about “transit priority” but this more often means giving transit vehicles the leftovers, the spare time that can be shaved at some locations from competing traffic, not absolute priority for transit vehicles.
This shows up particularly where transit vehicles have a dedicated lane, but they must wait patiently while other traffic, typically left turns, gets out of the way. This has the perverse effect of making transit slower particularly when combined with the “double stop” effect of farside stops. At these locations, the nearside space a stop would normally use is occupied by a left turn lane, and traffic in that lane has first claim on a green cycle.
Two routes with this as a near-standard stop configuration are 510 Spadina and 512 St. Clair. The Spadina car only recently returned, and I will leave comparative analysis of bus and streetcar operation there until more data have accumulated. A preliminary look is not complimentary to the streetcars because, unlike them, the buses are able to combine waiting for green signals with loading passengers.
On St. Clair, streetcars returned in Fall 2024. This article reviews tracking data for March 2025. In brief, a common situation along the route is that streetcars spend more time waiting at intersections than they do serving stops once they cross to a farside platform. The traffic signals are not organized to favour streetcar movements, and the configuration with farside stops is counterproductive.
To be fair, one cannot simply throw a red signal in front of cross traffic every time a streetcar appears as this will affect both auto and pedestrian crossings that require a minimum time. When both the St. Clair and Spadina lines were designed, a concern was the frequency of streetcar service and the high probability that there would always be a streetcar demanding priority. However, the larger Flexity cars combined with TTC service cuts makes this claim less valid.
Pre-emptive streetcar signals could be challenging at some locations, but there is the separate issue of timing of the phase for left turning autos. Should it come before or after streetcars are allowed to cross the intersection? Streetcar-only phases are only provided at some locations on Spadina where cars are turning across traffic lanes, but not for through movements. There is a streetcar-only phase at Lansdowne and St. Clair westbound, but otherwise left turning auto traffic always has priority.
A related problem lies in TTC’s glacial streetcar speeds through special work which would require a lengthy transit phase to allow streetcars to clear intersections on Spadina with streetcar junctions. With streetcars crossing on the shared north-south green, this does force motorists to wait for streetcars to get out of their way.
The data on St. Clair show a common pattern: streetcars spend more time waiting to cross intersections than they do serving the farside stops. They may operate in their own lane, but the combination of farside stops and signal design works against transit operations. This has implications for the soon-to-open “LRT” lines on Eglinton and Finch.
If we are not prepared to give transit vehicles true priority over cars, how do we expect to attract more riders to the system and, in theory, reduce overall road demand?
The remainder of this article describes the methodology behind my analysis and shows the behaviour at individual intersections along St. Clair.
Updated April 24, 2025 at 11:30 pm: TTC responses to my questions have been added at the end of the article. One questions remains outstanding.
Back in 2018, the City of Toronto bought the lands southwest of Kipling Station formerly known as the CP’s Obico Yard. This land was to be used for a new Maintenance and Storage Facility for Line 2 trains in anticipation of:
Space at Greenwood being reallocated to serve the Downtown Relief Line,
Greenwood’s layout being inappropriate for permanently coupled six-car trains,
The planned increase in the Line 2 fleet to accommodate both extension and increased service.
The existing Line 2 fleet comprised 372 T-1 subway cars dating from 1995-2001, and they will reach the end of their 30-year design life starting this year. The cars are in married pairs that can be easily uncoupled from their trains. Greenwood’s layout is based on short maintenance bays, not on six-car trains. (When Greenwood was designed, operation of four-car trains was common.) Back in 2018, the expected new trains for Line 2 would be similar to the TRs on Line 1 running in permanent six-car sets.
The original plan was to buy 62 New Subway Trains (NSTs) to replace the T-1 fleet. This would give enough trains to operate Line 2 through to Scarborough, albeit likely with a short turn during peak periods at Kennedy Station. The NST order has been scaled back to 55 trains (the number required for the existing Kennedy-Kipling line) with extras to be purchased as part of the Scarborough and Yonge North subway projects.
The NST design has changed to retain the style of the 6-car TRs with open gangways, but the cars will come in married pairs. Each end of the train will have a pair with one cab plus hostler controls on the “blind” end of the pair. The middle pair will have hostler controls at both ends. This will allow the 6-car sets to be broken up for movement of individual pairs in yards and shops. (See: TTC Requests Proposals for New Line 2 Trains and Signalling)
The Ontario Line replaced the Relief Line, and will have its own fleet and MSF at Thorncliffe Park eliminating Greenwood as its home base.
These factors led to a rethink of Greenwood Shops and the need for a new yard west of Kipling Station.
In 2022, the City bought property east of the Western Yard lands at 780 Kipling as a site for their next bus garage, although current plans will not require it immediately. The two properties are adjacent, but are separated by the link between the Metrolinx Lakeshore West corridor to the CPKC Milton line at Kipling Station.
TTC proposes to use this site not just for a garage, but to consolidate other operations that are now in leased space around the city.
The map below shows the two sites. The Milton corridor is at the upper left, and Kipling Station is out of frame at the upper right.
Source: Figure 1 from “MASTER PLAN – STUDY OF KIPLING INDUSTRIAL LANDS” TTC RFP March 2025
There are two RFPs (Requests for Proposals) on the street for consulting services:
The Master Plan for the Kipling Industrial Lands
Consultant services for design of the proposed Western Yard
The Master Plan work entails looking at the various possible uses for the site and how they would be accommodated.
The Western Yard RFP includes two documents from the Line 2 Capacity Enhancement Program as reference information. Both were prepared by HDR and Gannett Fleming.
Greenwood Yard Workflow and Processes Analysis, Final Report, June 13, 2023
Western Yard Concept of Operations & Maintenance Report, Draft, January 24, 2025
The Need For Another Yard
Although it may seem like the distant past, only six years ago the subway system was bulging with passengers, and planning focused on how to accommodate more riders. This led to proposals including new trains, automatic train control and a general increase in capacity of both Lines 1 and 2. The services now operating on Lines 1 and 2 are not yet back to pre-covid levels.
Line 1 Time Period
Trains (Headway) January 2020
Trains (Headway) April 2025
Capacity Difference
AM Peak
65 (2’21”)
56 (2’52”)
-22%
M-F Midday
42 (3’49”)
35 (4’34”)
-20%
PM Peak
65 (2’36”)
54 (2’59”)
-15%
M-F Early Eve
46 (3’30”)
38 (4’11”)
-20%
M-F Late Eve
32 (5′)
26 (6′)
-20%
Sat Afternoon
42 (3’41”)
34 (4’34”)
-24%
Sat Early Eve
30 (5′)
30 (5′)
Nil
Sun Afternoon
35 (4’20”)
34 (4’34”)
-5%
Sun Early Eve
30 (5′)
25 (6′)
-20%
Source: TTC Scheduled Service Summaries. Note that M-F services include trippers and gap trains.
Line 2 Time Period
Trains (Headway) January 2020
Trains (Headway) April 2025
Capacity Difference
AM Peak
46 (2’21”)
42 (2’38”)
-12%
M-F Midday
33 (3’20”)
30 (4’04”)
-22%
PM Peak
43 (2’31”)
34 (3’23”)
-34%
M-F Early Eve
29 (3’42”)
25 (4’52”)
-32%
M-F Late Eve
20 (4’52”)
19 (5’23”)
-11%
Sat Afternoon
26 (4’15”)
26 (4’15”)
Nil
Sat Early Eve
19 (5’30”)
19 (5’30”)
Nil
Sun Afternoon
22 (4’52”)
22 (4’52”)
Nil
Sun Early Eve
20 (4’52”)
19 (5’30”)
-13%
Source: TTC Scheduled Service Summaries. Note that M-F services include trippers and gap trains.
TTC expects to be back to the pre-covid peak service in 2030. Line 2 will require 46 trains plus 7 spares (at TTC’s minimum of 15%) for a total of 53, or 9 spares (at 20%) for a total of 55. Spares include both trains ready for deployment as replacements or extra service (ideally 4), as well as those in maintenance programs.
Service more frequent than 140 seconds will not be possible on Line 2 until it fully converts to automatic train control in the early 2030s. The Scarborough extension’s opening date is currently claimed to be 2030, although whether like so many other projects it will come in late is unknown. Extra trains for that extension, and for ATC conversion will be needed starting in 2030.
Thus far, this article has covered basics and readers might ask about the title’s question – will a western yard ever be built?
The Western Yard design RFP incorporates the Greenwood Yard study which speaks of construction of a new yard originally planned for 2034, but now pushed to 2038 or beyond by the TTC. No reason for this is given. No estimate of construction time, and hence availability of the new facility, is given either.
Can Greenwood handle the transitional state between its current role and various steps on the way to complete delivery of the new trains, not to mention a new yard?
Back in 2018, the transition looked relatively straightforward with a planned new yard to provide capacity. Now this is constrained by several factors even allowing for the DRL/OL fleet shift out of Greenwood. There is no provision in the TTC’s 10 Year Capital Plan for construction of a western yard, only for preliminary work such as design.
The issues go beyond space for train storage. They include capacity for ongoing servicing and maintenance, major overhauls, spare parts storage and workforce scheduling. For many years, the TTC had a surplus of space and maintenance capacity, but as the number of active trains grows concurrently with delivery of new trainsets, much more will be expected from staff and facilities.
This situation arose in part because TTC management opted to defer the new yard with no acknowledgement of its critical role as the system grows. Simultaneously, contracts for new trains and ATC conversion also were pushed out into the future. This delayed capital expense, helped to keep taxes down, and left headroom for other projects.
All of this bumps into assumed go-live dates for the Scarborough extension, automatic train control and headways below 140 seconds. The pandemic pushed many dates for transit’s growth into the future thanks to lost riding. However, if events drive demand up faster than the TTC’s projections, they will not be able to handle the pressure. Considering that the City of Toronto often cites transit growth as an essential part of fighting traffic congestion, the City and TTC plans could be out of whack.
Fare evasion and enforcement are a common topic at TTC Board meetings, and for some time the sense has been that “there’s gold in them thar hills” among Commissioners. Debates can run for hours on what efforts should be launched, what policies for limited toleration there should be, and how much more can be spent on enforcement.
A fundamental flaw in these debates is that the presumed gross losses to fare evasion, based on field studies and estimates, is $140-million annually as reported by the City of Toronto’s Auditor General in March 2024. However, the TTC’s ability to recoup this missing revenue varies from place to place on the system because there are multiple ways to avoid paying.
The most obvious case is simply to avoid tapping on to surface vehicles when boarding.
Subway stations had “crash gates”, so-called because they were originally intended for cases where large volumes of riders needed to enter or exit quickly, notably for transfers to/from subway shuttles. To serve riders who did not have machine readable fares, these were left open for riders to enter on an honour system.
Where riders do pay by dropping money in a farebox (either on a bus or in a station), there is no guarantee they will pay the full amount owed.
Riders can walk into most subway stations unchallenged through bus and streetcar loops.
Much of the TTC’s focus has been on the first case, a rider who does not “tap on” to a vehicle, and until quite recently enforcement was directed at streetcars because of their multiple, unmonitored entrances.
TTC recently closed the crash gates so that riders wishing to pay cash must do so either at a fare vending machine. Ticket and token users (while these modes are still accepted) must use the station collector’s farebox, although whether anyone is present to monitor them varies by location and time of day. The estimated loss from open crash gates was $14.2-million per year, and from underpaid cash fares was $9.1-million. This leaves $116.7-million in other types of fare evasion.
In the 2025 Operating Budget, the TTC allocated $2.6-million for 69 additional fare enforcement staff. This is a part-year figure, obviously, as this only pays $37.7-thousand per employee. The anticipated new revenue is $12-million in 2025, and so the recovery ratio is about 4.6:1. That is a good return especially if it can be sustained.
There is no guarantee that hiring more inspectors will necessarily produce the same rate of return. A further problem is that with fares frozen, or increasing slower than wages, the cost of inspectors will go up faster than the recovered fare revenue.
New inspectors will be deployed to check riders getting off of buses in the paid areas of subway stations where inspection is easier than attempting on-board checks, especially on crowded vehicles. Absent fare inspection across the system, there are some types of evasion that will persist. The full estimated losses to evasion will never be recovered, and the implication that this amount would be available as new revenue is, to be kind, misguided.
Much information about evasion and enforcement is available in published reports, but this is not the only way the TTC spends money or foregoes revenue. Other areas do not get a comparable level of attention by the Board:
The foregone revenue due to fare freezes and below-inflation increases.
The cost of achieving standards to attract more riders to transit.
The effect on service quantity and reliability through constraints on maintenance budgets.
Even when these are discussed, the topics are considered in isolation.
In January 2025 as part of the budget approval, the TTC Board voted to establish a Strategic Planning Committee with details to come back for consideration in February. It is now April, and there is no sign of the committee. Previous attempts by members of the Board to increase their participation in planning and budgets have been sandbagged by inaction. Is this a repetition? Is the Board actually willing to perform its oversight role?
The City of Toronto claims to be pro-transit with a strong desire to attract more riders out of their cars. This is not echoed by the planned funding even at the “nice to have” level to see what budgetary effects might result.
The 2026 Budget work will begin in mid-year, and if the Board expects to have any input beyond the most superficial level, now is the time for those discussions and the review of alternatives to occur. So far, there is little sign that this will happen, and the budget will land with little opportunity for substantive change.
We will continue to hear about fare evasion, that shiny, spinning disco ball that diverts attention from most other issues. Some added revenue may be found over time, but a dedicated program to improve the transit system requires more than fare enforcement can provide.
The TTC and Toronto have many policy areas where decisions affect revenues and costs. Fare evasion and enforcement is only one of these. Some decisions, notably about the amount of budgeted service and maintenance levels, never come to the TTC Board for debate, let alone as a set of options ranging from “nice to have” to “absolutely must have”.
It is quite clear that funding for transit capital and operations will not come easily with the many economic pressures Toronto faces, and that was so even before the launch of a trade war and its potential effect on government revenues and priorities.
The TTC needs to discuss strategy for its future and understand what might be possible so that alternatives aspiring for better transit are on the table, not swept out of sight. That’s what a Strategic Planning Committee is for, and why the TTC’s failure to create one is so disheartening.
The TTC will make several service changes on March 30, 2025. Most of the changes will increase the frequency of service, but in some cases there are reductions. There are also a few cases where the new schedules adjust travel times, but the frequency is unchanged.
Updated March 27, 2025 at 10:15am: The detailed spreadsheet showing changes in headways, travel times and vehicle assignments is now available.
Updated March 28, 2025 at 11:15pm: Erroneous entries in the first/last trip table that were copied from the TTC’s service change memo have been updated with information from the electronic version of the schedules (GTFS) on the City’s Open Data site.
This article reviews the behaviour of service on 512 St. Clair during the first two months of 2025. This period was marked by an intense snow storm in mid-February that left many transit routes in disarray thanks to poor snow clearing.
Updated Mar. 21, 2025 at 10:30pm: The service chart for February 12, 2025, the first of the two major snow storms, has been added to this article.
Updated Mar. 22, 2025 at 1:00pm: Detailed charts of headways and travel times for February 12, 2025, have been added showing the consistency of travel times along the route even though headway quality deteriorated through the evening due to bunching.
The typical problem on four-lane roads was that snow was not removed to the curb causing parked cars to foul the streetcar tracks. Despite streetcar lines being “Snow Routes”, the signs were little more than decorations. The oft threatened but rarely practiced removal of cars for proper clearing did not occur, and some snow/ice banks remained until they eventually melted. Delays for blocked service occurred repeatedly well after the storms.
Another common problem was the absence of breaks in windrows (ploughed snow banks) at stops that lasted weeks after the snowfall. A few special cases had problems that were not addressed:
Where a street had permanent curb lane installations such as bump-outs for loading zones at stops, a windrow would be ploughed separating the streetcar lane from the waiting area making entry and exit from cars difficult, dangerous and in some cases impossible.
Where a bike lane occupied the curb lane, there would be a windrow between the streetcar and bike lanes blocking transit access.
While the City is officially responsible for snow clearing, the TTC was noticeably silent on a critical issue of operational reliability and passenger safety. They talk a good line about “safety”, but here, in a real crunch, the TTC did nothing beyond pleading by press release with motorists to not block the tracks.
The 512 St. Clair cars run in reserved lanes on a wider-than-usual Toronto street, and snow clearing was much less of an issue for them. Looking over the two-month period, we can see the benefit of a clear, protected right-of-way when many other routes were snarled or inoperative thanks to parked cars.
St. Clair is a relatively short route running between Yonge Street (St. Clair Station) and Keele Street (Gunn’s Loop). It loops through St. Clair West Station underground. In theory, this should provide four points — the two termini and the midpoint at St. Clair West both ways — where service could be regulated easily. Actual headway data show highly erratic service even during the pre-snow period.
By contrast, travel times along the route were consistent, with only small variations thanks to the storm, indicating that the snow was not a major problem. Of course, with a reserved lane, the TTC’s favourite chestnut about “congestion” could not be blamed for headway problems.
The charts in this article show both the travel times and headways (spacing between vehicles) for 512 St. Clair in January and February 2025, as well as detailed charts for specific days.
This article was originally published with a title of “February”. It has been changed to “March”.
The TTC’s Audit & Risk Management Committee will meet on March 24 to discuss several items. The agenda includes:
TTC Internal Audit 2025 Audit Plan and Departmental Evaluation
City of Toronto Auditor General’s Report on TTC Non-Union Workforce Planning and Management
There is also a confidential update on the Fare Compliance Action Plan, but no hint of what this might entail.
The 2025 Audit Plan includes four areas for review including:
A review of the TTC’s customer-centric initiatives, performance metrics, and public reporting practices to ensure alignment with customer needs, operational best practices, and global transit standards.
A review of processes and controls over maintenance and rehabilitation of subway tunnels.
Follow-up reviews include:
[…] implementation of various third-party Hydraulic Leak Investigation Recommendations
The Auditor General’s report covers many aspects of employee management including issues with retention, succession planning, employee satisfaction and complaint handling. There are profound problems with lack of confidence in the internal complaint handling process.
Departing employees gave very negative marks to the management and culture at TTC, and yet for the period from 2016 to 2024 there was no analysis or reporting on data from exit interviews. This is not surprising considering that the CEO during much of this time was not noted for his open, collegial manner, and critical reviews might have been embarrassing.
The Auditor General is silent on the number and cost of “resignations” that were accompanied by buy-outs and non-disclosure agreements that occurred throughout Rick Leary’s tenure as CEO. A difficulty in attracting staff would also be affected by a “poisoned work environment” at TTC which became fairly common knowledge.
I was deeply troubled by the Auditor General’s report because it reveals an organization with widespread problems in employee attitudes, and by extension a dysfunctional management-employee relationship. Long-time TTC watchers have been aware of issues, although getting comments on the record has been challenging. The TTC Board should be concerned at how this situation developed on their watch, and how complicit they are in allowing this decline. Any incoming CEO will face challenges to rebuild the esprit de corps within the TTC, on top of the many other problems our transit system faces.
The TTC has announced that effective Monday, March 17, fare inspection will occur on bus routes. However, unlike the streetcar system, this will be done at locations where bus passengers enter subway stations at fare-paid interchanges.
To maximize efficiency, inspections will be carried out on bus platforms at integrated stations where customers could be required to show proof-of-payment between exiting buses and entering the subway system.
Fare inspection on board buses is more challenging than on streetcars due to tighter circulation space, and on both modes is particularly difficult on crowded vehicles. A further wrinkle will be added when the new Lines 5 and 6 open because their cars have no on board fare equipment, and riders are expected to “tap on” using machines on platforms at surface stops unlike existing streetcar lines where riders can tap as they enter vehicles.
This type of inspection already occurs at streetcar/subway interchanges. While the tactic is “efficient”, it will not address fare evasion for trips that do not end at a station. The TTC regularly cites a $140-million annual loss to evasion. They give no estimate of the proportion of losses bus-to-subway transfer trips represent, nor the net revenue they expect to obtain after allowing for the cost of inspectors.
The TTC work signup is now in progress for the schedule period starting March 30.
It includes a signup for the Eglinton LRT for non-revenue simulation training.
Now if only we could get Metrolinx to give a clear indication of an opening date. They did once claim that there would be a three-month pre-opening period. We will see just how long “three months” is.
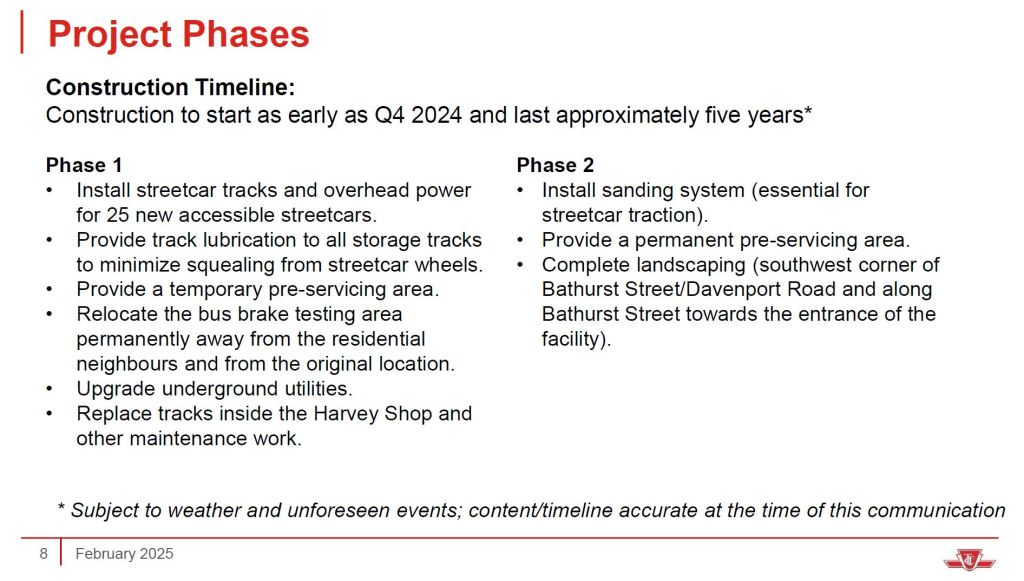
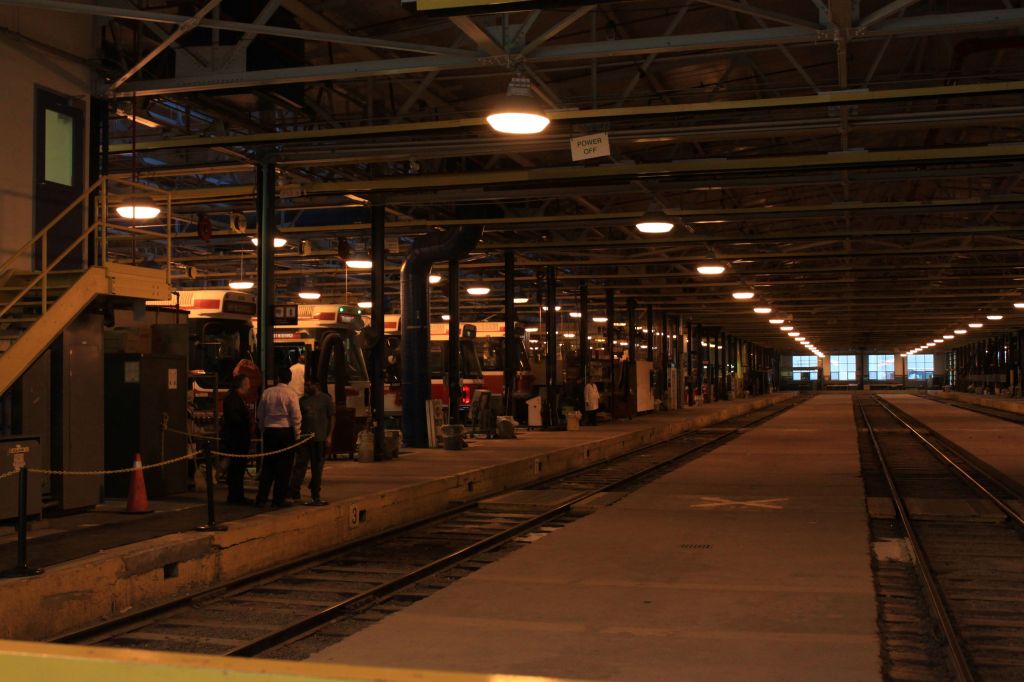
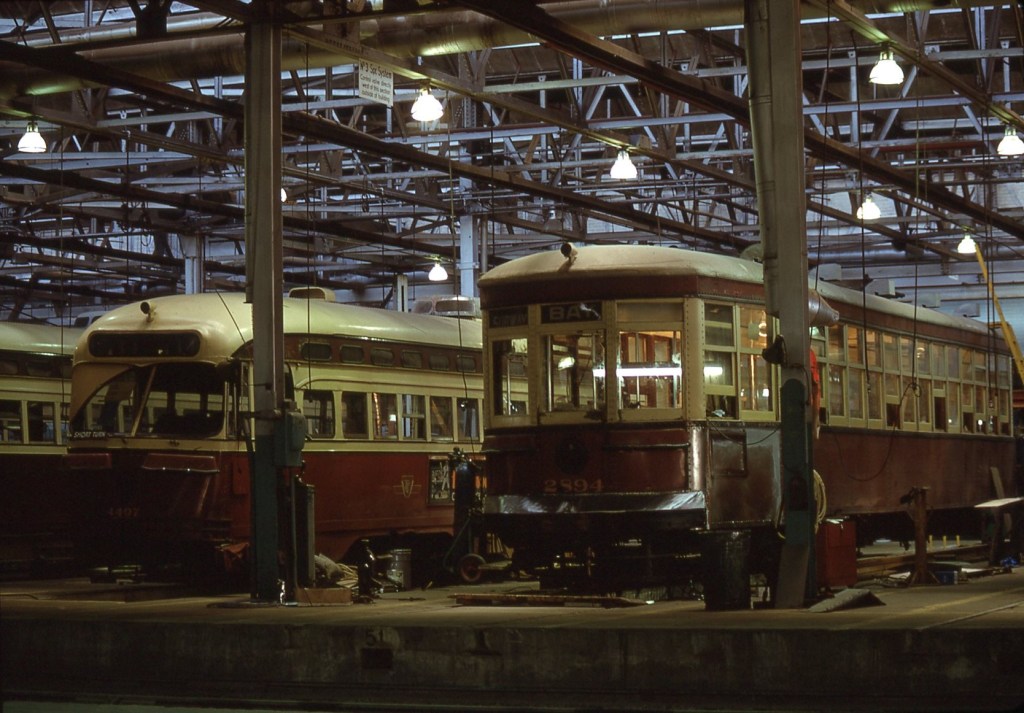
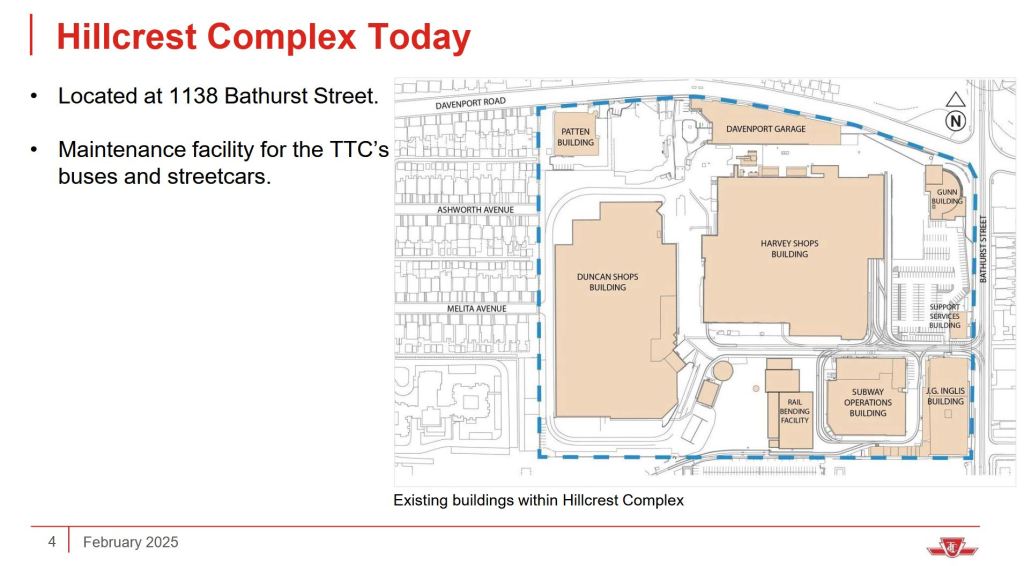
The project to reconfigure Harvey Shops at TTC’s Hillcrest facility was formally launched today. The work involves rejuvenation of the 100-year old property so that it can host up to 25 streetcars serving 512 St. Clair and, at least to some extent, 511 Bathurst greatly reducing dead-head time from carhouses for these routes.
This change in use is triggered by the new longer cars and the shift of major streetcar maintenance to Leslie Barns which is designed for them. Hillcrest was built in an era of Peter Witts, later PCCs, that are half the length.
This project is long overdue because the extra capacity is needed for streetcars to be delivered over the coming year. The situation is compounded by the loss of capacity at Russell Carhouse where major reconstruction is still incomplete. The TTC has improved overnight streetcar service as a means of “storing” surplus cars, although this has the added benefit of generating new riding and providing more convenient service for users of the night routes.
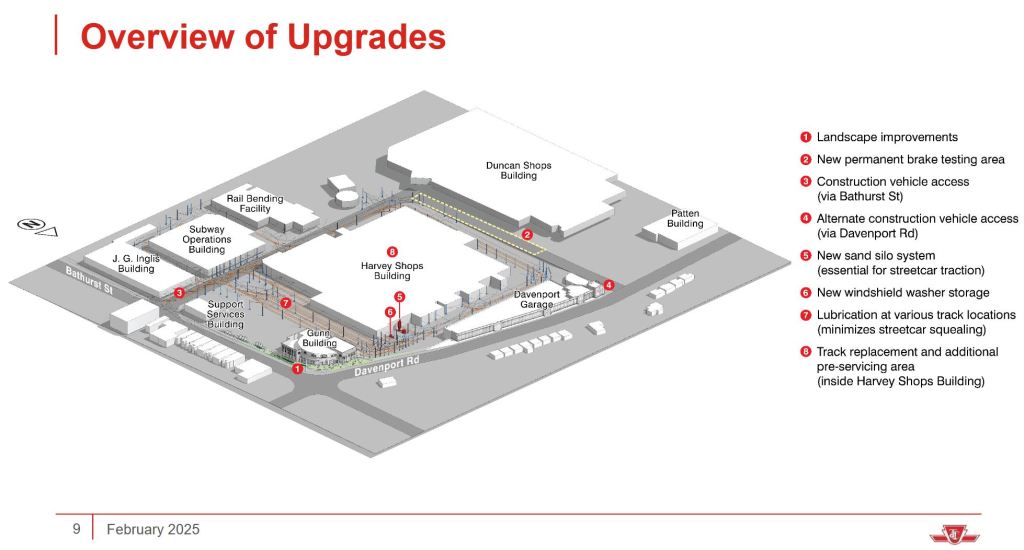
The Hillcrest project will be done in two phases allowing it to begin carhouse operation before the planned end date in 2029.
The eastern portion of the shops will be converted so that tracks run through from north to south. The current arrangement is oriented south to north, and most car movement within the building uses a transfer table to shift cars between the entry at the east side of the building and stub tracks further west.
The views below look west along the transfer table runway from the east side of the building in 2012 when CLRVs were the dominant form of vehicle. The runway will be filled in, and tracks which are now separated by it will be connected to provide a through route.
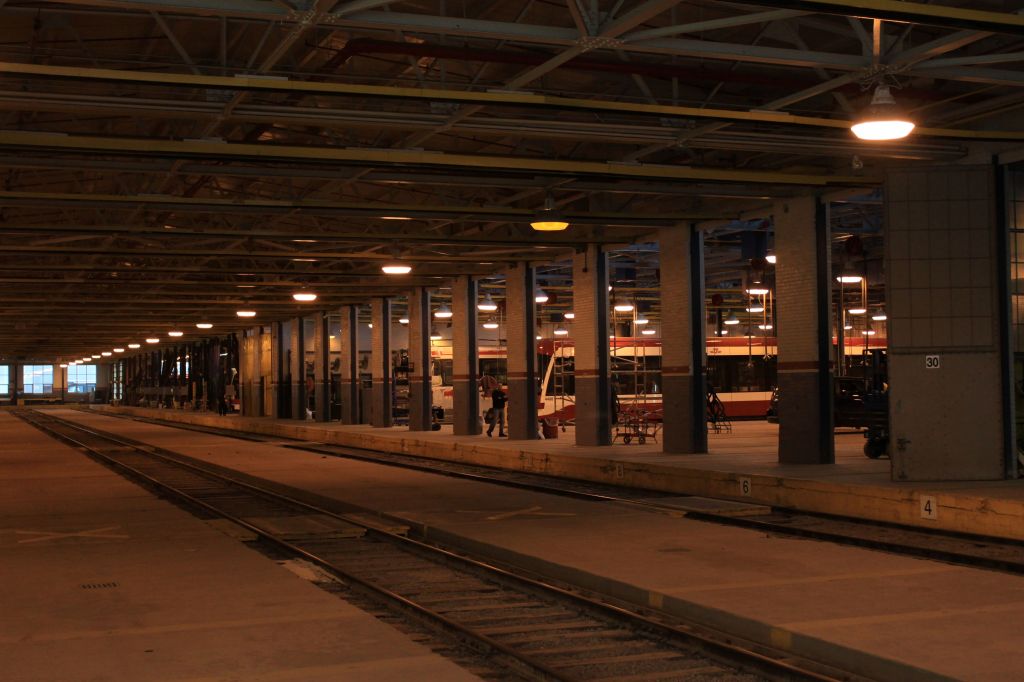
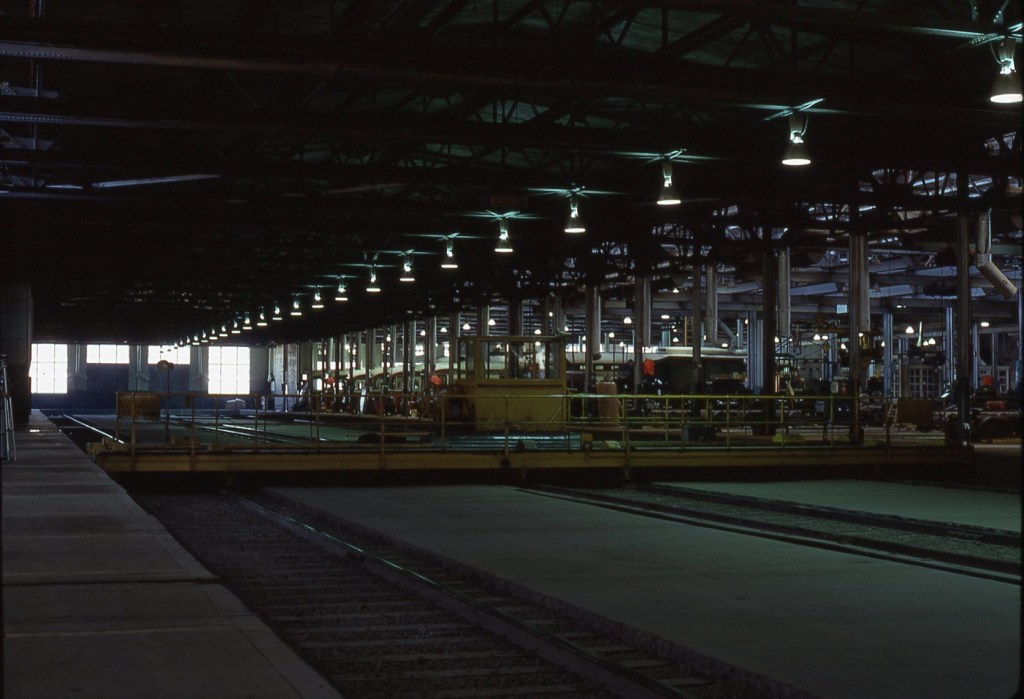
And here are views in earlier days showing the transfer table itself, and Peter Witt 2894 undergoing restoration for Tour Tram service. (This car is now at the Halton County Radial Railway Museum.)
Tracks around Harvey Shops will be reconfigured to provide a clockwise loop rather than the counter-clockwise arrangement now in place. Most of the storage area will be east of the building replacing some employee parking.
The TTC Board met on February 24, 2025 with an agenda that seemed light going in, but the meeting itself ran well into the afternoon partly due to a long in camera discussion and partly to debates that expanded the scope of the items on the agenda.
Notable by its absence was a report on establishment of a Strategic Planning Committee, an item approved by the Board on January 10 with an implementation plan due at the February 24 meeting. (See minutes at p. 3) Such a committee is vital so that consultation and planning can occur before and while the 2026 budget is in preparation, a process that gets underway in roughly June-July each year. If there is to be some brave new vision of what transit can become, there is no point in asking that it be included in an already final budget in December.