
The condition of transit service, its cost and quality, feature in the current municipal election debates. Some of the info quoted by candidates and their supporters is accurate, some is not. One could shrug one’s shoulders and say “t’was ever thus”. In an attempt to get clear information out on the table, this article collects financial and ridership info for past two decades to give a longer view.
Some of this is quite detailed. There is no way to avoid this in looking at service because too often the stats are presented in aggregate with averages that hide what individual riders on individual routes see.
Data Sources:
- TTC Annual Reports
- TTC Service Change Memos
Comparing Today With Pre-Pandemic Service
Trips and Fare Level
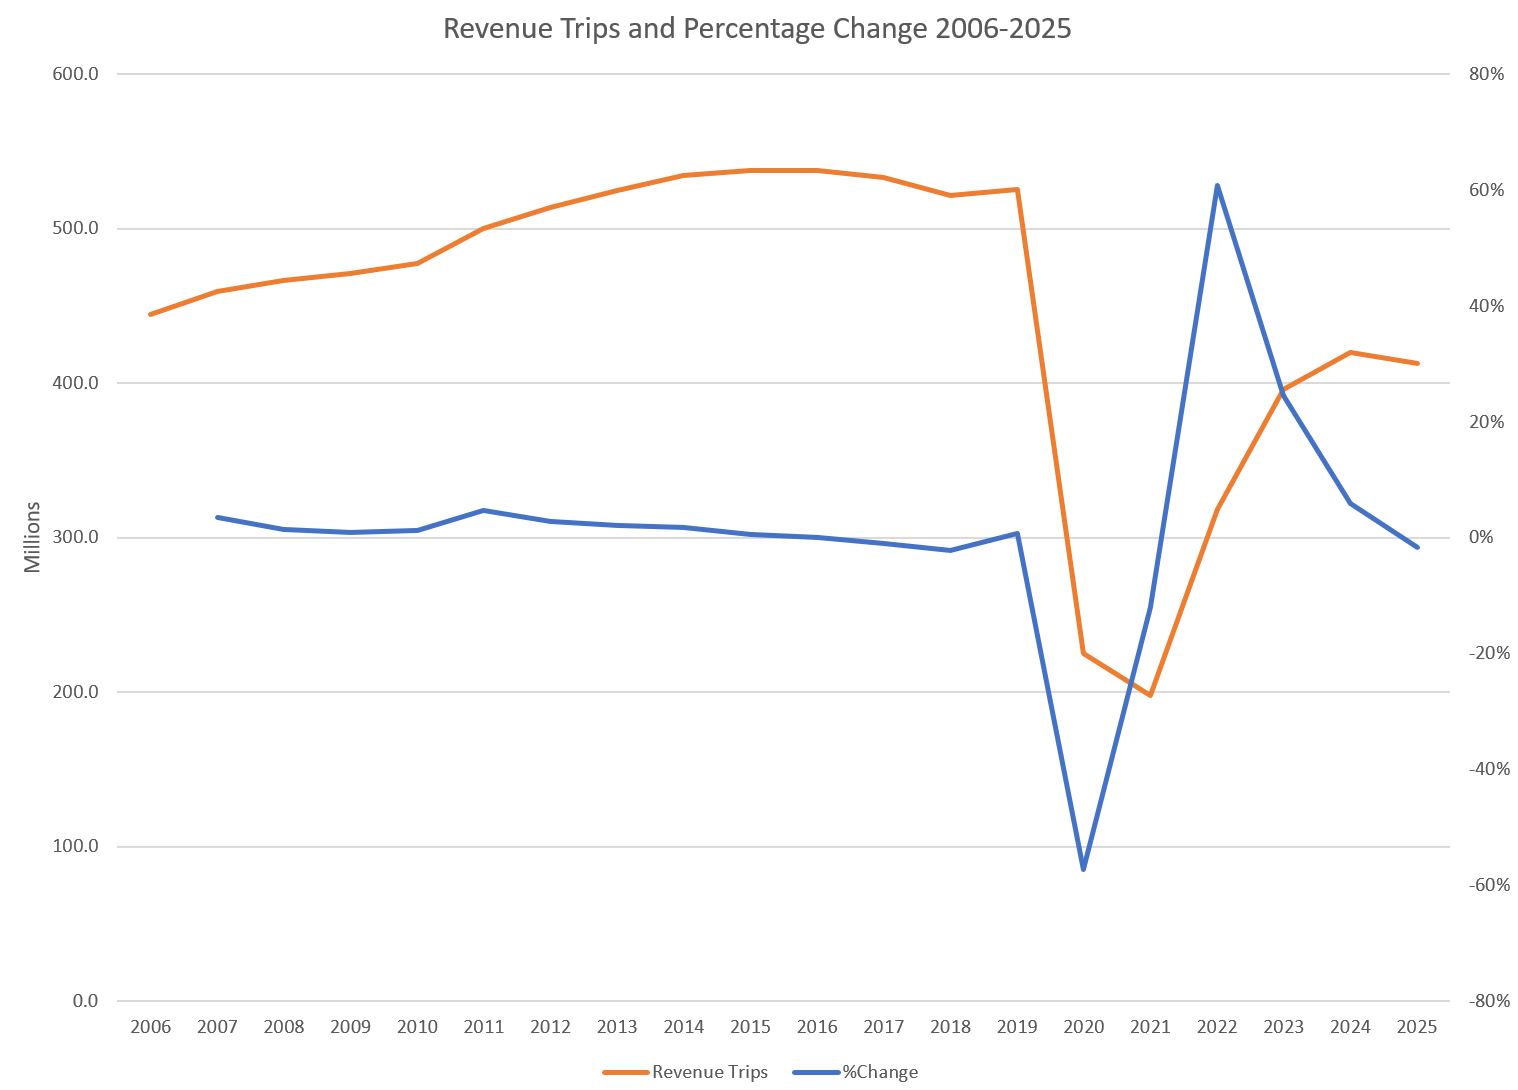
The annual count of trips grew through the early 2000s, and this was a source of pride to the TTC and its Board. However, that growth stalled in the mid-2010s and showed a slight downturn. The Board was still patting itself on the back as the growth curve flattened out and the rate of growth dropped.
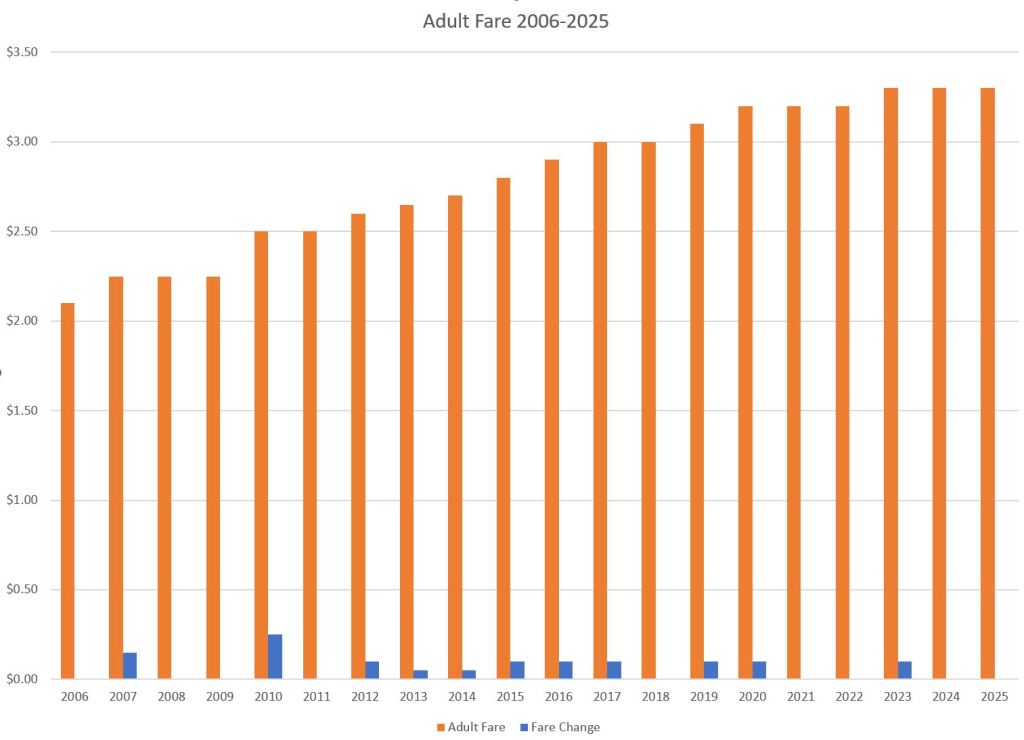
At the time, the sense was that more of the growth came in the off-peak where there was surplus capacity rather than in the peak where crowding was severe. Eventually even the off-peak service filled up and new riders stopped appearing. During the same period there had been small fare increases, but at a level where service rather than fare was the dominant factor affecting growth.
2020 brought the covid pandemic and a steep drop in ridership. Note that the full year effect is not seen until 2021 because the first two months of 2020 were “normal”.
Riding started to build in 2022, but remains below the pre-pandemic level for various reasons, notably a shift to work-from-home. Demand into downtown on the subway and streetcar networks is building again in 2026 thanks to increased work-from-office mandates, offset partly by a decline in student travel thanks to cutbacks in foreign student visas. Weather conditions, particularly the winter, also play a role in discouraging travel.
The TTC CEO’s reports shows modal riding changes occasionally, but does not give a month-by-month breakdown. 2026 will be an “odd” year thanks to extra World Cup traffic, offset by those who stayed away from downtown to avoid transit and traffic congestion, and the bitter winter months.
Fares grew slowly through the period up to 2020, but there was only a single 10-cent increase in 2023. This was a policy decision by the then-Mayor and Council, supported by special covid-era subsidies from the Provincial and Federal governments. These allowed service to be maintained at close to pre-pandemic levels through the dip in riding and fare revenue.
Financial Results
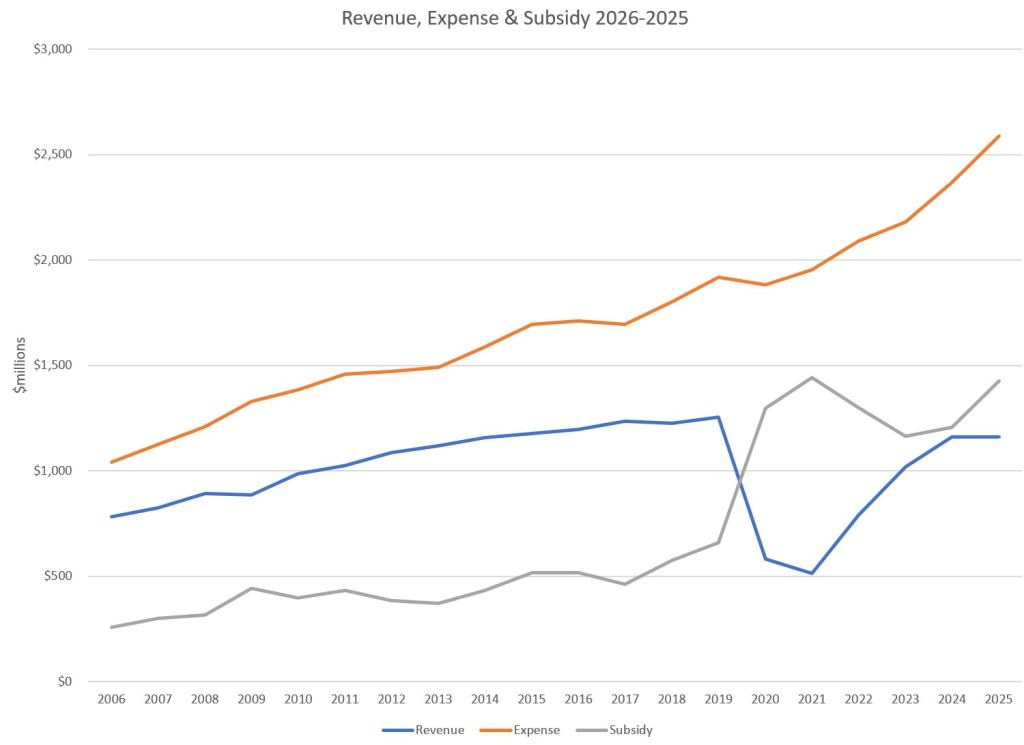
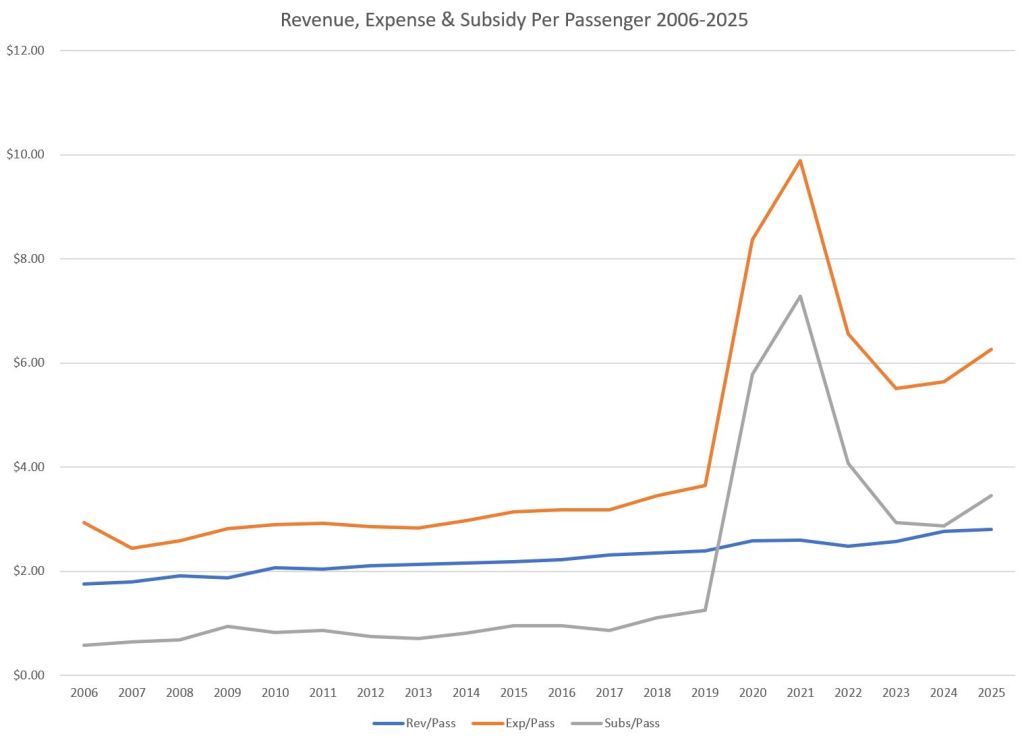
TTC Revenues grew steadily until 2019, although expenses grew faster. By 2019, the subsidy was growing at a faster rate, and this was followed by a big jump in the pandemic years. These were initially funded as covid relief, but later out of the Ontario-Toronto “New Deal”. That arrangement expires in the 2028 fiscal year. Details of funding can be found in the TTC’s Annual Reports, particularly in the appendices to the financial statements that break out the subsidy streams in detail.
“Revenue” here includes miscellaneous income such as advertising, parking lot fees, subway concession rentals, and other minor items. Typically this provides about 6% of the TTC’s total funding. It does not include any funding for capital works. This stream has dropped in the pandemic era as demand falls.
“Expenses” do not cover capital works except for rare cases where capital purchases are charged to the operating budget.
Note that expenses were flat during the 2015-17 period. After a small drop in 2020, they continue to rise although revenues are nowhere near catching up.
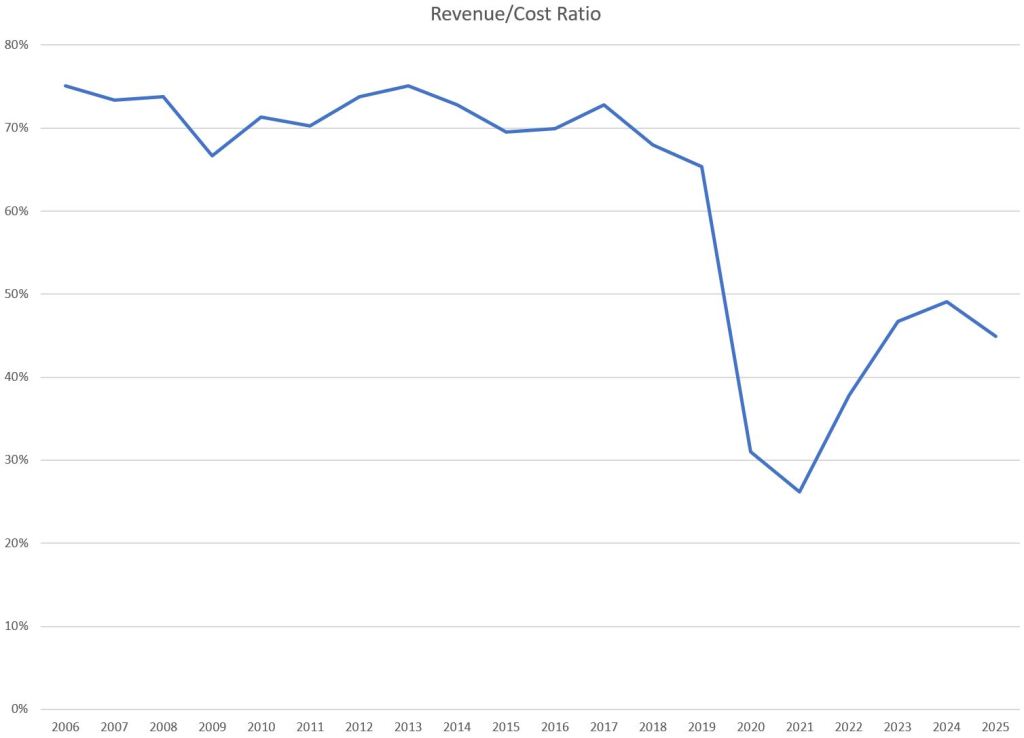
The “R/C Ratio” held at or above 70% for many years. (Deducting the 6% in miscellaneous revenue brings this number down to the commonly cited 65-66% of expenses paid from the farebox.) The R/C ratio was under 50% in 2025, and allowing for non-fare revenue, the farebox recovery sits at or below 40%.
Returning to the historical 66% level would require a huge increase in fare revenue. Much of that would have to come from higher fares because the prospect of adding 50% to existing ridership is not feasible especially considering the extra service needed to make the system roomy and attractive enough. Toronto is more-or-less locked into a higher level of transit subsidy even with modestly higher fares and limits on service expansion.
For reference, the TTC’s 2026 Operating Budget for the conventional system looks like this:
- Farebox: $1.045 billion
- Reserve draw: $78.3 million
- New Deal: $279.5 million
- Other income: $133.9 million
- Total expense: $2.826 billion
Wheel-Trans adds expenses of $201.7 million offset by revenue of $10.3 million.
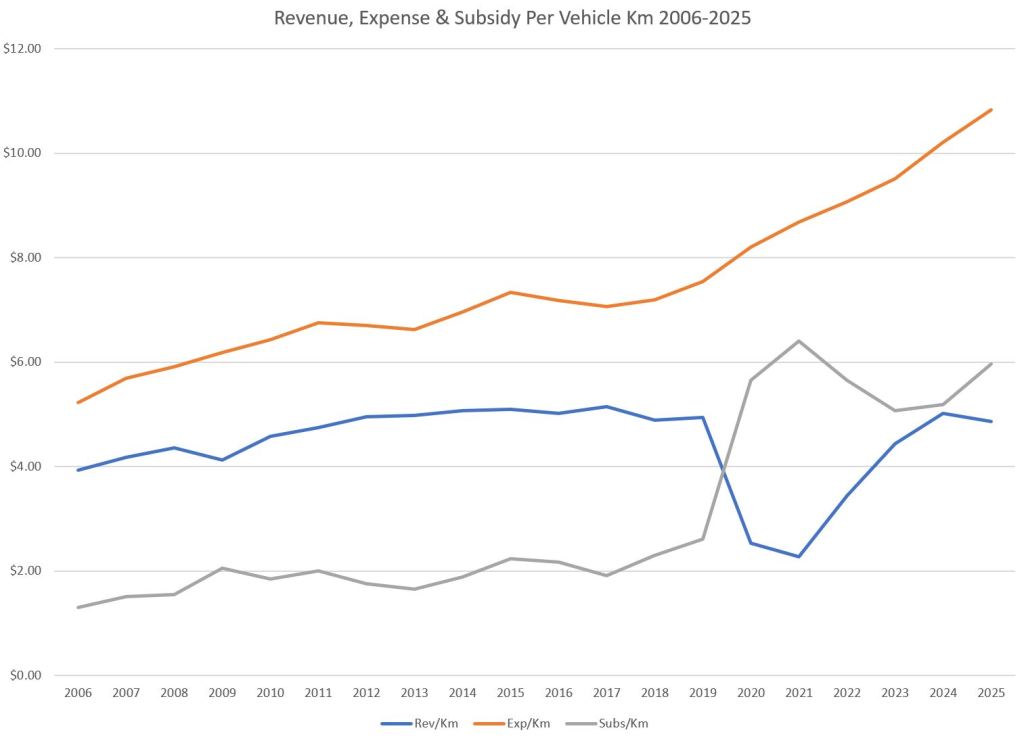
The bottom pair of charts present the revenue and expense numbers on a per trip and per vehicle kilometre basis. The subsidy per passenger is considerably higher in 2025 than in 2019.
On a vehicle kilometre basis, the expense rate has grown quite noticeably. Part of this is due to slower operation and increased terminal recovery time. Both of these drive up costs without adding to service mileage.
Scheduled Hours and Mileage
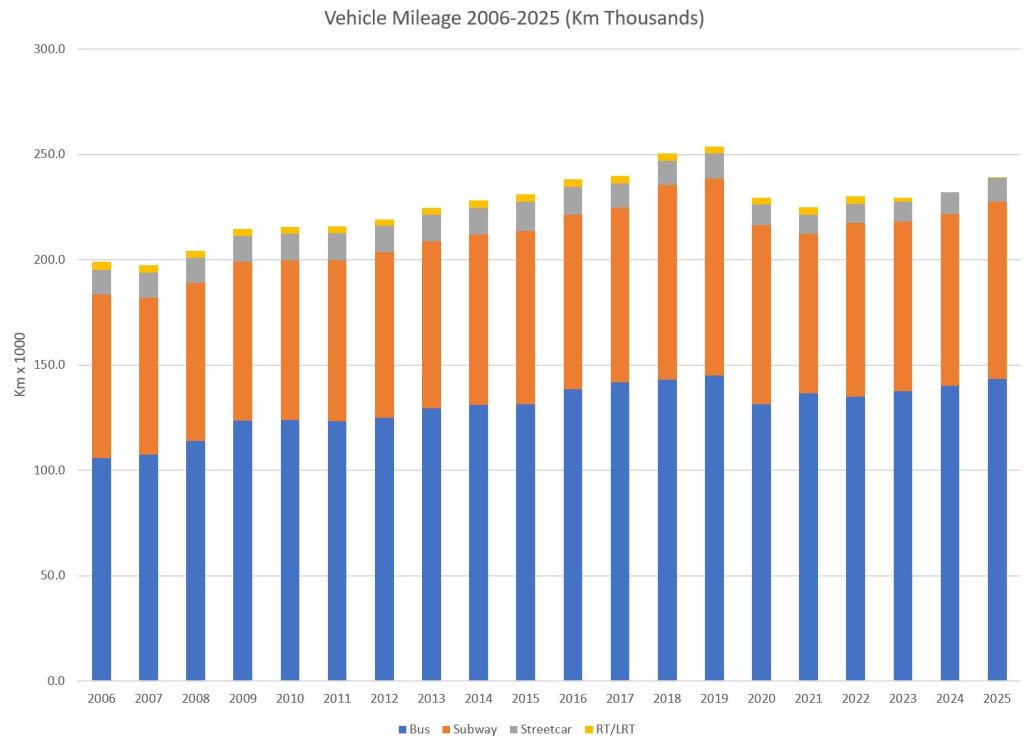
There are two simple ways to look at the level of service provided by the TTC. One measures vehicle miles, and the other is vehicle hours. Both of these can be affected by major system changes such as the opening of a new subway line, or major changes in the surface network. There is little sign of that here. Another change comes from the conversion of subway operations to one person crews, but as a percentage of the total hours this is small. Streetcar operations changed in 2020 with the retirement of the CLRV/ALRV fleet, and scheduled adjustments for the new, larger Flexitys.
The only subway to open during this period was the extension to Vaughan on December 17, 2017.
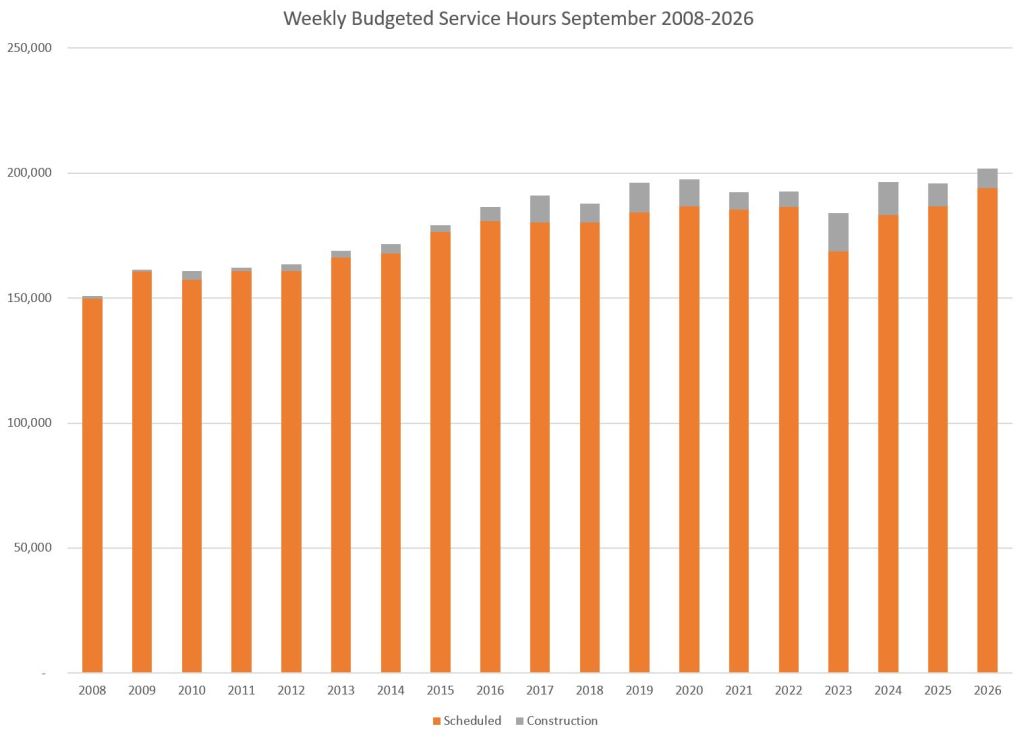
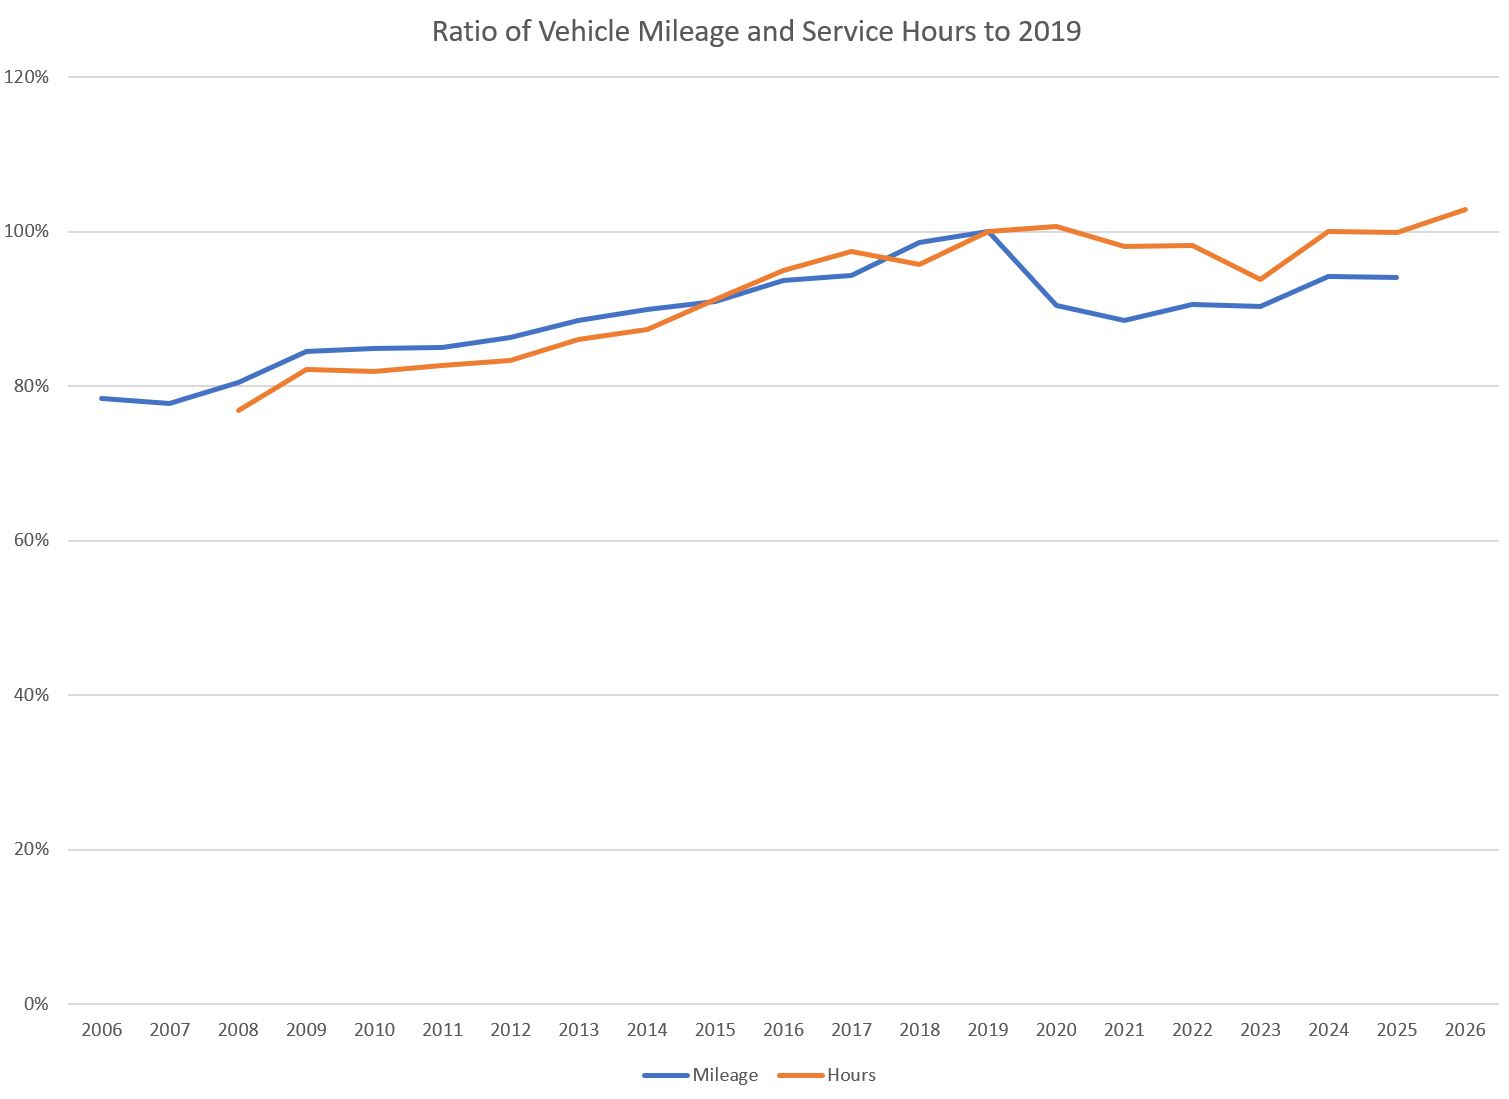
Budgeted weekly service hours in September each year are shown on the left below. They did not drop in 2020 as precipitously as vehicle mileage. Note that the period for the scheduled hours chart runs from 2008 (the first year for which I have data) to 2026. There is a dip in budgeted hours in 2018, but actual service operated at a higher level that year making the dip less pronounced.
The “construction” hours are a provision for extra service needed mainly due to projects like track and water main/sewer replacement, and subway construction.
Service hours drive costs more than vehicle mileage because they relate to labour costs. When vehicles travel more slowly thanks to congestion or provision of recovery time, the mileage might not change, but the hours rise unless service is cut as an offset.
(For example, a route with a one hour trip time and a bus every 10 minutes requires another bus if the travel time goes up to 70 minutes, or if 10 minutes are added for terminal recovery time. The mileage traveled does not change. The route costs more to operate, but provides the same level of service.)
Weekly service hours in September 2026 have crested above the 2019 level, but vehicle mileage for 2025 sits at the 2016-17 level.
The relative changes can be seen in a chart of the ratio between 2019 levels as “1” and the two measures across the years. An important change starting in the pandemic era was the growth of standby buses (aka “RADs” or “Run As Directed”) that could spend considerable time waiting for something to do. Although it is not shown below, this effect will diminish starting in fall 2026 as RADs have been converted to regularly scheduled service.
Headway Comparisons
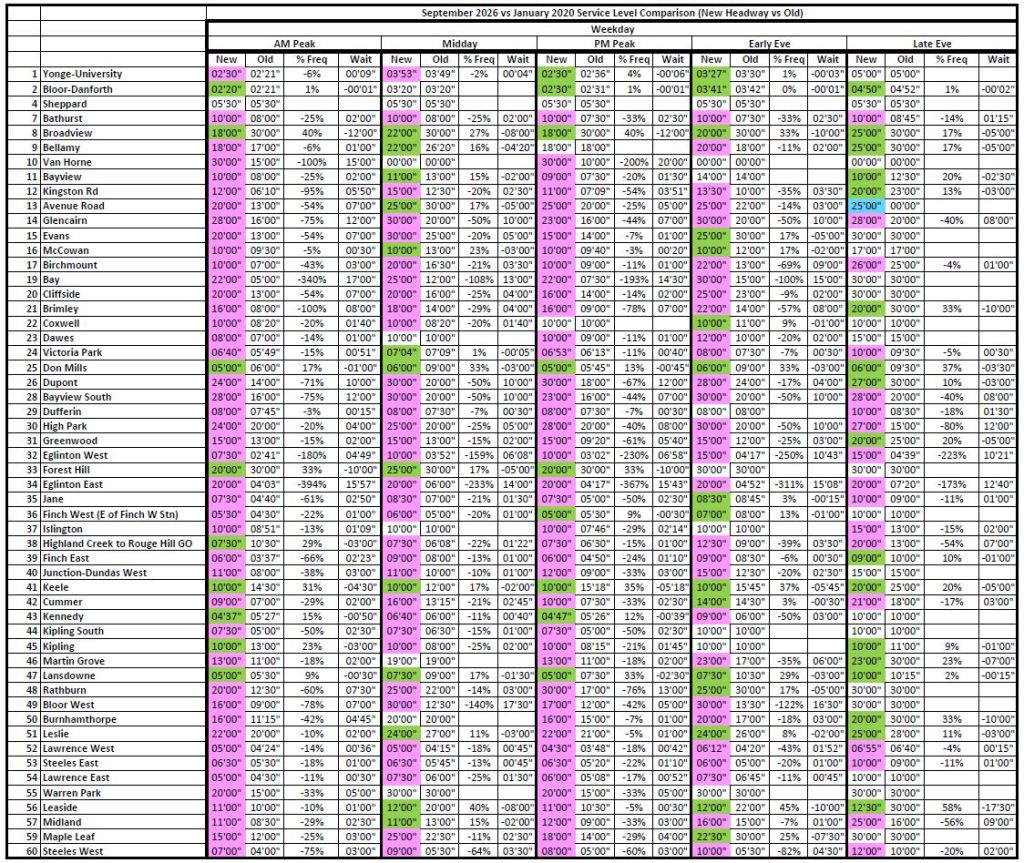
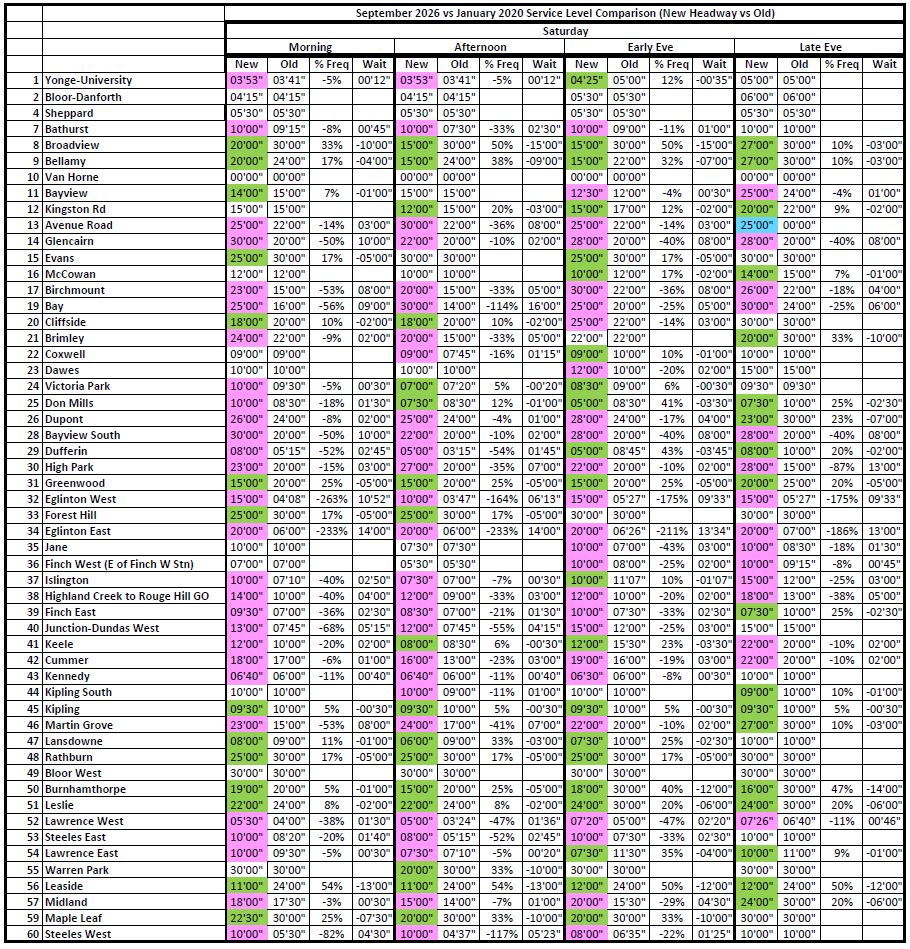
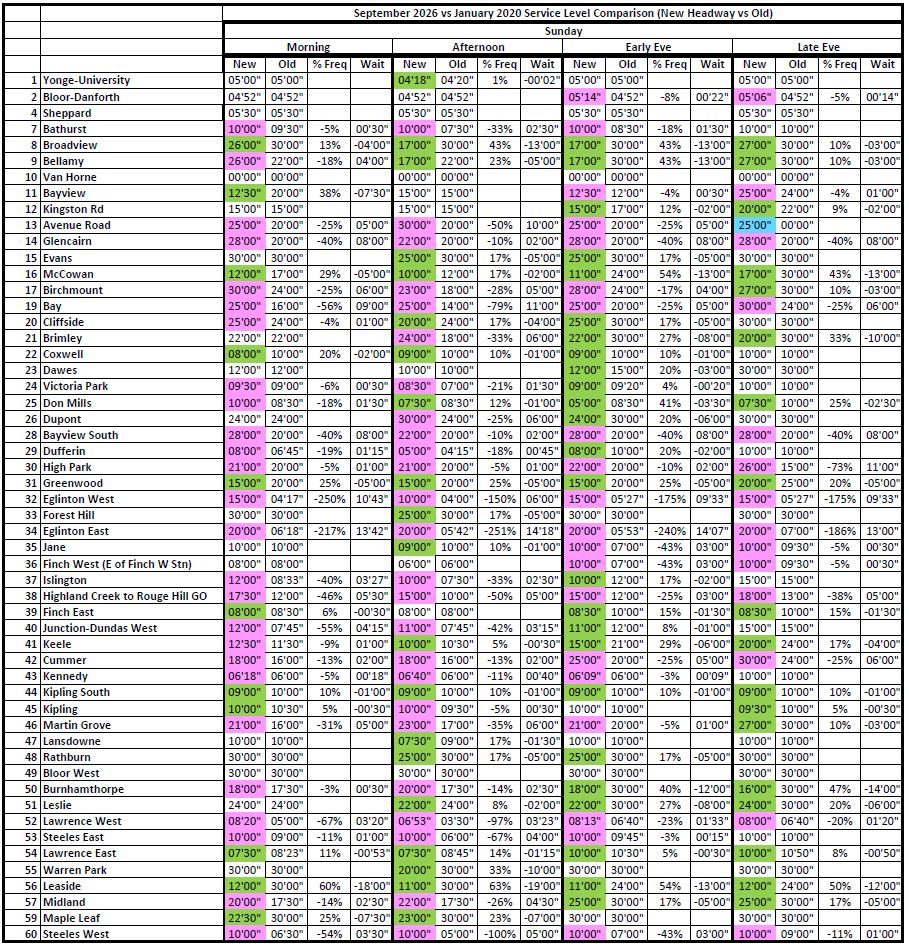
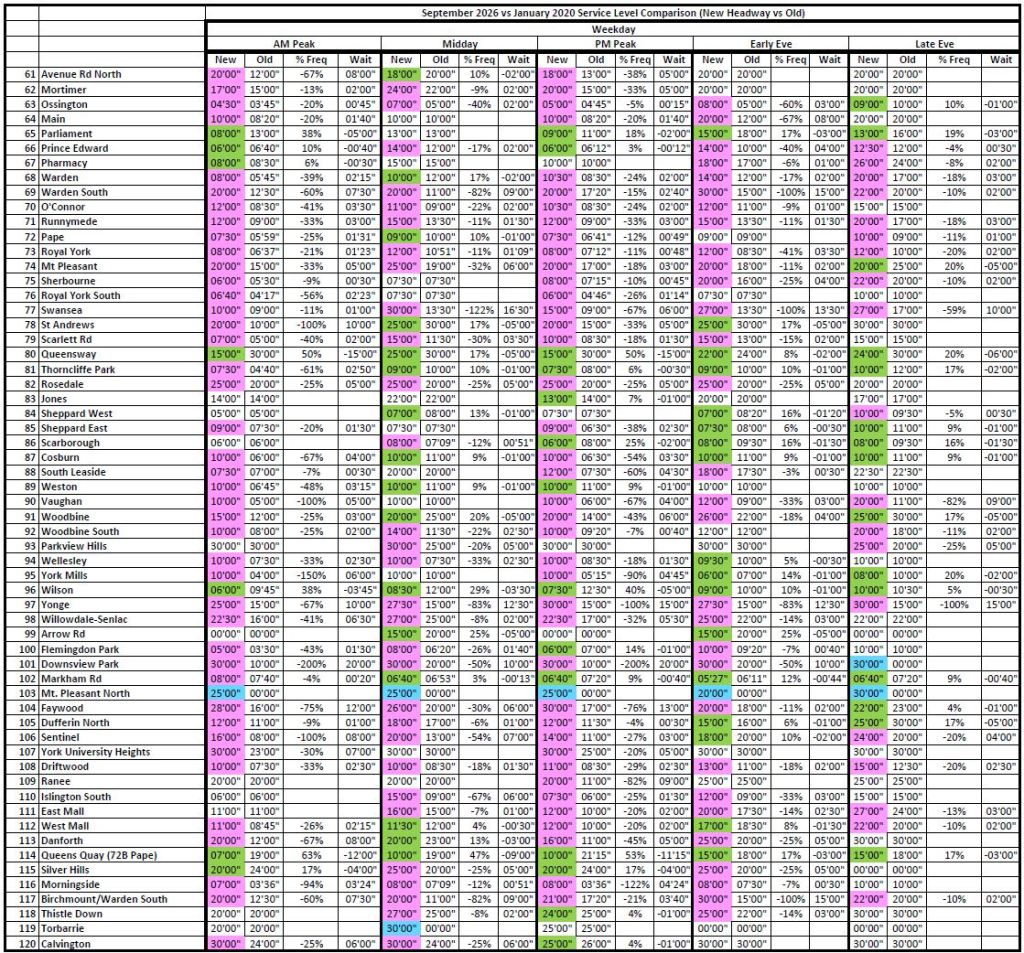
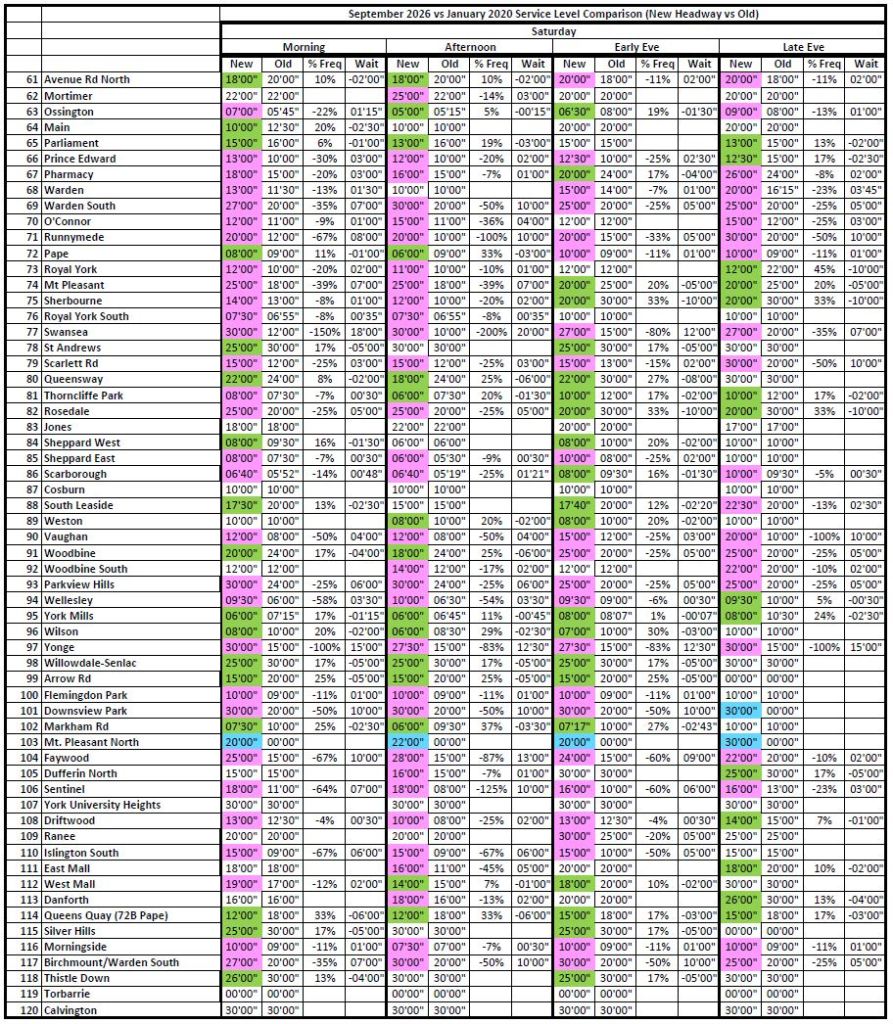
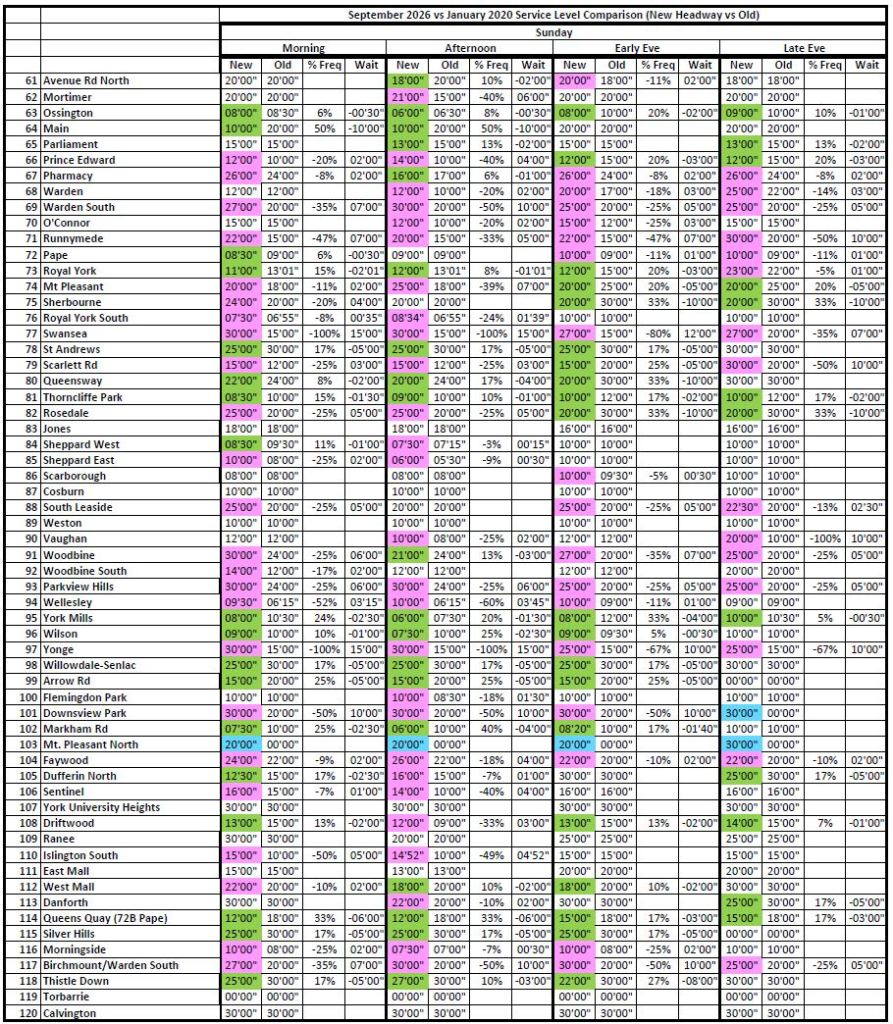
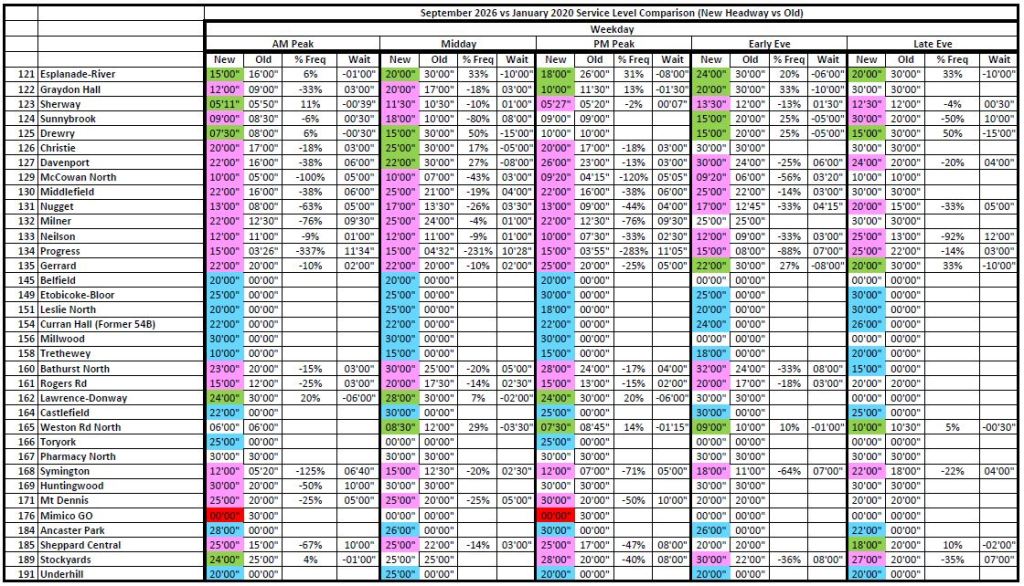
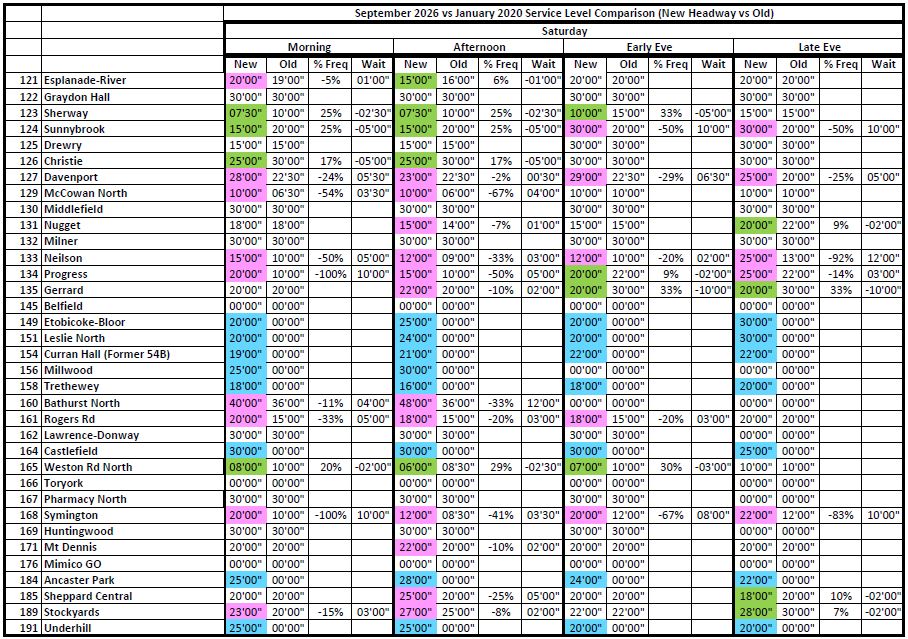
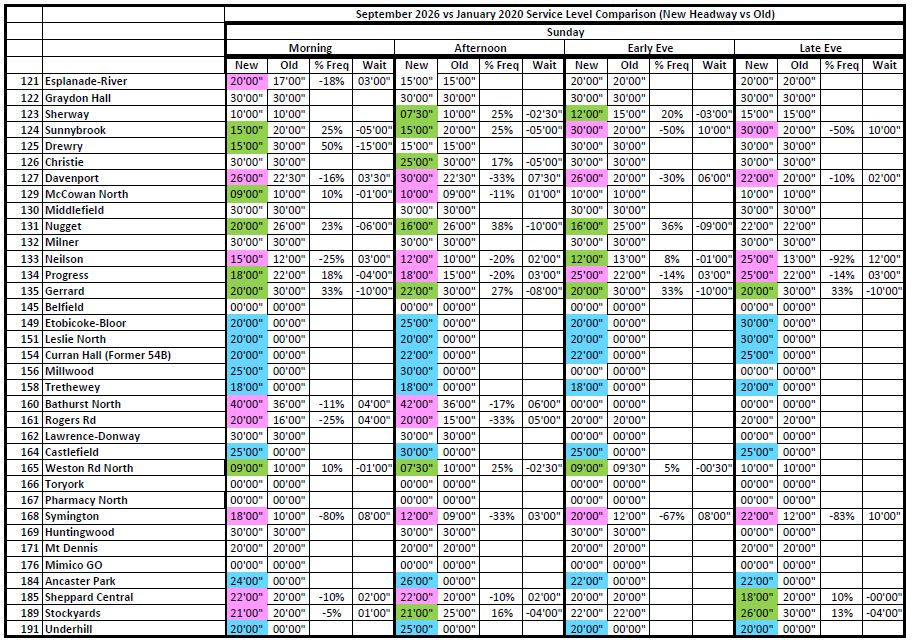
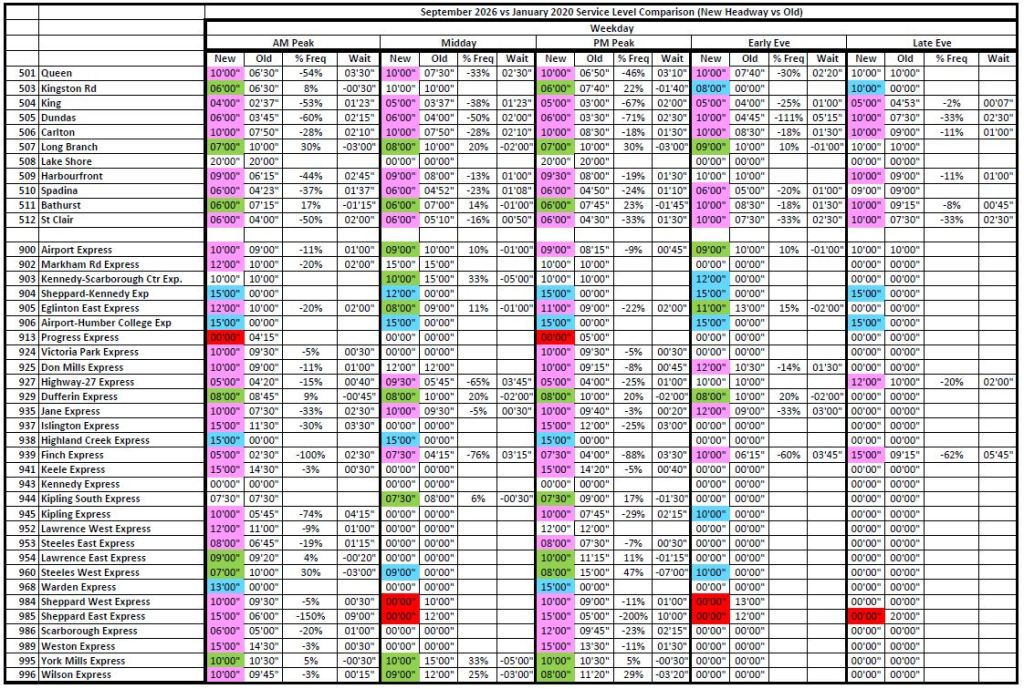
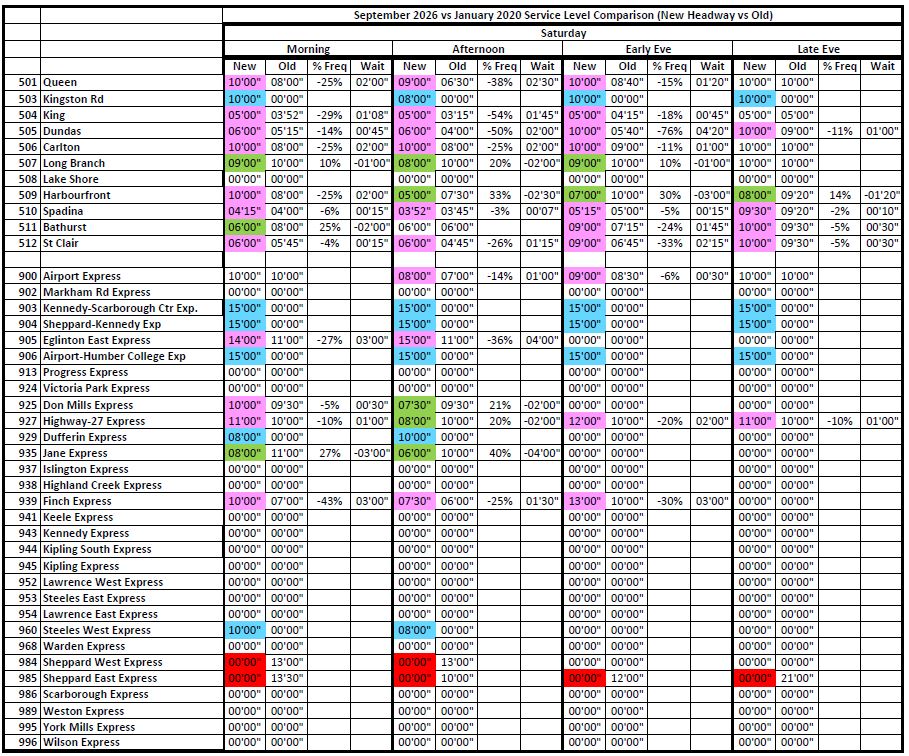
A common claim is that service is back to pre-pandemic levels, an era noted for crowding, particularly on the subway. Less often mentioned are the surface routes. The following tables compare January 2020 service levels with those scheduled for September 2026.
The left column contains weekday data, the middle holds Saturday, and the right holds Sunday. Within each set the service is broken down by time of day based on the periods used in the TTC’s Scheduled Service Summaries, and shown individually for each route.
Four items are shown for each entry:
- The “new” (September 2026) scheduled frequency. This is colour coded to highlight the type of change, if any:
- White: No change
- Green: Improved service
- Blue: New service
- Pink: Less frequent service
- Red: Service discontinued
- The “old” (January 2020) scheduled frequency.
- The percentage change in frequency.
- The change in wait time between vehicles.
Note the amount of “pink” in these charts showing cases where service is less frequent today than in early 2020. This is not to say that in every case, better service is “deserved” by the ridership, but any claim that service overall is back to 2020 levels is not supported.
Unfortunately, the TTC still does not produce detailed statistics on vehicle crowding although there is a simplistic summary in the CEO’s monthly report. The TTC’s Service Standards set a lower level for off-peak crowding than during the peak, but there is no clear indication of whether the less-crowded standard is used for off-peak trips in the CEO’s report. Moreover, there is no route nor time-of-day breakdown.
The absence of detailed crowding stats from the TTC makes comparison of service levels to ridership at a detailed level impossible.
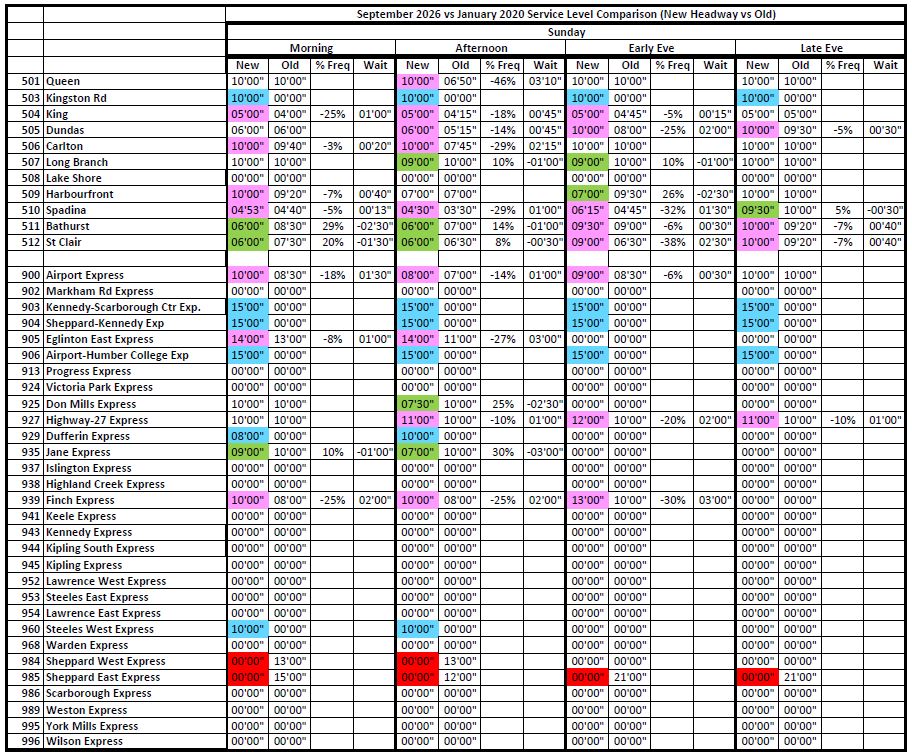
A full set of the tables as a PDF is available here.
Who Was In Charge?
A common statement when looking at historical data is that “Mayor so-and-so” did it, although these citations sometimes miss the mark. Here are the Mayors and their terms for the 2006-2025 period. Note that an incoming Mayor following a fall election generally has little flexibility in setting the coming year’s budget and largely inherits this from their predecessor, although some mid-year shuffling of budget priorities is possible.
- December 1, 2003 to November 30, 2010: David Miller
- December 1, 2010 to November 30, 2014: Rob Ford
- December 1, 2014 to February 17, 2023: John Tory
- July 12, 2023 to present: Olivia Chow
The TTC CEO’s Office went through changes in the same period.
- June 2006 to February 21, 2012: Gary Webster
- February 21, 2012 to December 17, 2017: Andy Byford
- July 2018 to August 30, 2024: Rick Leary
- September 2024 to June 2025: Greg Percy (interim)
- July 7, 2025 to present: Mandeep S. Lali
 Steve Munro
I won’t pretend to have a solution. I can only report what I see and I see a lot of people getting on streetcars without paying.
LikeLike