
This article continues a series reviewing the operating speeds of streetcar lines in detail looking at:
- Evolution of travel times from November 2019 to June 2026 by route segment.
- Detailed profiles of operating speeds over the full route for the same months.
- A review of dwell times in June 2026 showing where streetcars are most likely to spend excessive time in the AM and PM peak periods.
The two intervals compared here are:
- June 1-5, 2026: This was just before the upheavals of the World Cup period, but without any construction diversions that would distort the data.
- November 11-15, 2019: This was the first period when route 506 Carlton was scheduled with the new Flexity streetcars.
Issues of note:
- Streetcars are slower in 2026 compared to 2019 on many parts of the route.
- Peak period congestion effects are not consistent across the route. Some delays occur on the outer parts of the route (Upper Gerrard eastbound near Woodbine, College westbound from Dufferin to Dundas).
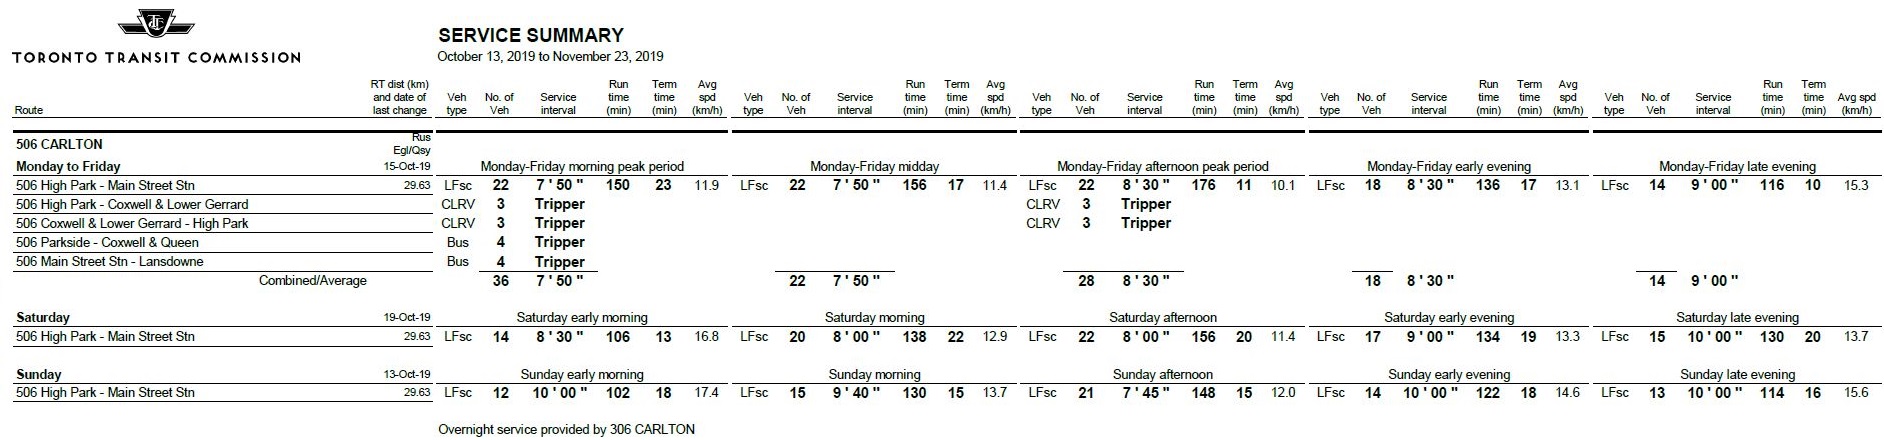
Service Designs:
June 2026:

November 2019:
Methodology
For a description of the methodology behind these charts, please refer to the Overview article.
Comparative Travel Speed by Route Segment
In the charts below, the route is split into three separate charts per direction to avoid clutter.
The solid lines show average travel times over each segment by time of day in June 2026. These are the same data as published in a previous article looking at all routes.
The dotted lines show average travel times over the same segments in November 2019. In some cases, the values for both years are similar, but not always.


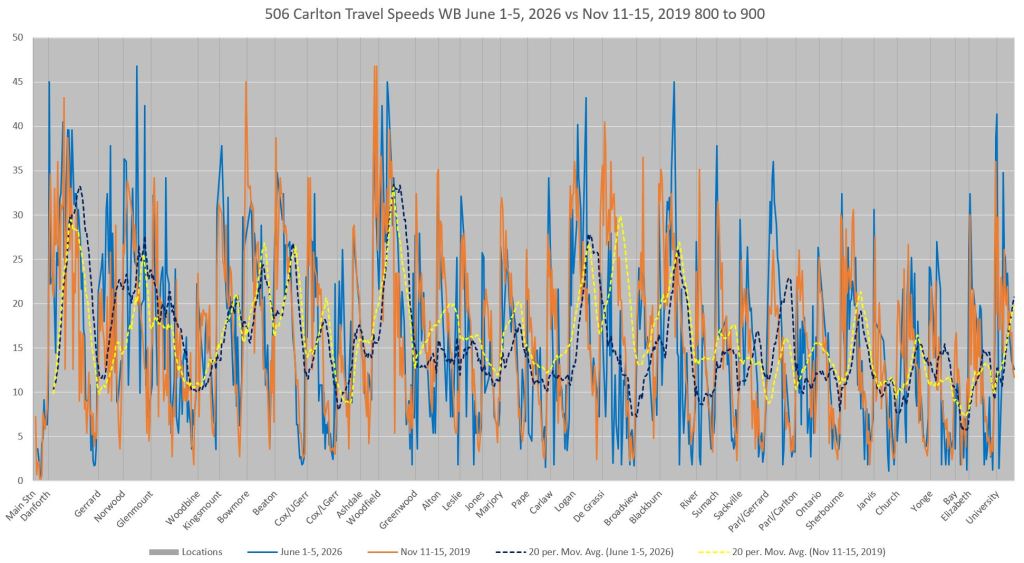
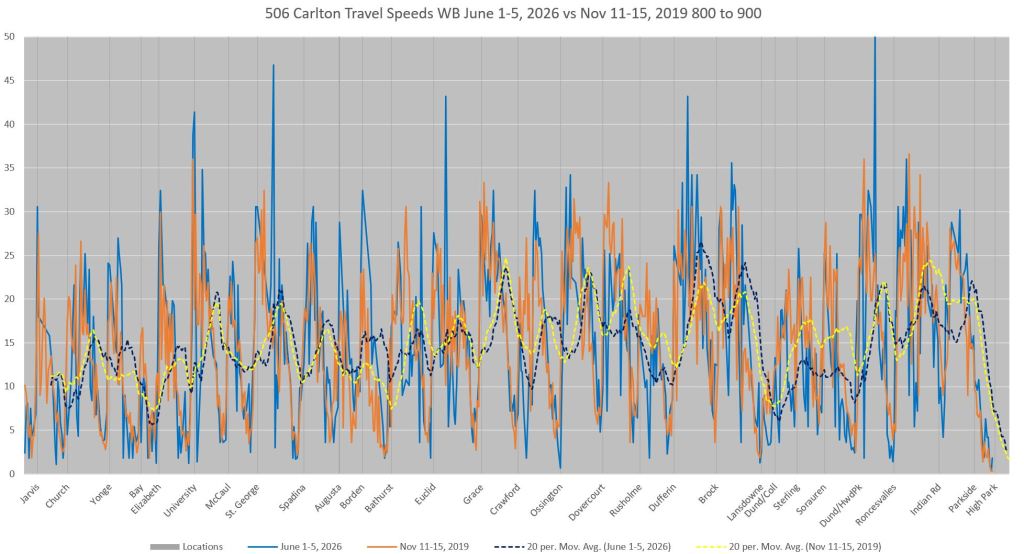
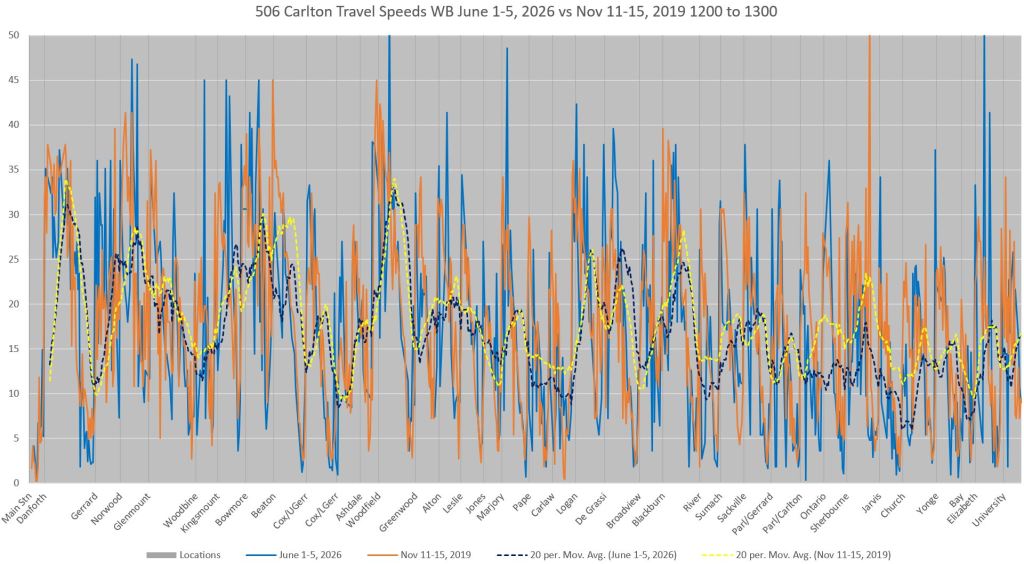
Detailed Speed Profiles
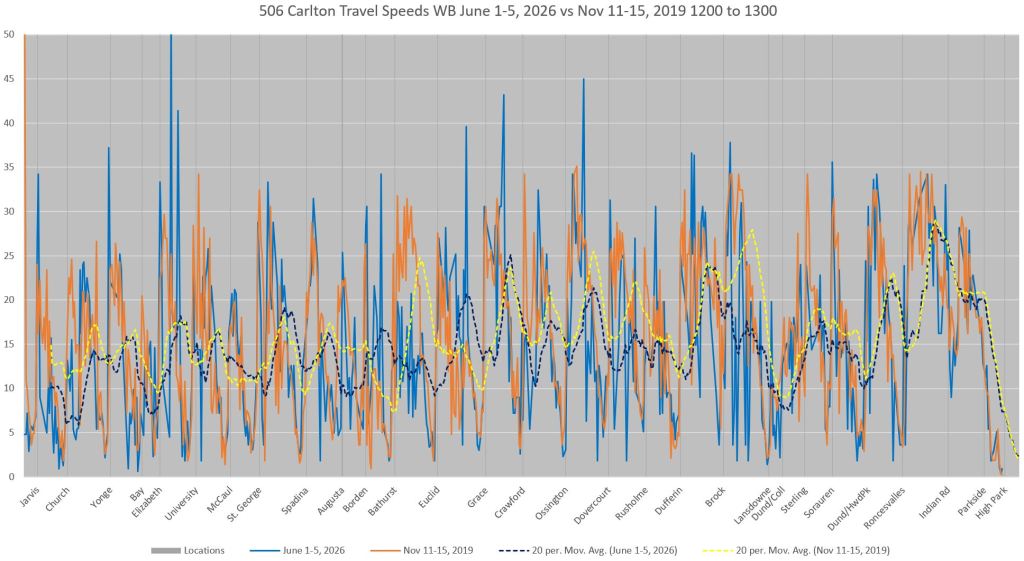
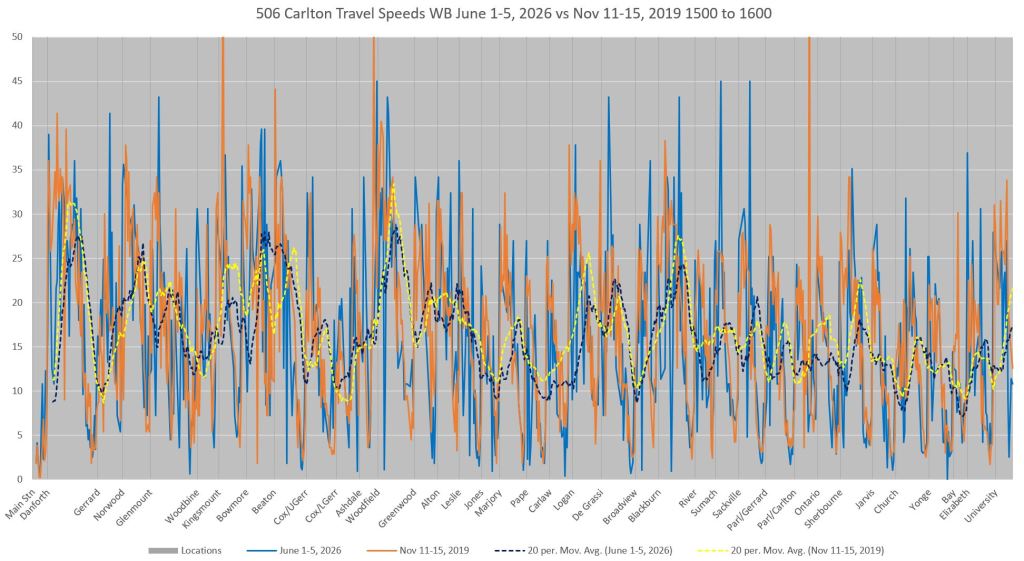
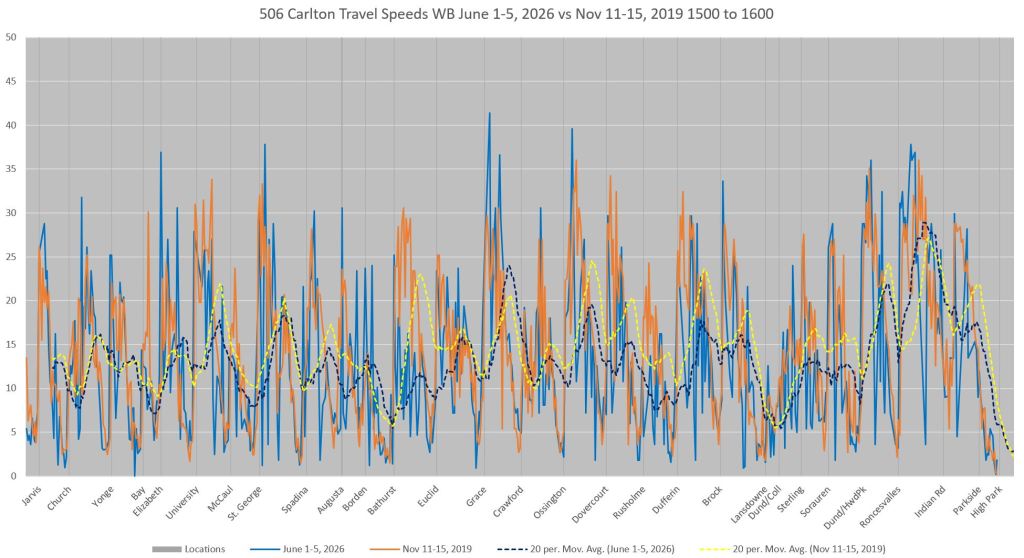
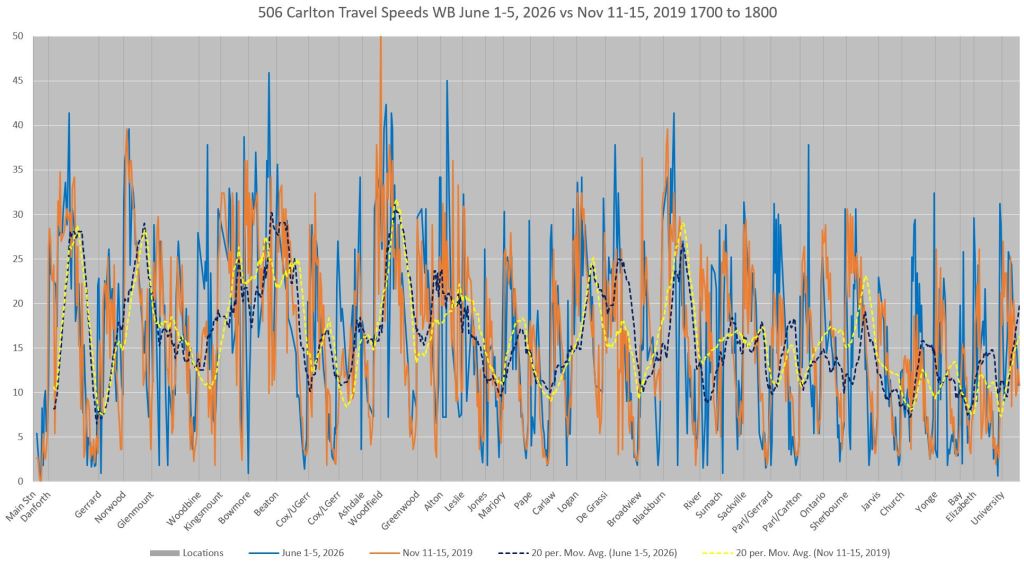
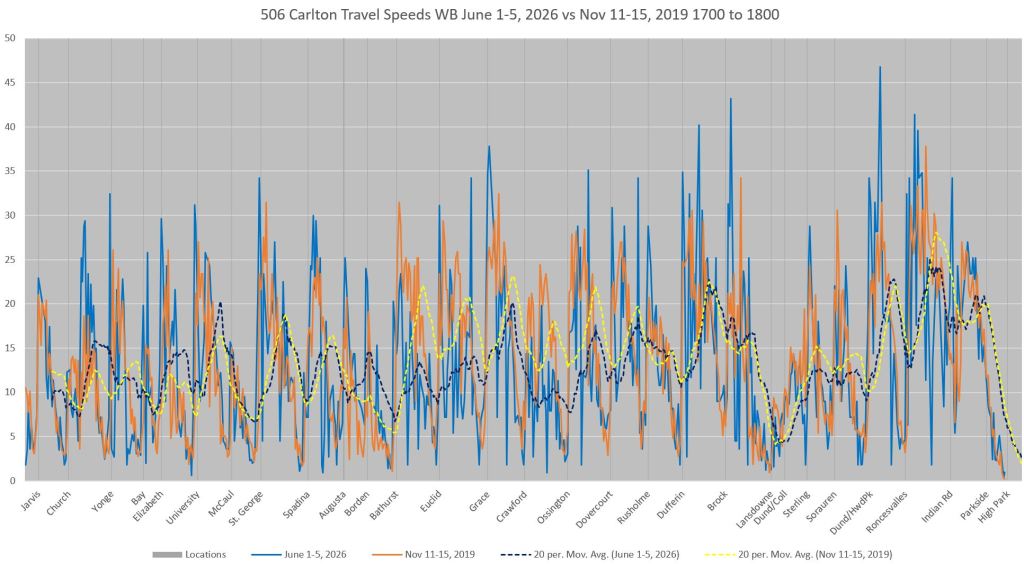
Note moving averages for 2019 generally higher than 2026. 2019 top speeds (blue) dominate.
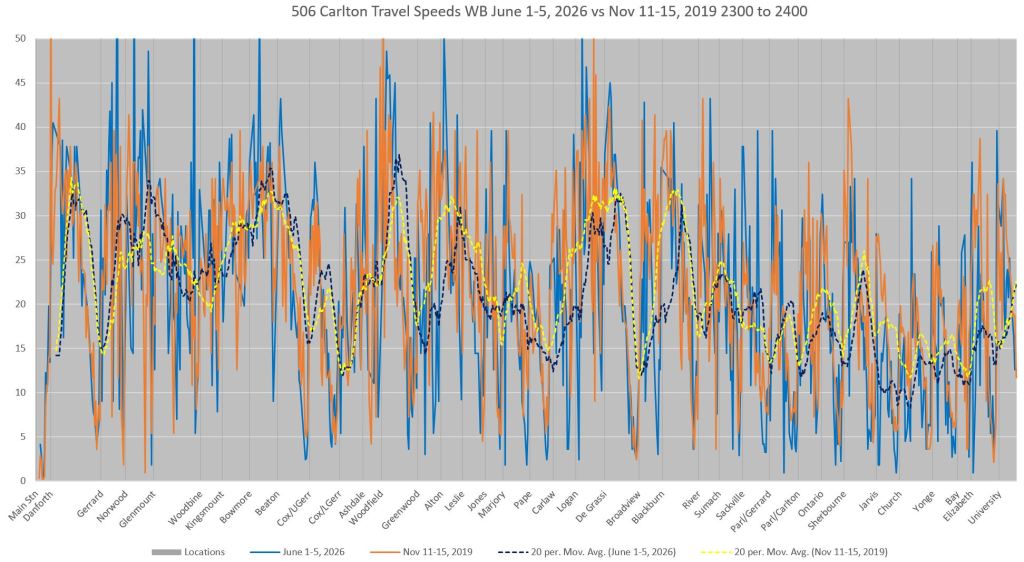
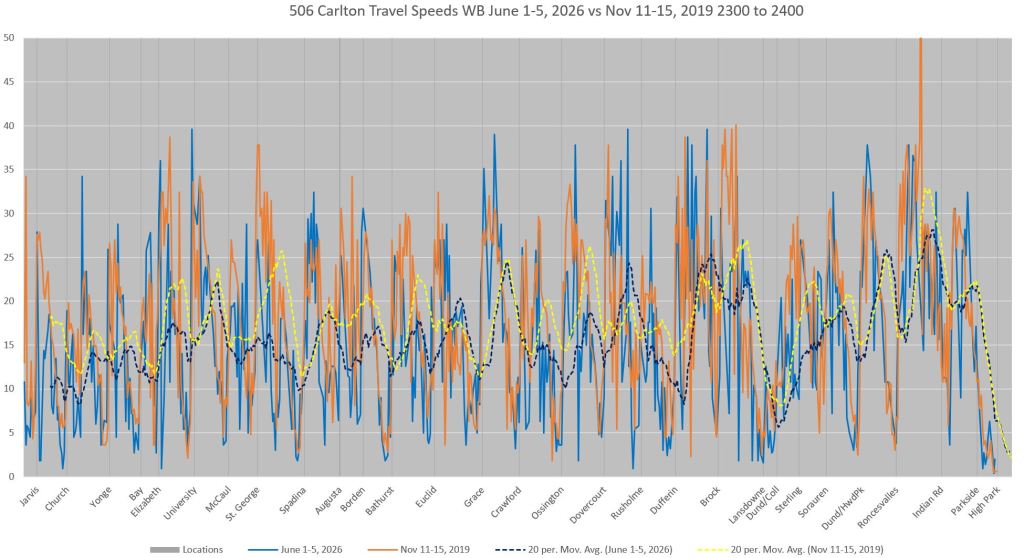
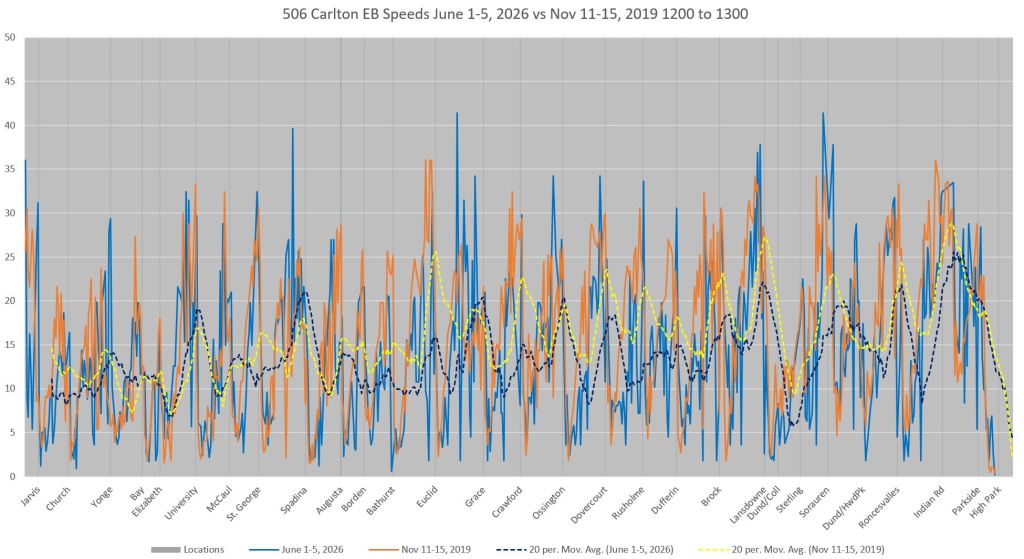
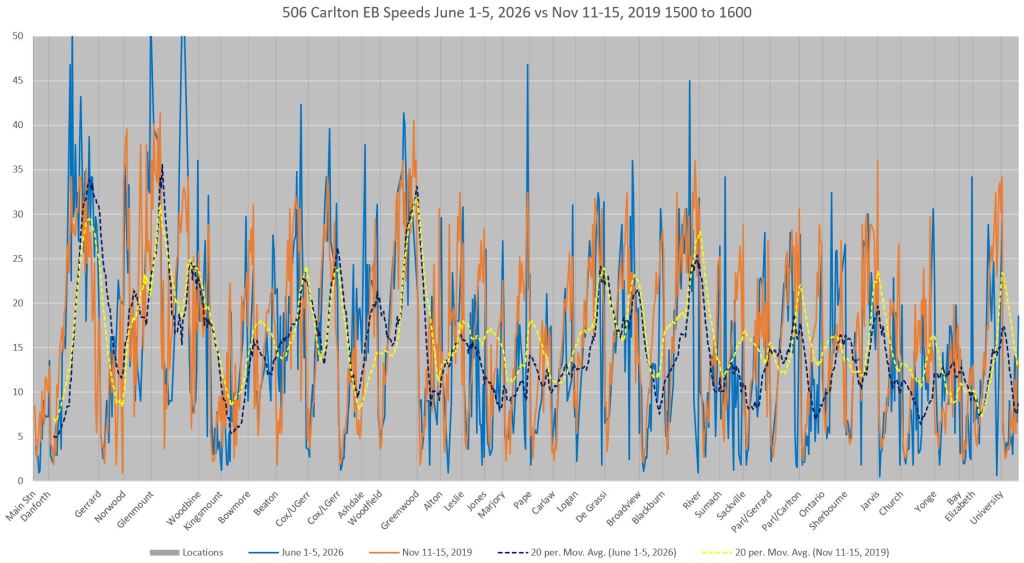
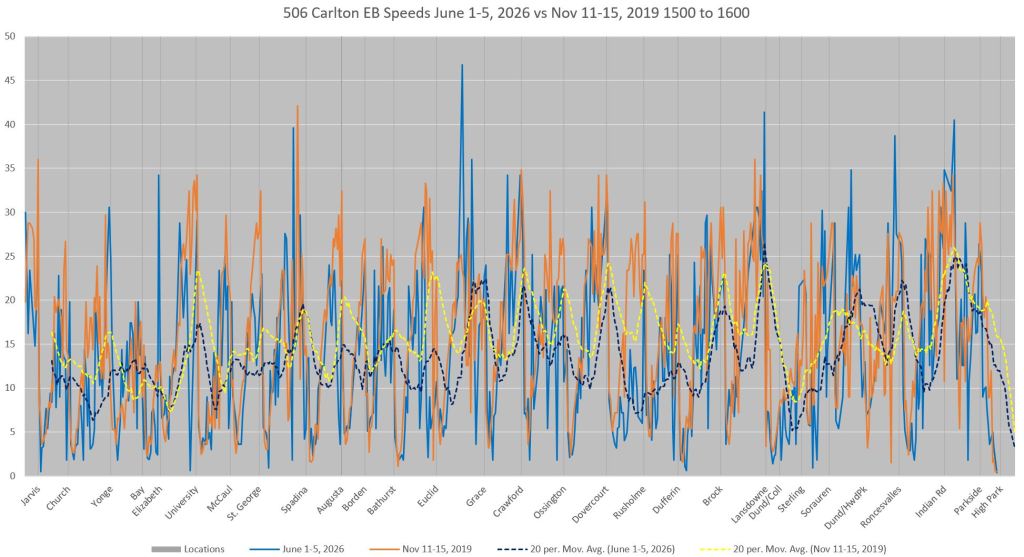
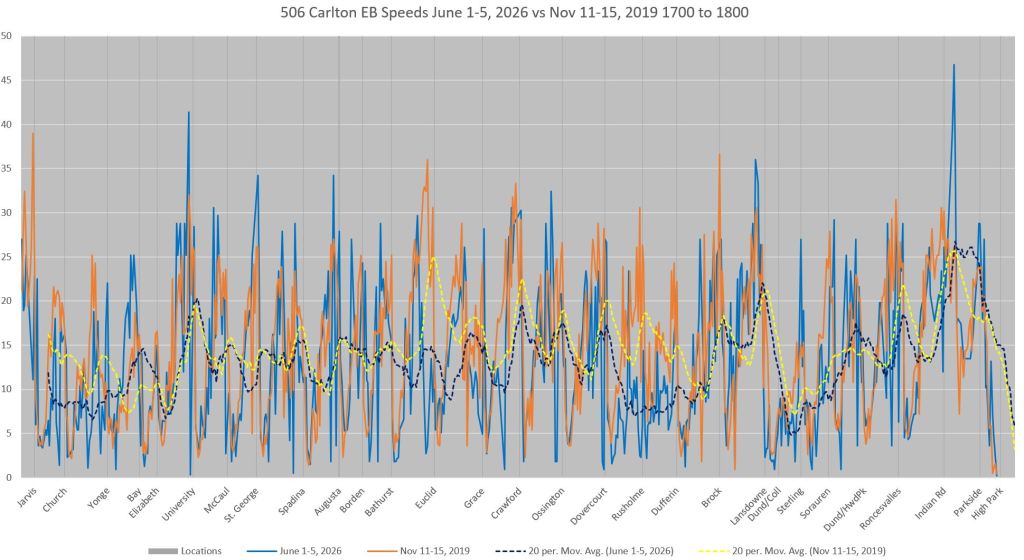
The charts below show the entire route spread over two pages side-by-side. There is an overlap with the “east end” chart stretching to University, and the “west end” page starting at Jarvis. Each row contains data for a one-hour period from the AM peak, midday, mid-afternoon, PM peak, early and late evening.
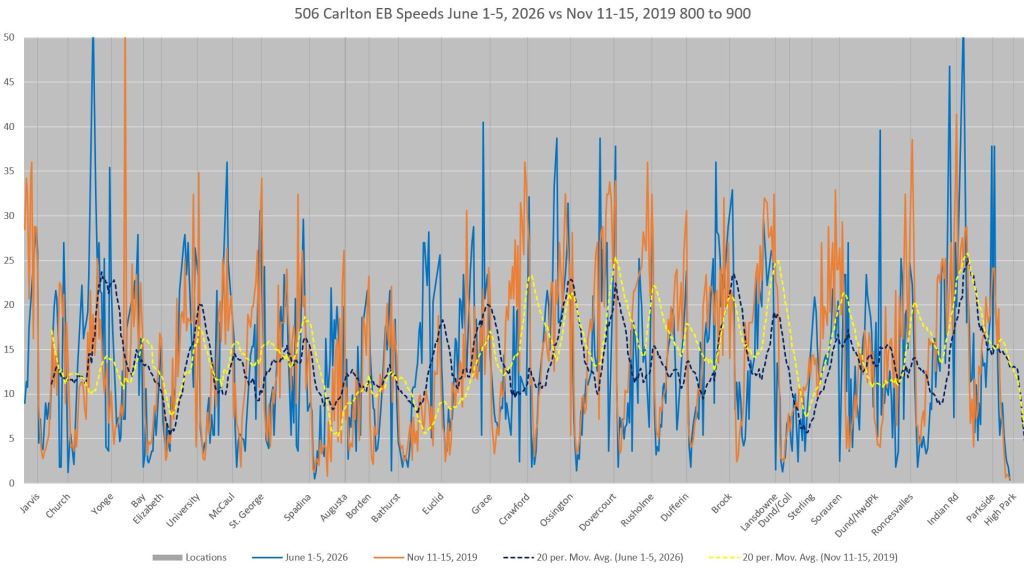
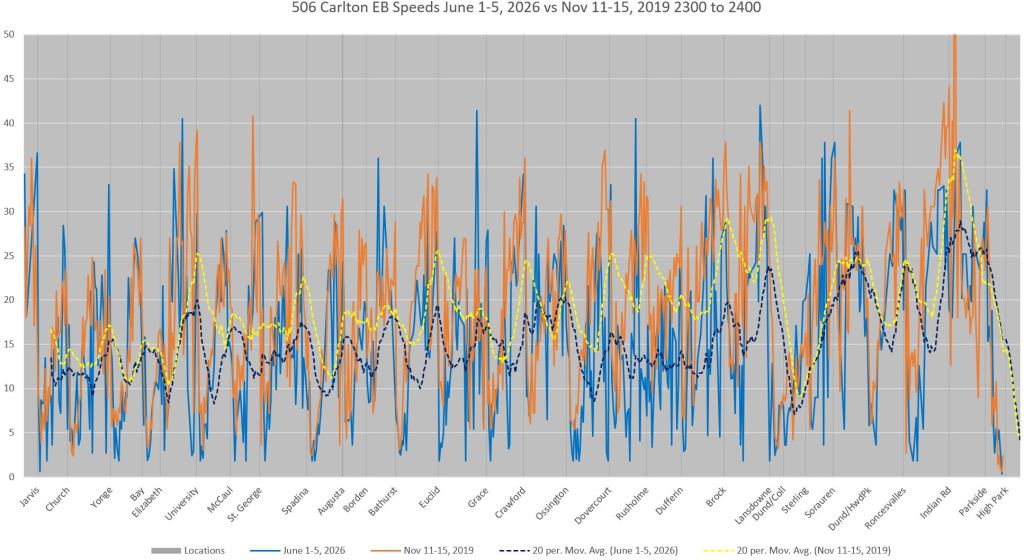
The solid lines show the average speed at each 10m segment along the route, while the dotted lines show moving averages. 2026 data are shown in blue, while 2019 data are in orange and yellow. The 2019 values generally run higher than the 2026 values. This corresponds to the spread shown in the charts above comparing travel times over route segments. The effect varies by location and time of day.
Unlike 510 Spadina, the speeds vary through the day and are noticeably faster in the evening. There is no extended segment with very slow speeds as on Spadina. There is one consistent dip west of Lansdowne due to cars holding for traffic signals at Dundas & College. This occurs in both directions.
The east end of the route, from Main Station to Broadview, generally operates faster than the west end. This is likely due to a lower level of commercial activity, particularly in the evening, and the traffic it brings.
Westbound


Eastbound
These charts show similar data to the westbound charts above. They should be read from right to left as cars originate at High Park Loop and travel to Main Street.





Dwell Times
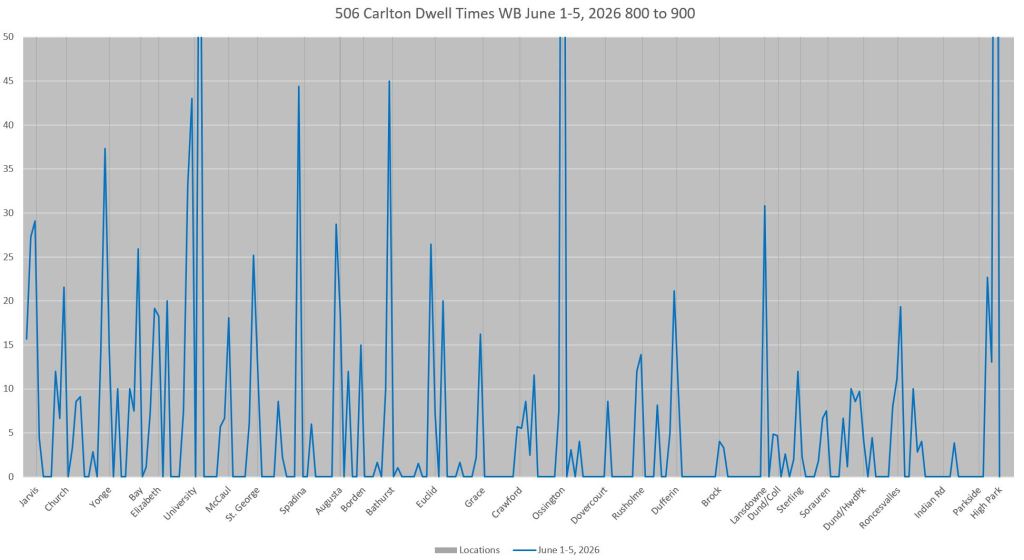
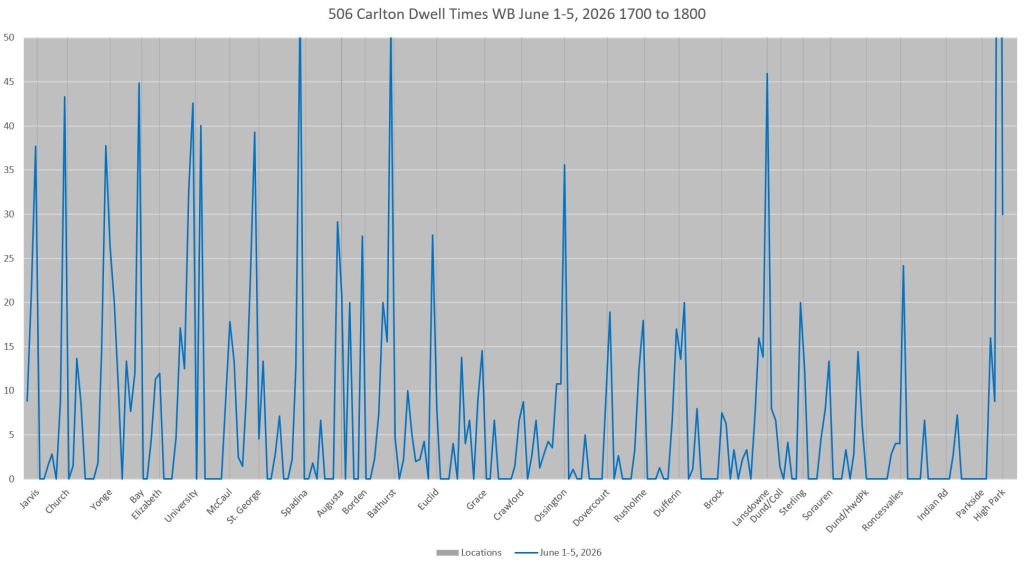
The charts in this section show the average time taken stopping along the route. The higher the bar, the longer a streetcar is likely to be stopped for an extended period.
Unlike Spadina which has reserved lanes and standard stopping locations, Carlton cars can find themselves stopped at various places notably while pushing ahead through traffic to get to a stop. The peaks for some stops have a greater spread in these charts because a car can be stopped anywhere over a longer distance. Note that there are many more peaks in these charts in the central area than there actually are stops.
There is very little transit priority on 506 Carlton, and it is partly limited by almost all stops being nearside. Streetcars can benefit from an extended green if a car moves off quickly enough to take it, but equally a stopped streetcar can “miss” its green and be forced to wait for the next cycle.
All of the dwell times shown are values in excess of the 20s time interval used to consolidate the tracking data.
Revised August 3 at 10:00am:
The first set of charts here uses a 10m segment size for the position of streetcars. On a route like Spadina where traffic does not accumulate between the streetcar and the stop location, almost all stops are served with the front of the streetcar in the same 10m segment. This produces compact spikes showing vehicle locations. On a street with mixed traffic, a streetcar might stop short of the normal location due to traffic, and the location of the dwell time could be counted against adjacent 10m segments smearing out the peak.
The second set of charts added below uses a 30m segment size so that except for severely congested areas, the dwell time at a stop is assigned to a single segment. Where there is congestion approaching a stop, this is more clearly shown with a 30m segment length because dwell time before the stop is unlikely to be used for stop service time.
Because the segments are longer, it is possible that a spike in the chart will lie beyond the vertical line marking a street. This happens when the stop is physically toward the “back” of its 30m segment.
Westbound (10m segment size)
These charts use a 10m segment size for plotting locations of longer dwell times. As explained above this causes dwells at stops to be spread out if there is any traffic preventing streetcars from pulling up to their normal stop location.


Westbound (30m segment size)


Eastbound (10m segment size)
Streetcars are held at many locations along the route, especially in the PM peak, and this is not just in the core area. Note the long wait times eastbound between Coxwell and Main caused by traffic congestion on Upper Gerrard.


Eastbound (30m segment size)


 Steve Munro
The Carlton car runs through so many different neighbourhoods, that efficient operation requires inspectors with a fine knowledge of the route. Howard Park is not College at Bathurst is not Gerrard and Broadview, etc.
And as pointed out, Upper Gerrard (and Howard Park) can be quiet streets much of the time, but turn into major arteries during rush hour. One size does not fit all. Too bad so many inspectors are sitting somewhere looking at screens instead of being out on the route itself.
LikeLiked by 1 person
Will the upcoming Gerrard Station on the Ontario Line be built with a Streetcar loop for short turn service? Any east of the Don River destination not in the Beaches or along Kingston Rd via the 506 eastbound would likely have the fastest route be via the Ontario Line, reducing the demand for an already low(ish) ridership portion of the route.
Steve: No. Plans for a loop at Gerrard Station that would also be used by an extended 505 Dundas were dropped to save money on the project.
LikeLike
So you’re assuming no one ever travels to lower Gerrard except within a few blocks of Carlaw? People who live along upper Gerrard don’t count? People who want to travel to anywhere east of the Don from anywhere north of Dundas Street don’t count? The Ontario Line won’t speed those trips much, if at all, and will require more transfers, which both slows the trip down and makes it less convenient.
It beats me why it’s so hard for so many enthusiasts to comprehend that transportation needs to be a network, and that intermediate stops matter at least as much (and often more) than endpoints. And that the point is to make it easy to get around by transit, not to draw lines on maps.
Yes, I am feeling grumpy today.
LikeLiked by 3 people
This past Saturday I went for a nice swim at Greenwood Park. Afterwards, at the corner of Gerrard & Greenwood, I waited 30 minutes for either a Greenwood bus or a Carlton car, but the streetcar arrived first. A fairly large group of passengers, 20+ people, (clients, customers, public) as waiting for it (but nobody else but me waiting for the potential bus).
Steve: No. Plans for a loop at Gerrard Station that would also be used by an extended 505 Dundas were dropped to save money on the project.
For the most part TTC service is good, but the chintzy attitude is not going to make it more attractive and reduce auto use.
LikeLike