This article continues a series about service quality on some of the TTC’s shorter routes.
63 Ossington has a similar scale to the 47 Lansdowne reviewed in the previous article in this series. Although the service is far from ideal, this route is better behaved than its neighbour, even though it is subject to severe traffic congestion at certain times near its northern terminal due to Line 5 Crosstown construction.
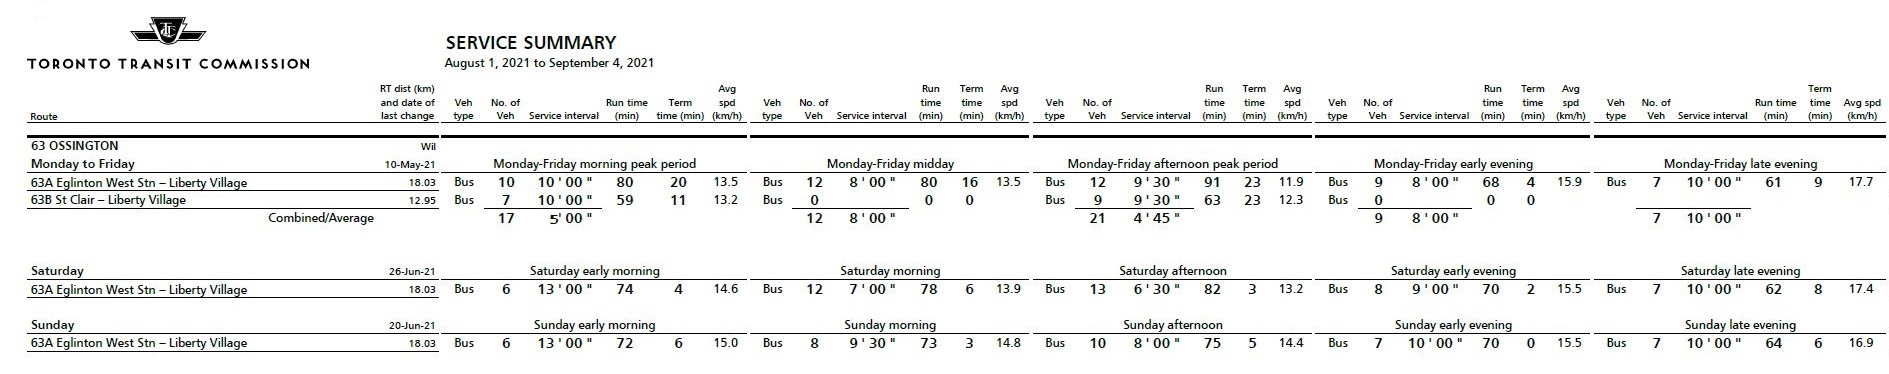
All service on 63 Ossington operates between Liberty Village and Eglinton West Station except during peak periods when half of the service turns back at St. Clair via Oakwood Loop.
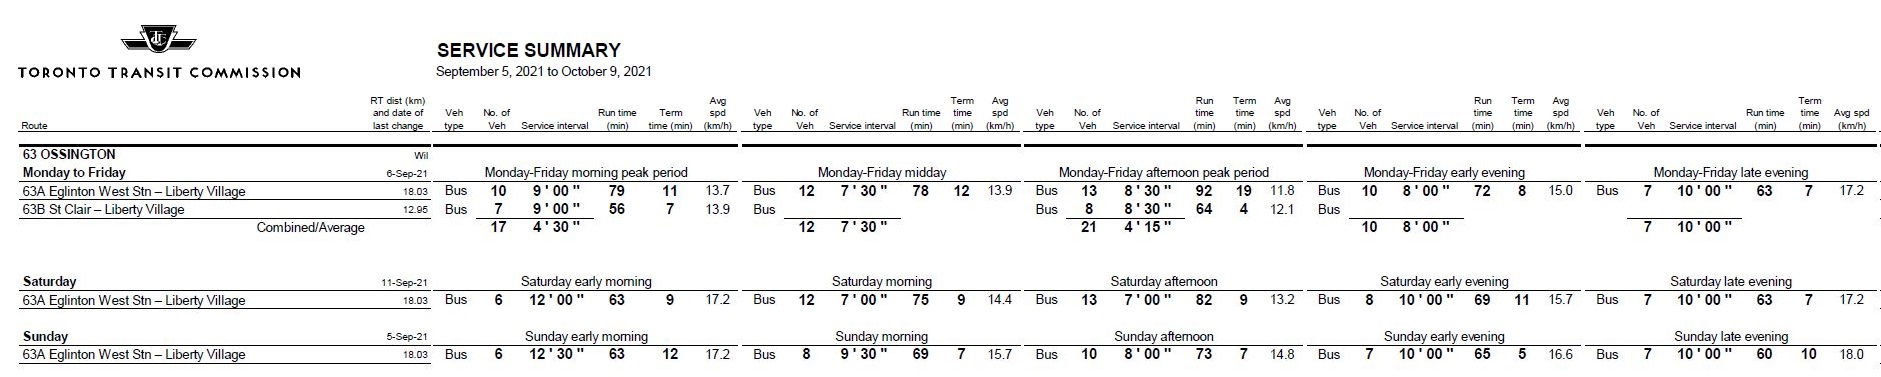
The schedules were changed on Labour Day weekend, and so data shown here for the first week of September reflects the old schedule, while from Sunday, September 5 onward, the new schedules were in effect.
In most cases running times have been trimmed although in a few periods they have been lengthened. These changes allowed more frequent service to be scheduled without adding buses to the route. This is a reversal of past TTC practice which has seen headways widened as a way to provide more running time at no marginal cost.
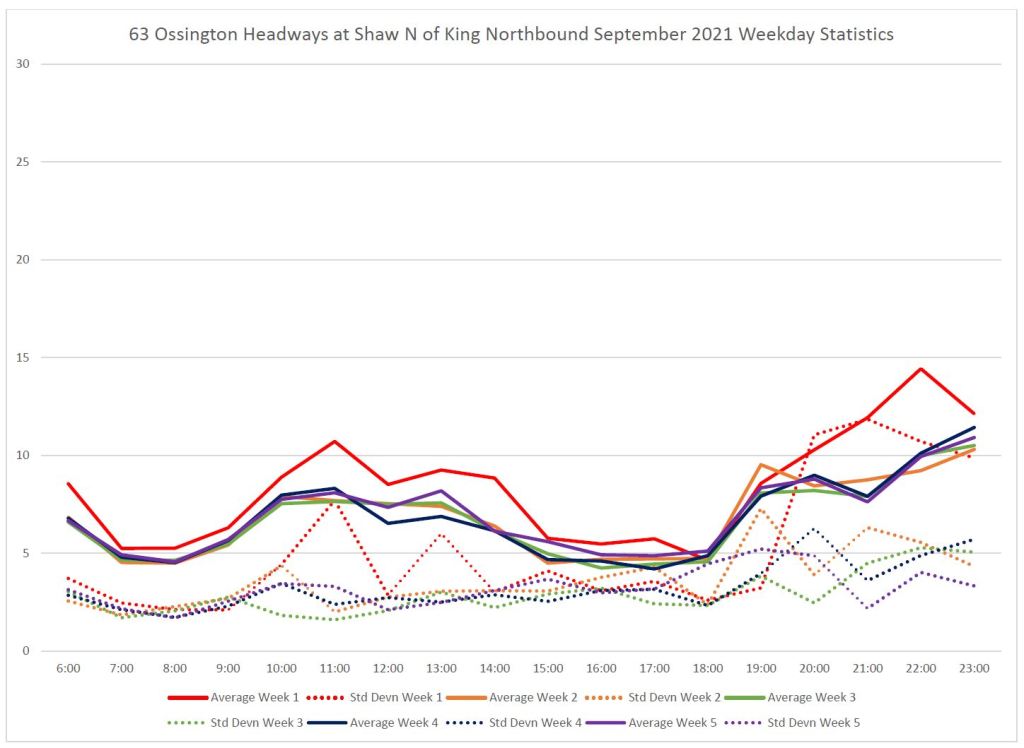
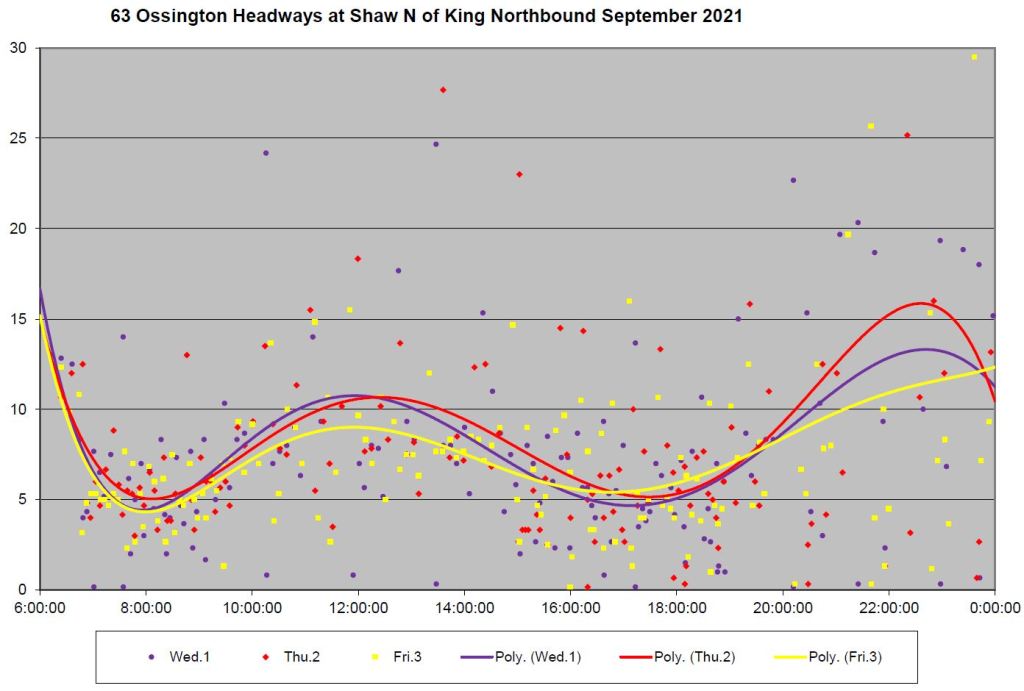
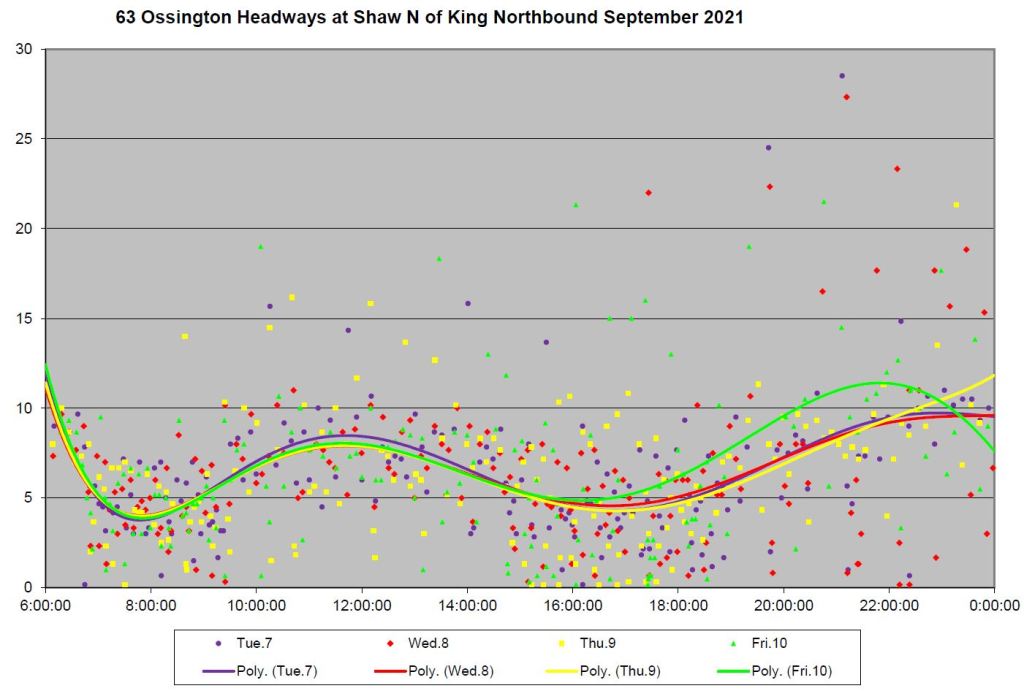
The TTC’s goal for “on time performance” is a band six minutes wide (+1 to -5 minutes relative to schedule), and in some periods, much of the service lies within this band. Nonetheless, on headways ranging from 5 to 10 minutes, bunching is possible and shows up regularly with data points near the x-axis of these charts. Wide gaps, especially at evenings and weekends, are common.
Unlike Lansdowne, this route has no branching structure during most of its operation, particularly when headways are wider. Also, as we will see later in the daily analyses, the congestion at Eglinton West Station occurs mainly during the pm peak, and buses have enough running time that they can take layovers there even after being stuck in traffic approaching the station.
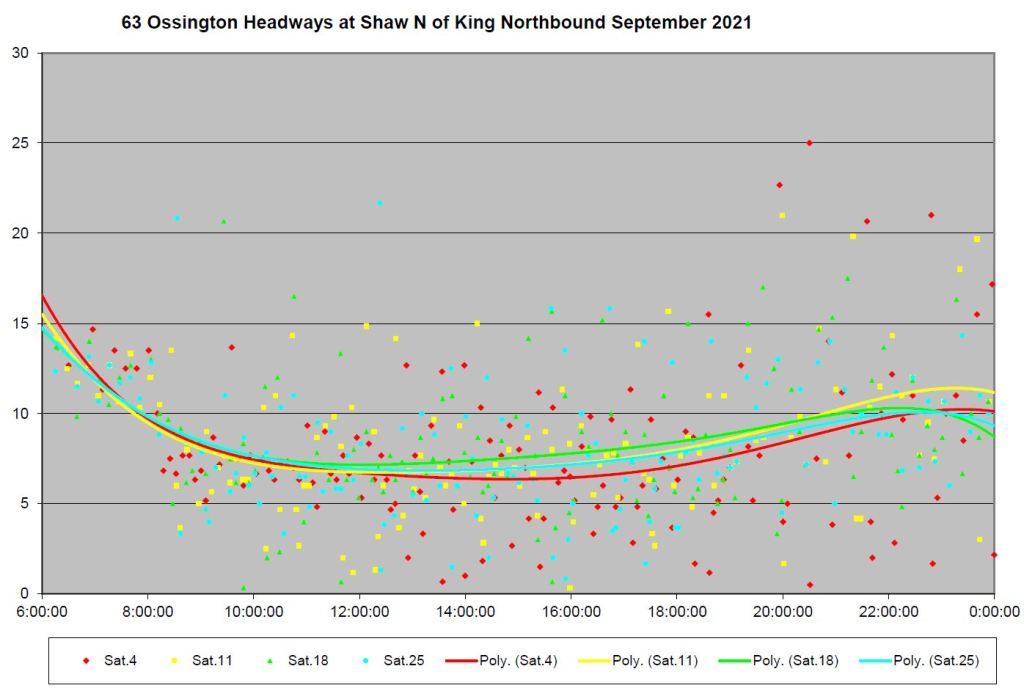
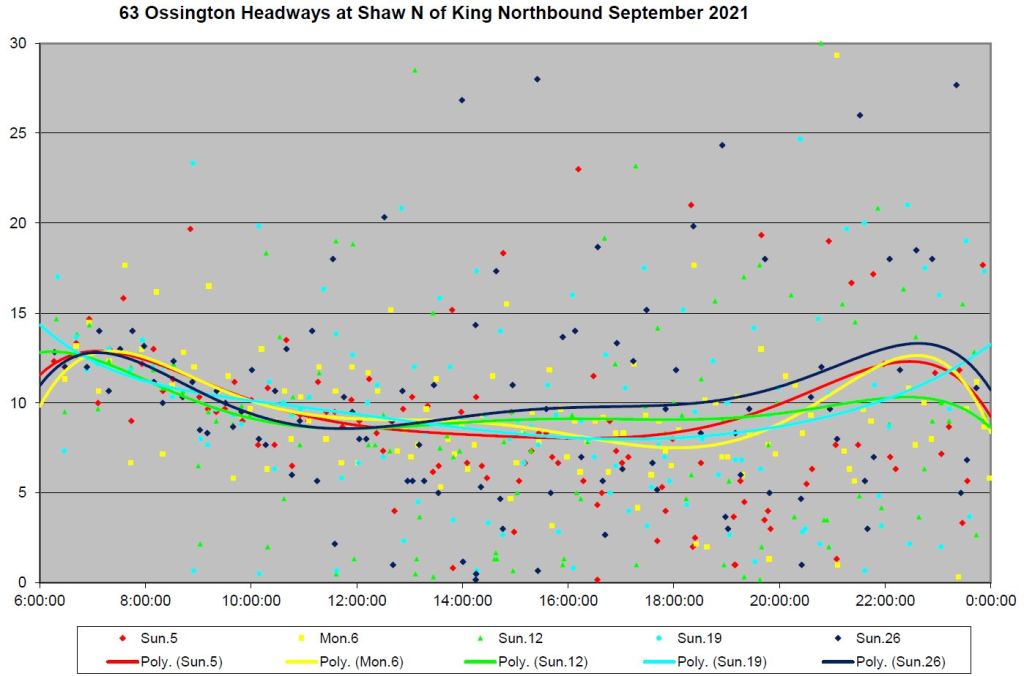
Northbound from King
At the south end of the route, buses operate around a long on-street loop through Liberty Village. Their typical layover point is on Atlantic Avenue northbound south of King Street. The screenline used for these analyses is on Shaw Street just north of King where the loop begins.
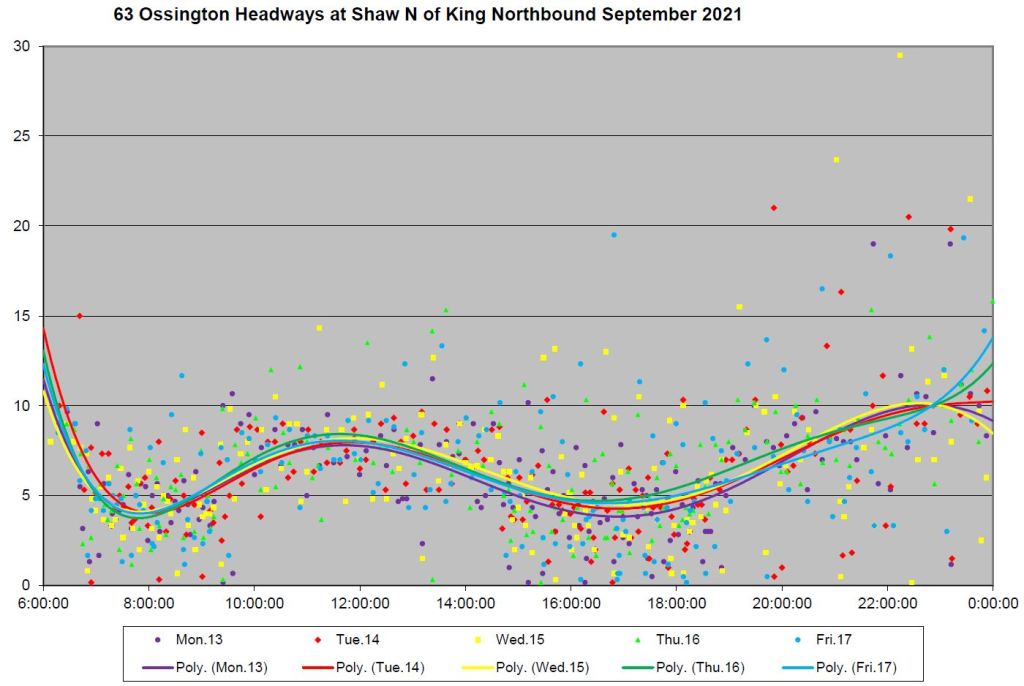
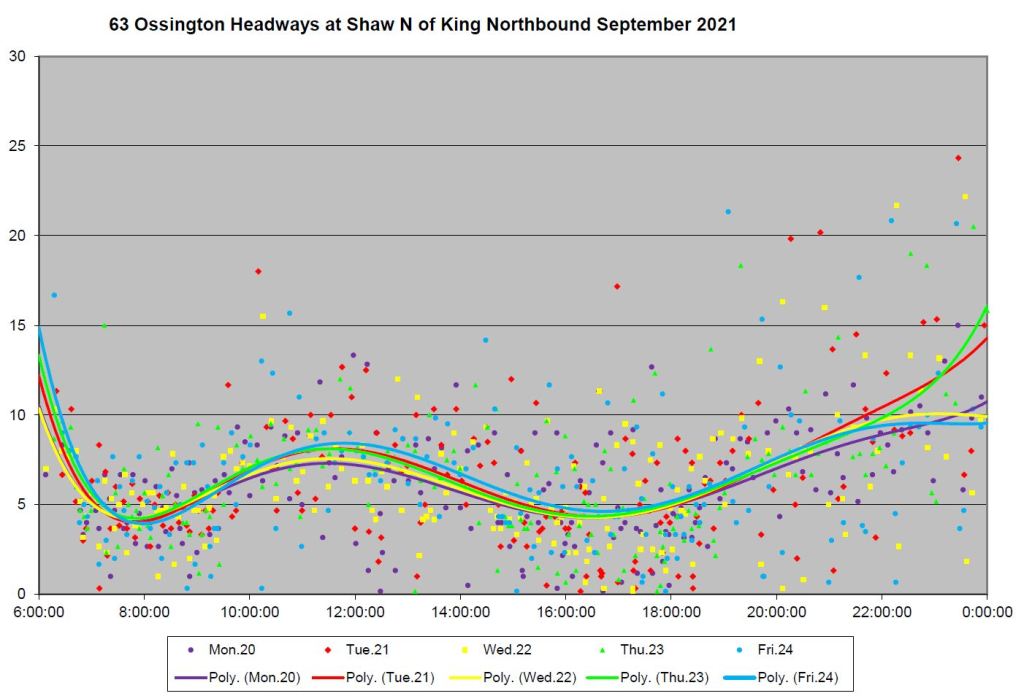
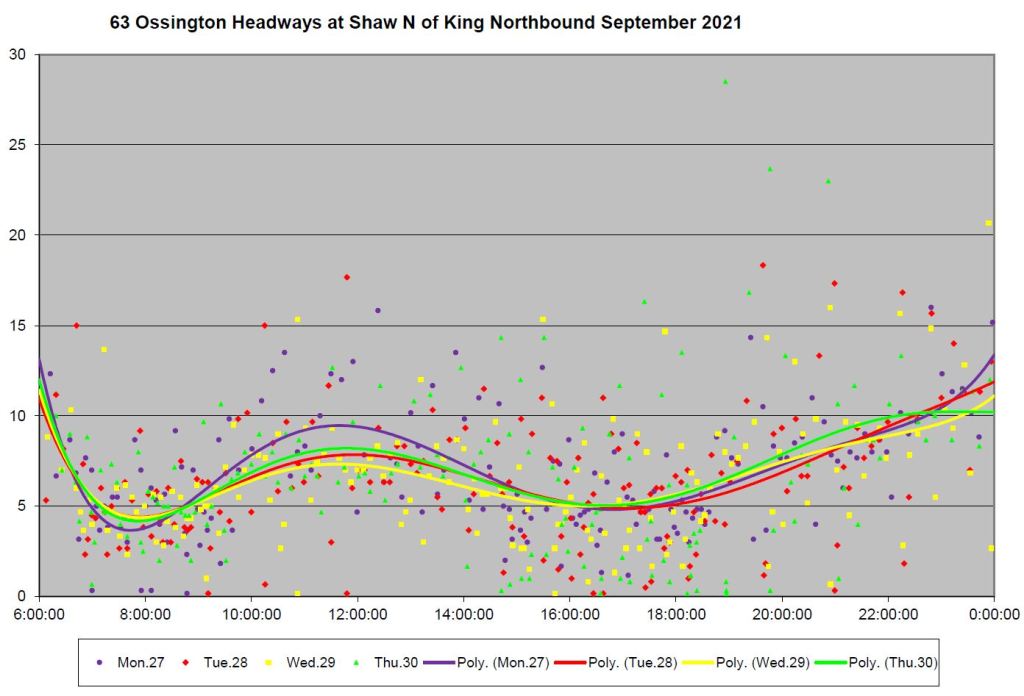
The weekly headway summary and the week-by-week charts show the schedule change with the shape of the weekly averages and daily trendlines.
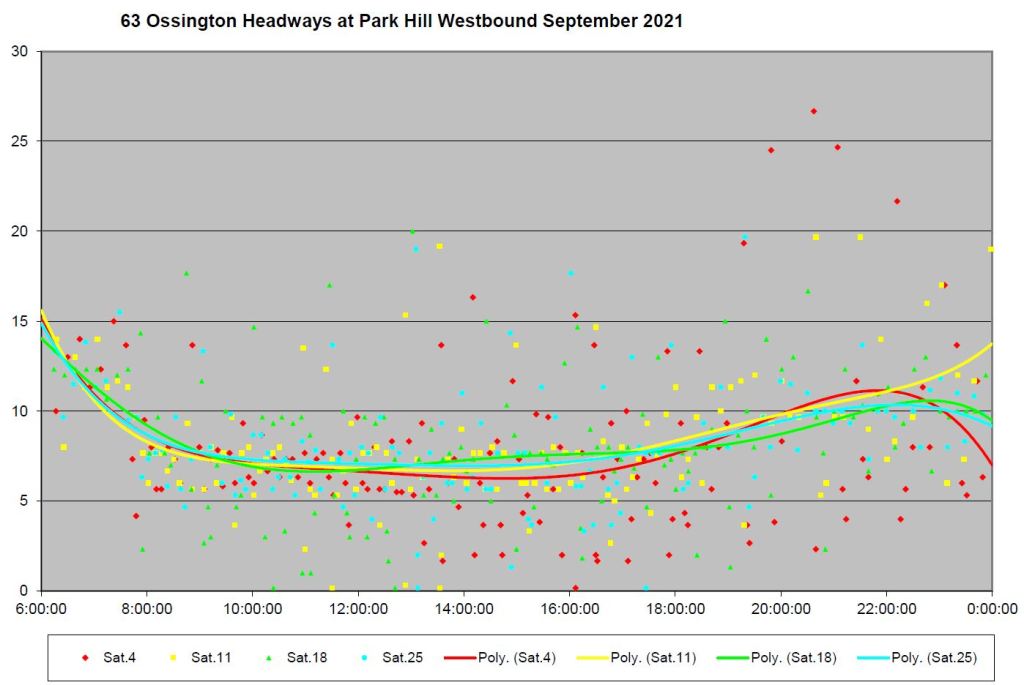
Weekend data points are far more spread out than weekdays showing a very different approach to service management (assuming that there is any) especially on Sundays.
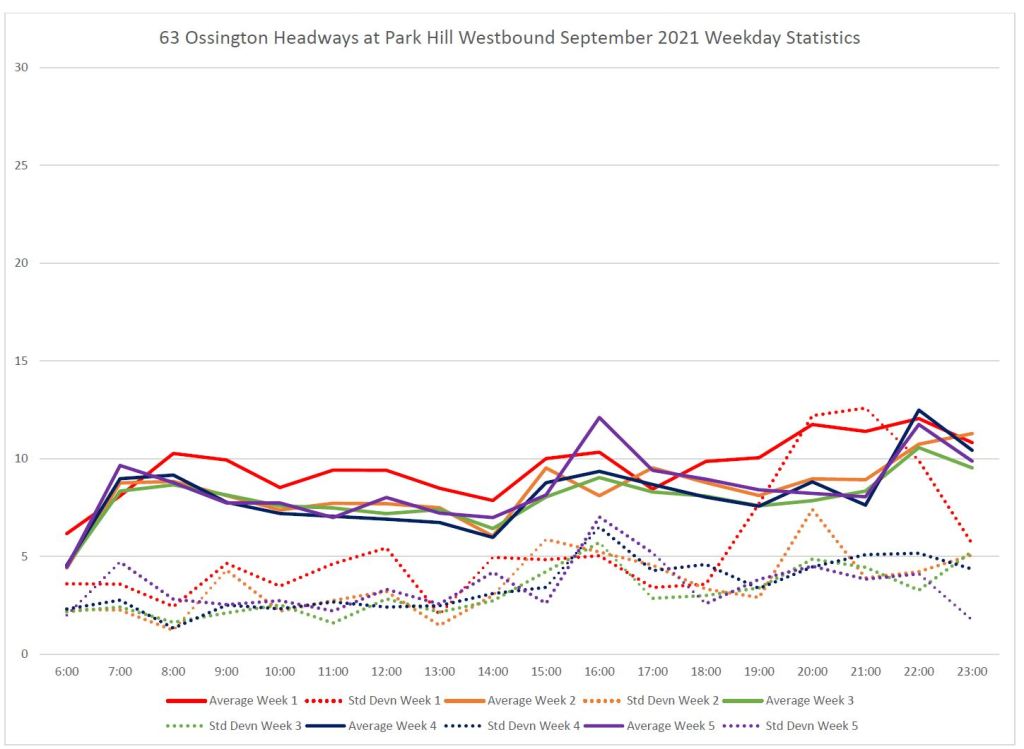
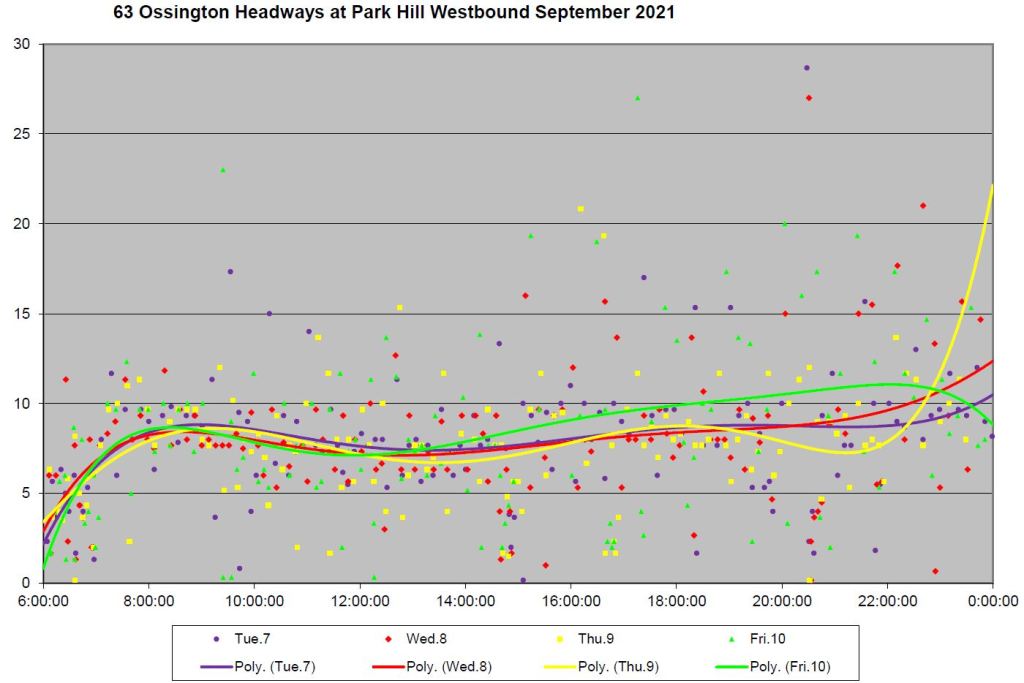
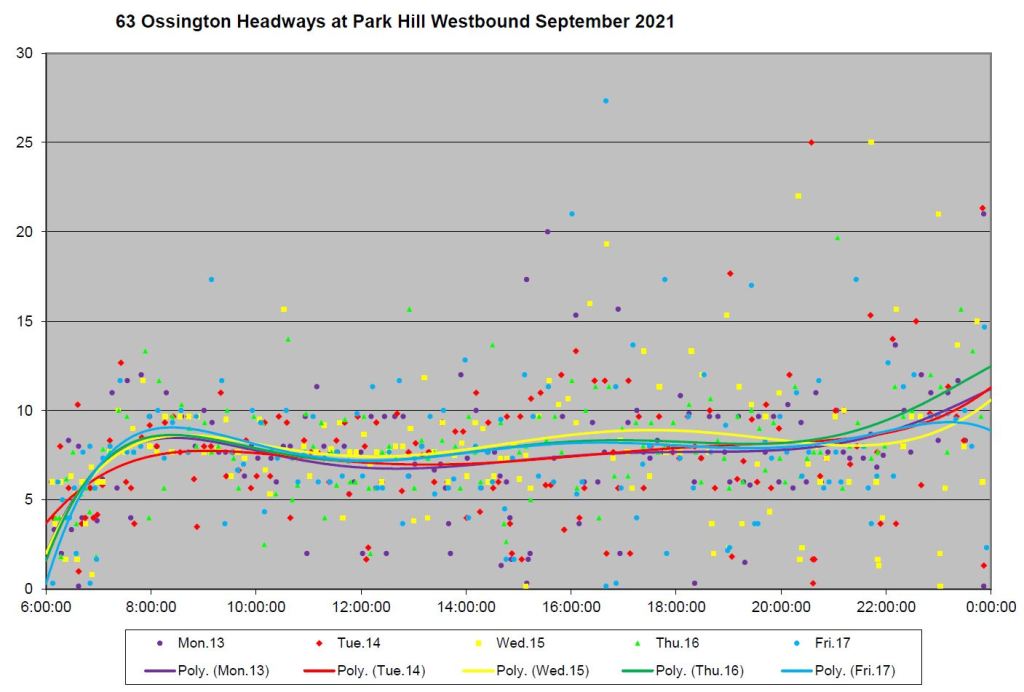
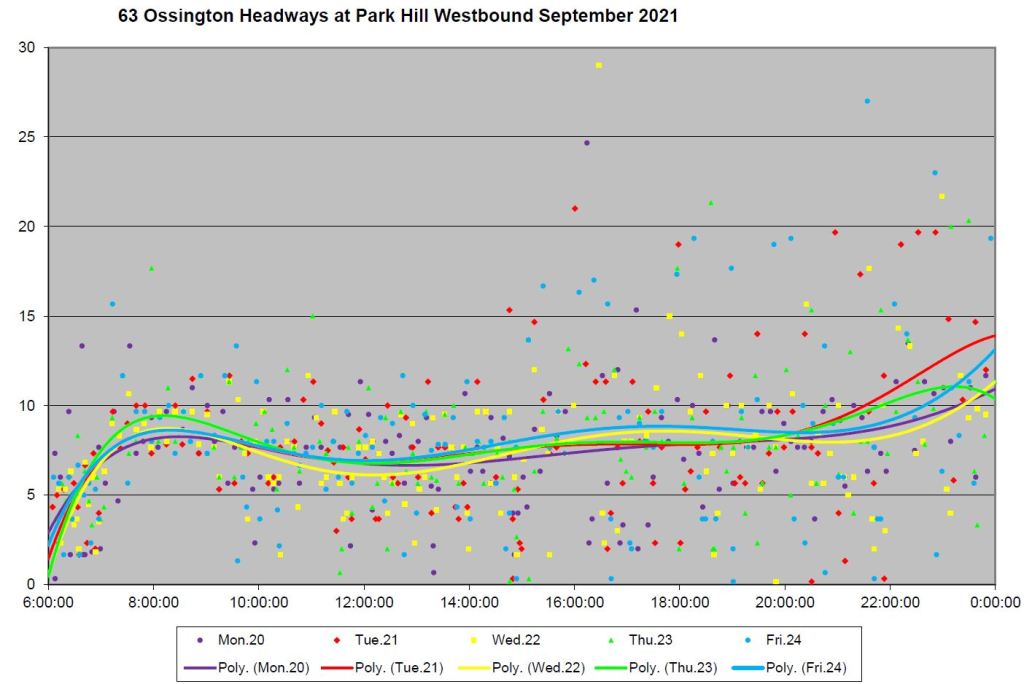
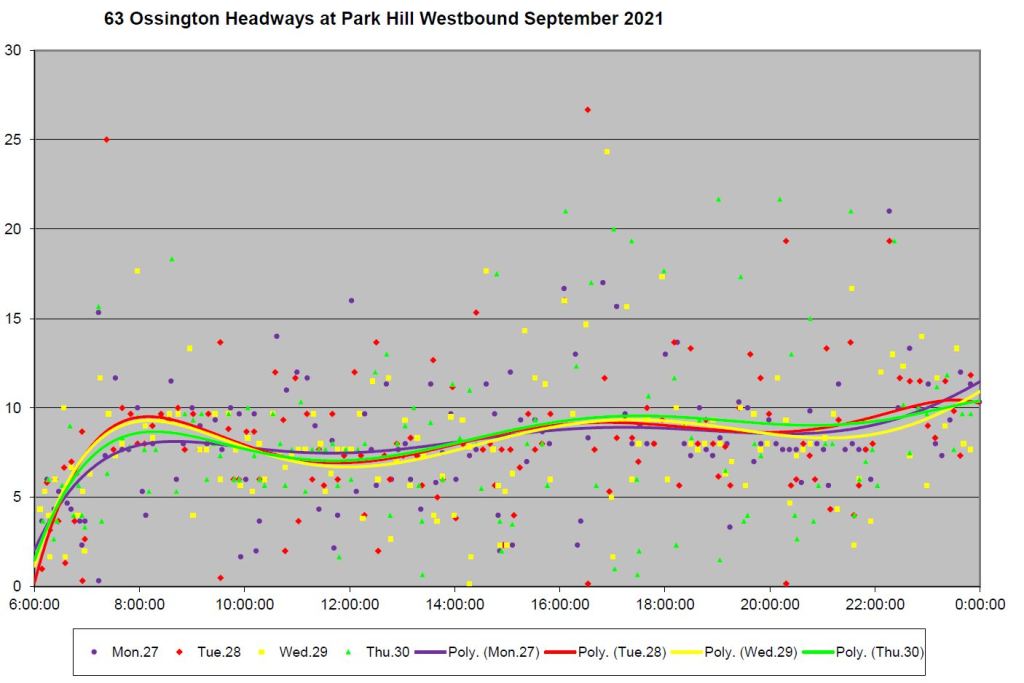
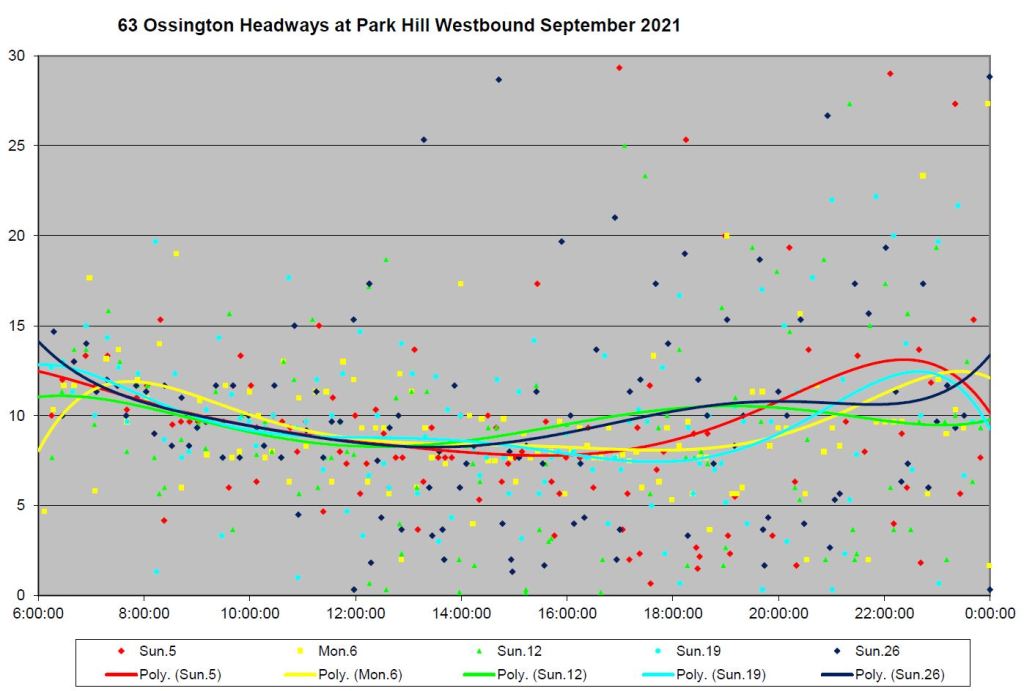
Southbound From Eglinton West Station
The screenline for these charts is at Eglinton & Park Hill Road, just west of the Allen Expressway. By contrast with the data at the south end of the route, weekday headways here are more scattered, especially in week 1. The standard deviation of headways begins the day in most weeks at about 3 minutes, but rises in the afternoon and evening as service reliability declines. The SD values at Eglinton West are generally higher than at King reflecting the wider scatter in headway values.

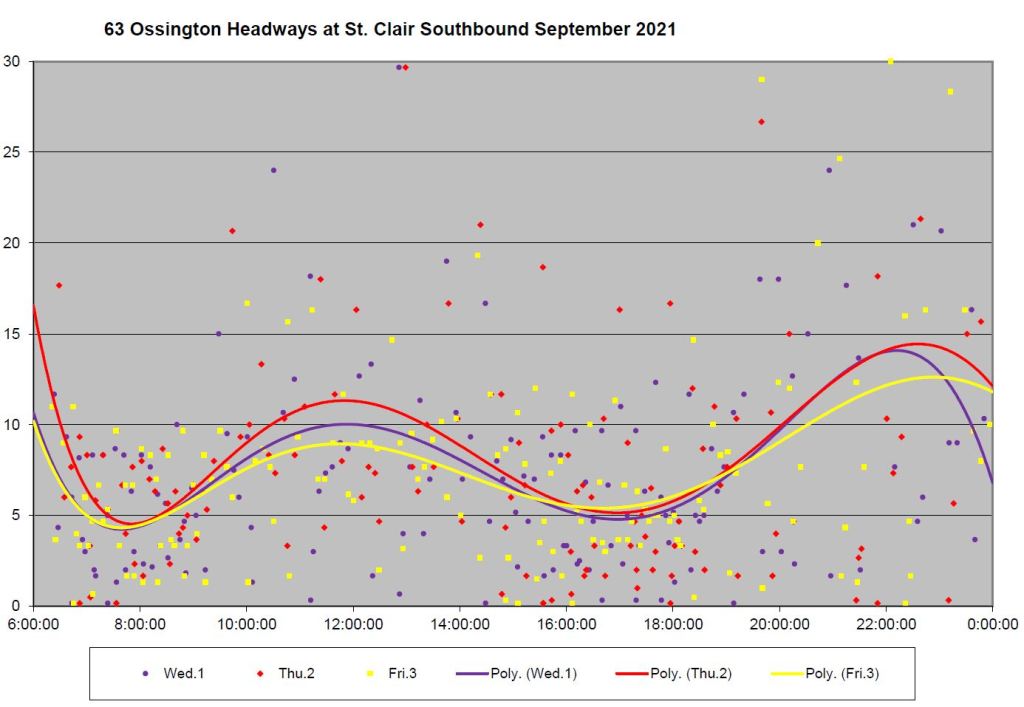
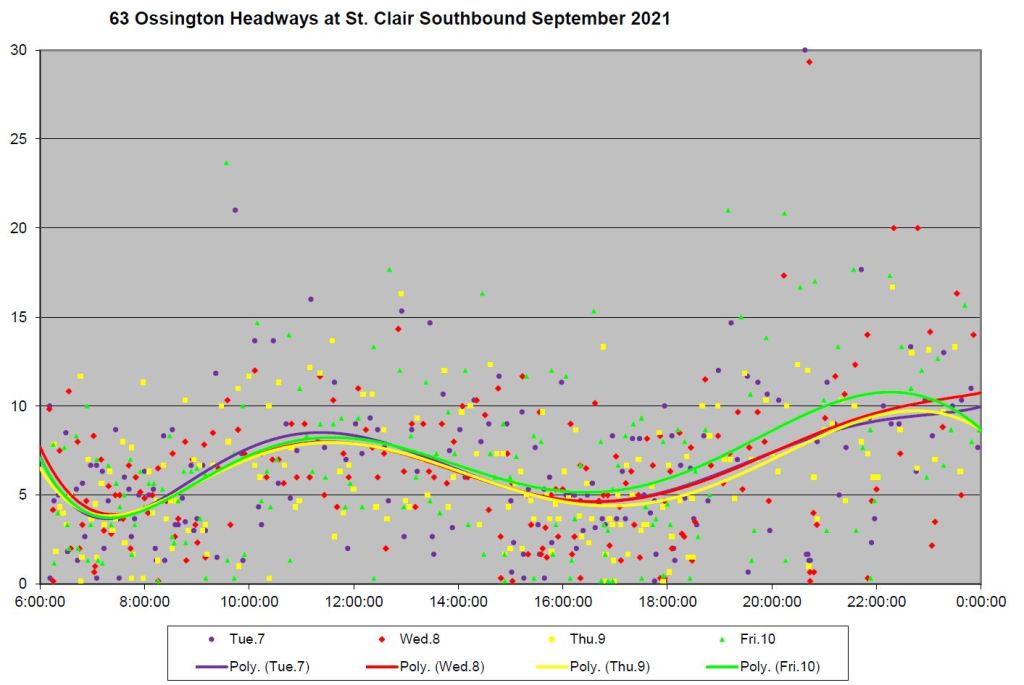
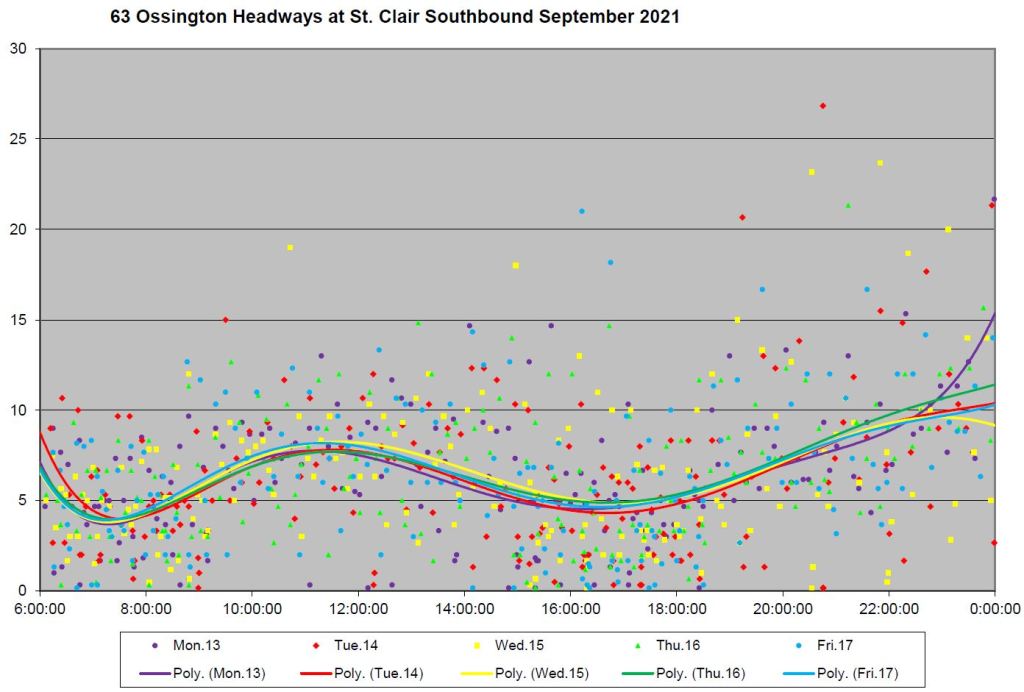
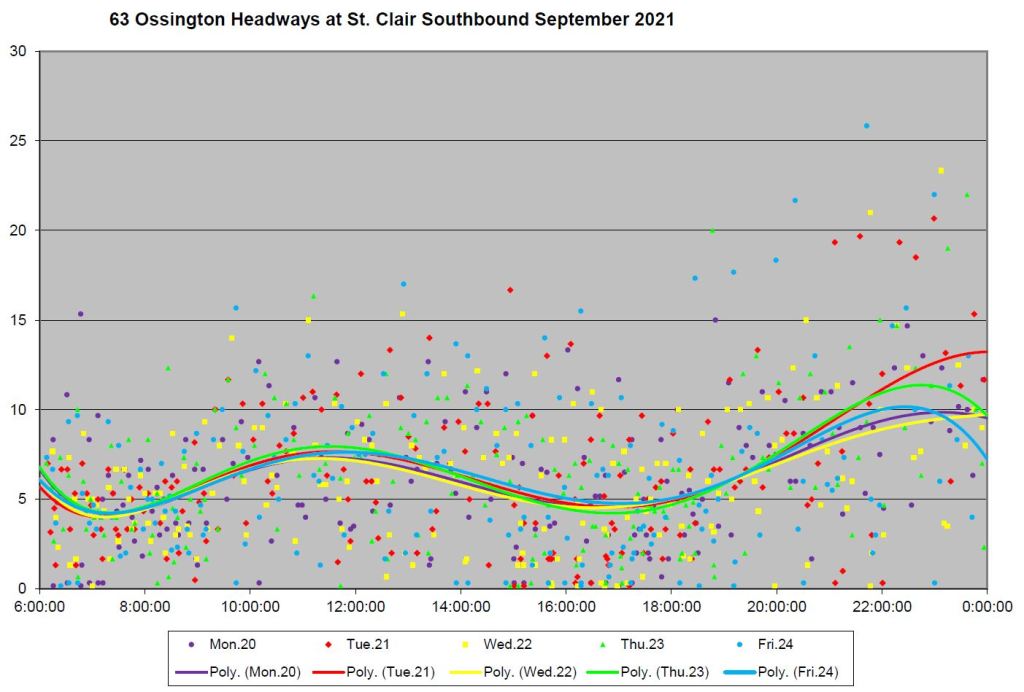
Southbound from St. Clair
These charts are included for weekdays to show the combined 63A and 63B peak service southbound from St. Clair. With all of the service present, the headways are shorter during peak periods, and far more of them are quite short indicating that buses from the two branches probably run in pairs a lot.