This article continues a series reviewing service on relatively short routes within the TTC network in areas where one might expect service reliability to be easily achieved.
Overview
The southern part of the route lies between St. Clair and Queen Street. Every second bus continues north to Yorkdale Station on what was once a separate 18 Caledonia route. (These routes will be split apart at Caledonia Station in 2022 when Line 5 Crosstown opens.) During peak periods, the Yorkdale branch splits at the north end with an alternate route via Orfus to Yorkdale Station.
In addition to the type of problems shown in the previous articles on 22 Coxwell, 47 Lansdowne suffers from having what should be a blended frequent service on the common portion of the route. However, headways are not reliable either from the point where the branches merge at St. Clair southbound, nor at Queen northbound, the route’s southern terminus.
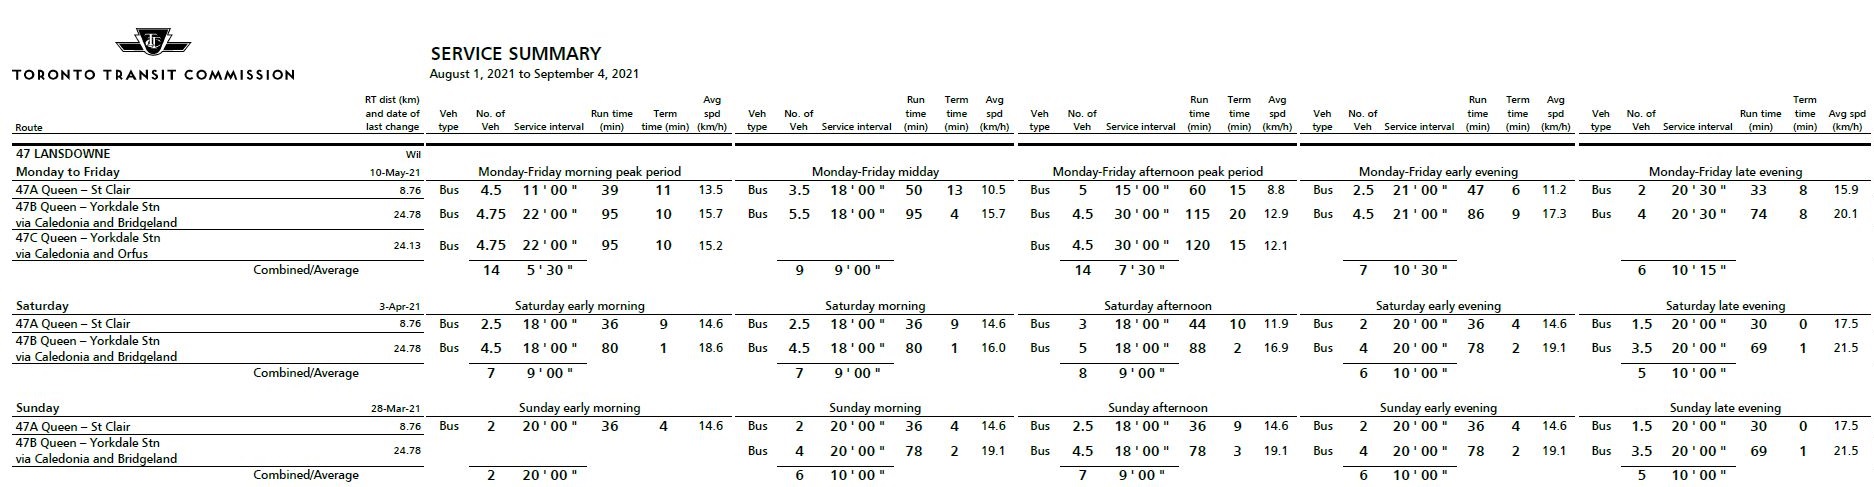
This schedule was in effect from September 1 to 4.
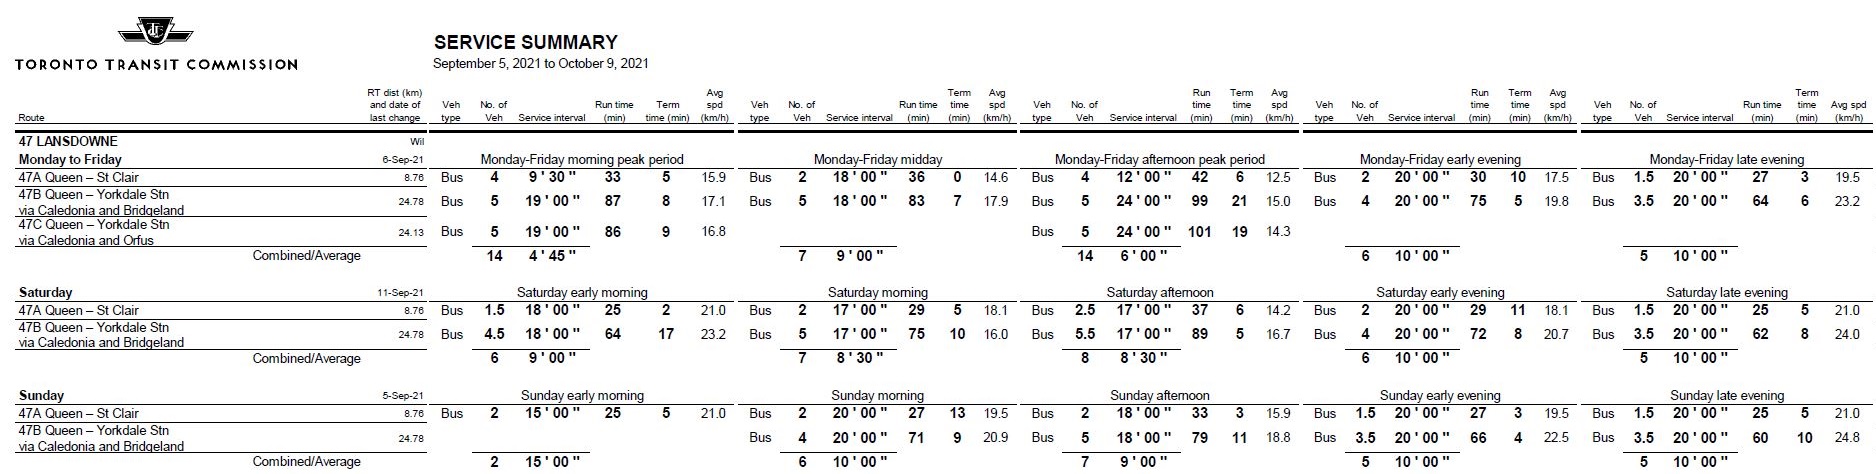
This is the schedule in effect from September 5 onward.
Change-offs, Breakdowns and Crew Changes
A common effect seen across the route is for a bus to disappear from service and, eventually, to be replaced by another in the same relative position.
- In some cases, the same bus re-appears more or less where it disappeared indicating that it probably sat out of service awaiting a new operator.
- In some cases, notably early in the day, a bus will remain in service for one trip or less, and then disappear. This implies that the bus was somehow faulty rather taken out of service because of a missed crew change.
- In some cases, it is possible that a crew change is done by bringing a new bus into service from the garage replacing both the operator and the vehicle. This is not a scheduled event as can easily be seen by comparing operations on similar days (weekday to weekday, for example).
Where buses are missing for even a partial trip on a branch with a wide headway like the 47B Yorkdale service, the resulting gap can be very wide. These events are not reported as part of overall service quality and standards, just as bunching is not reported because it can often occur within the “approved standards” and their considerable margin for exceptions.
Northbound from Queen
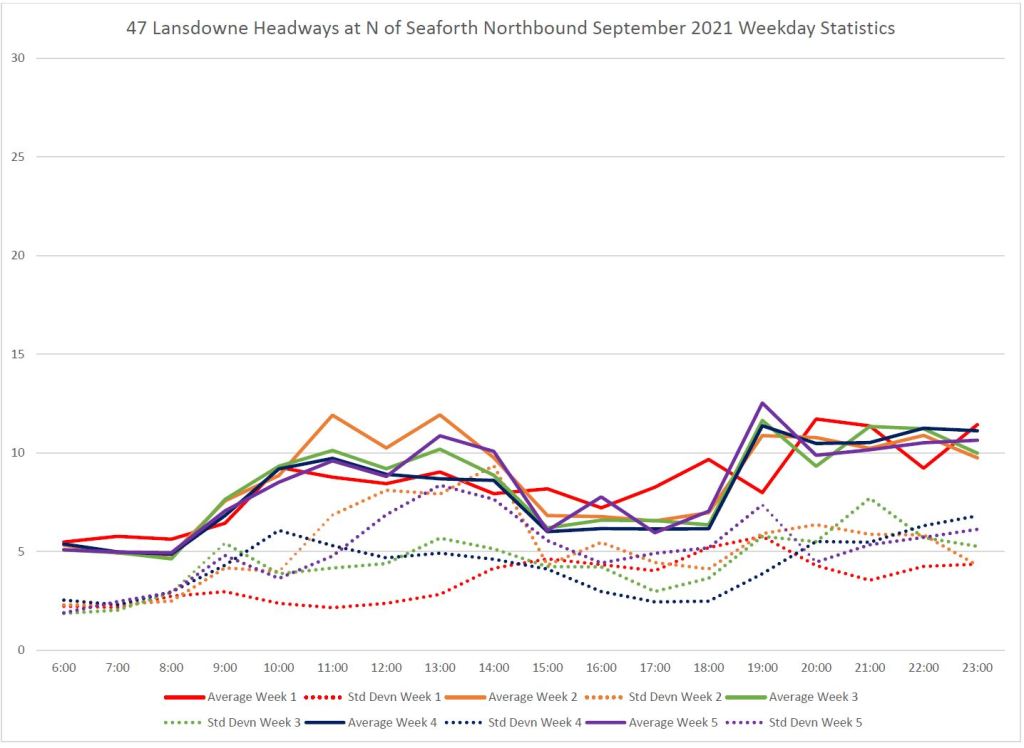
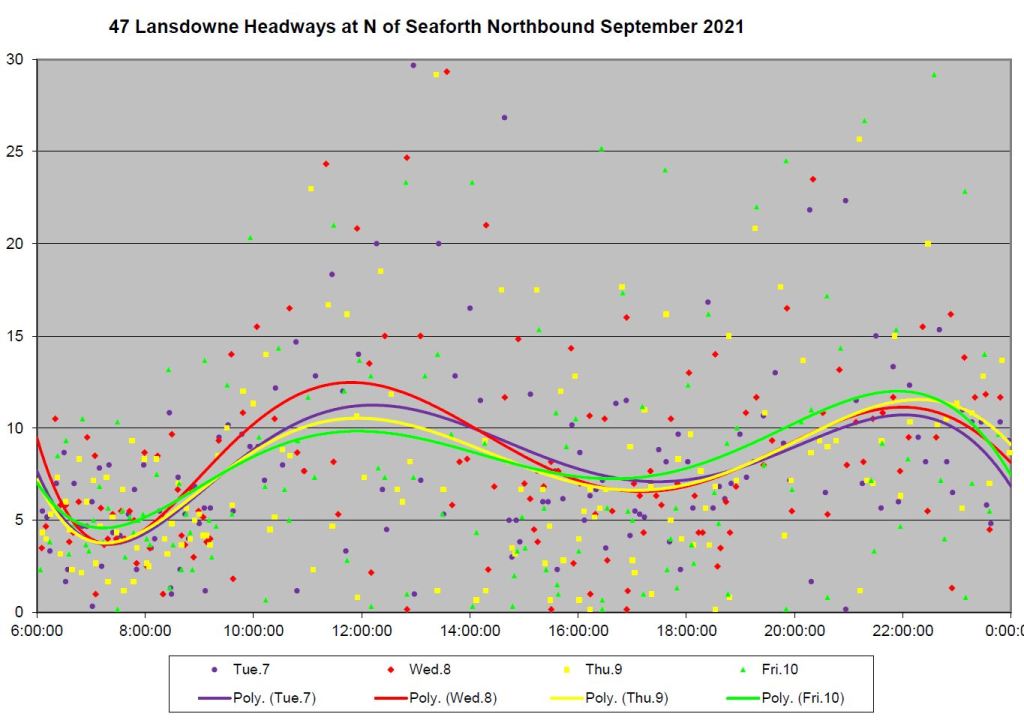
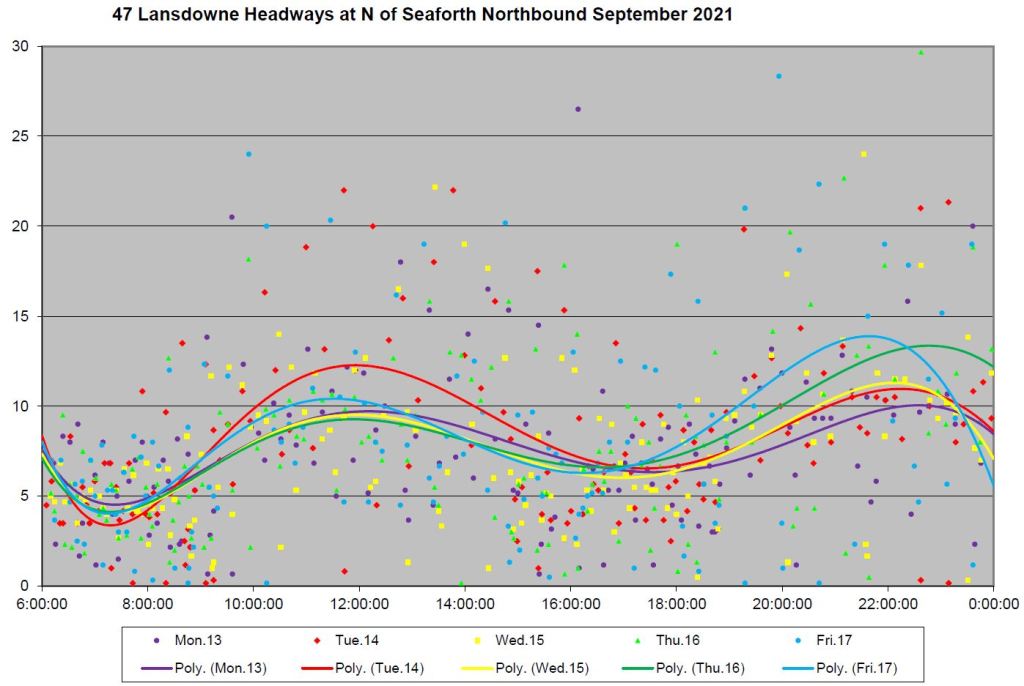
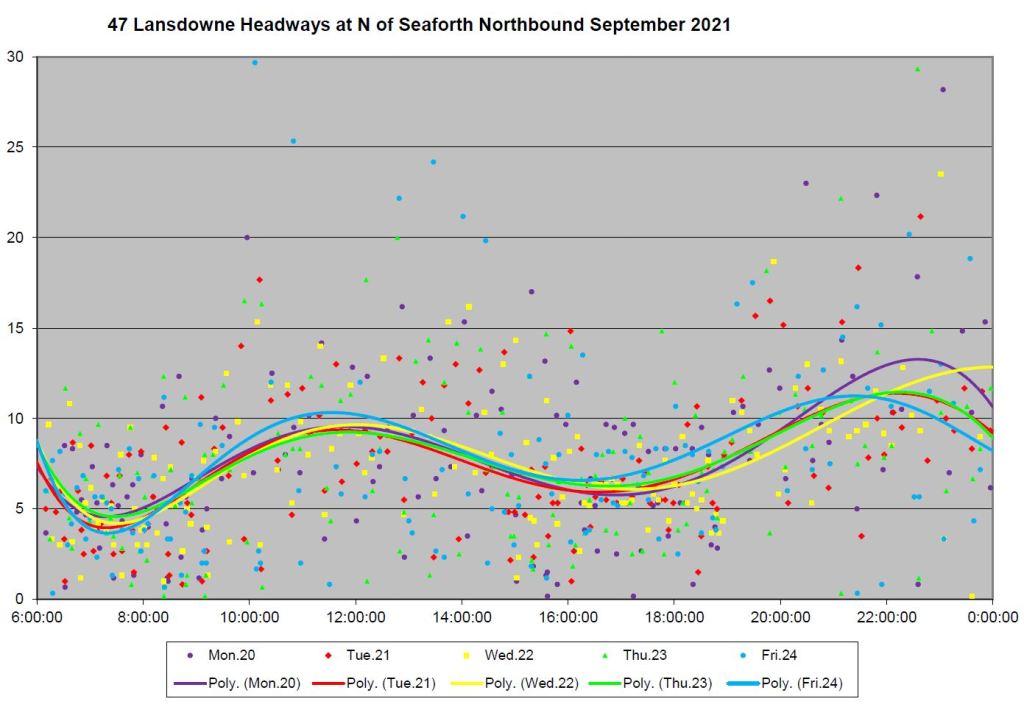
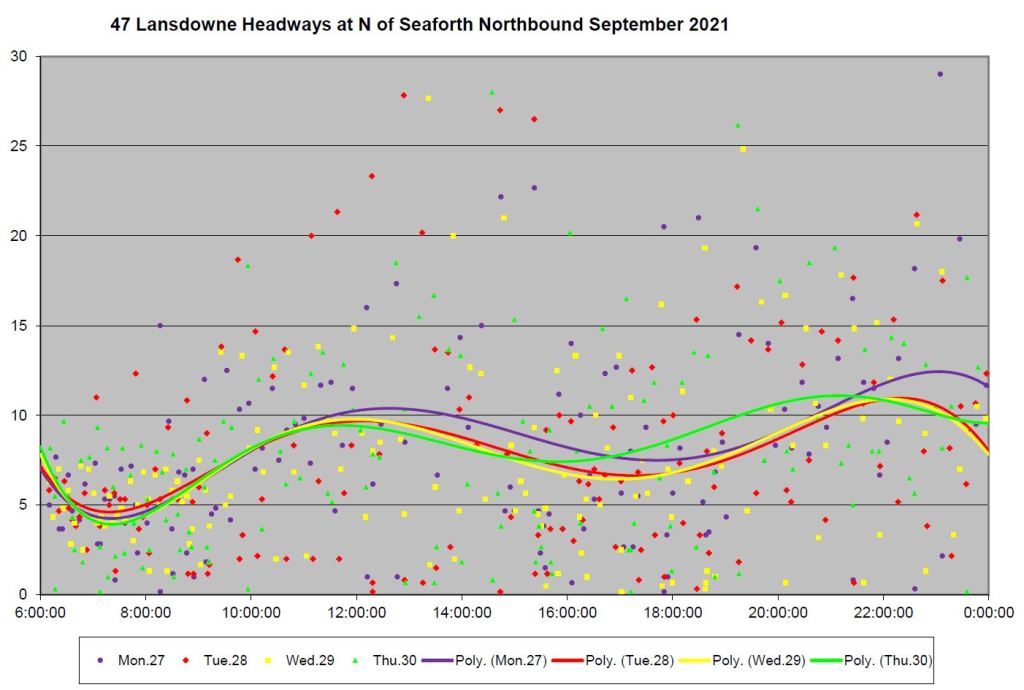
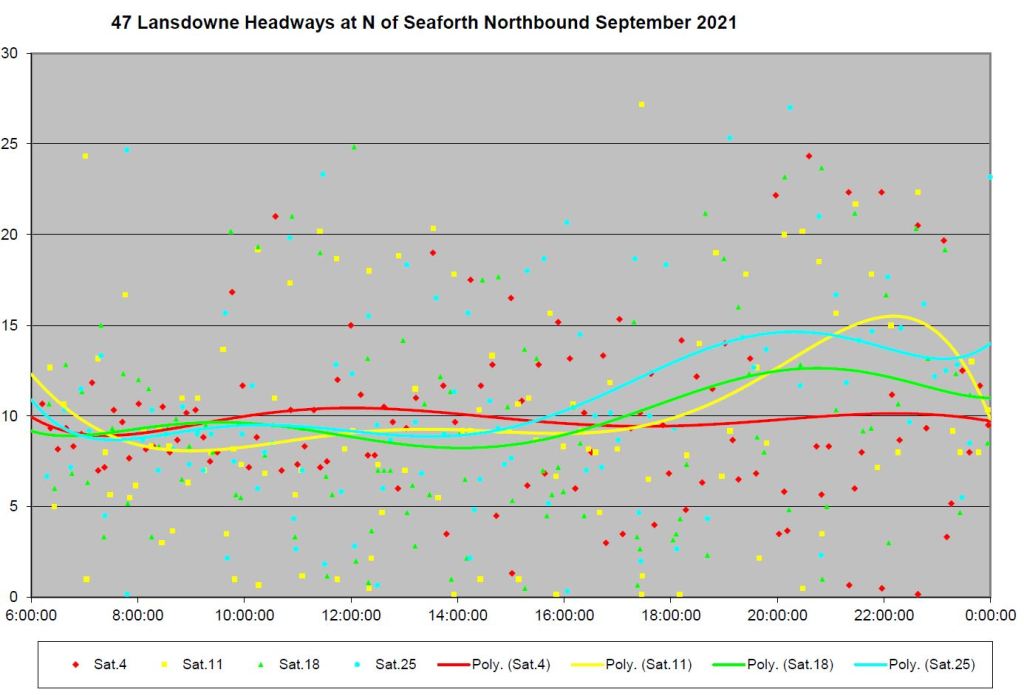
Headways from Queen are measured north of Seaforth, the north end of the on-street loop. The averages and standard deviations of headways are well-behaved only for the first few hours of the day, and they deteriorate from 9am onward. There is considerable difference in values from week to week.
Note that because of the schedule change on the Labour Day weekend, the shape of the trendlines in week 1 of these charts are different than in weeks 2 to 5.
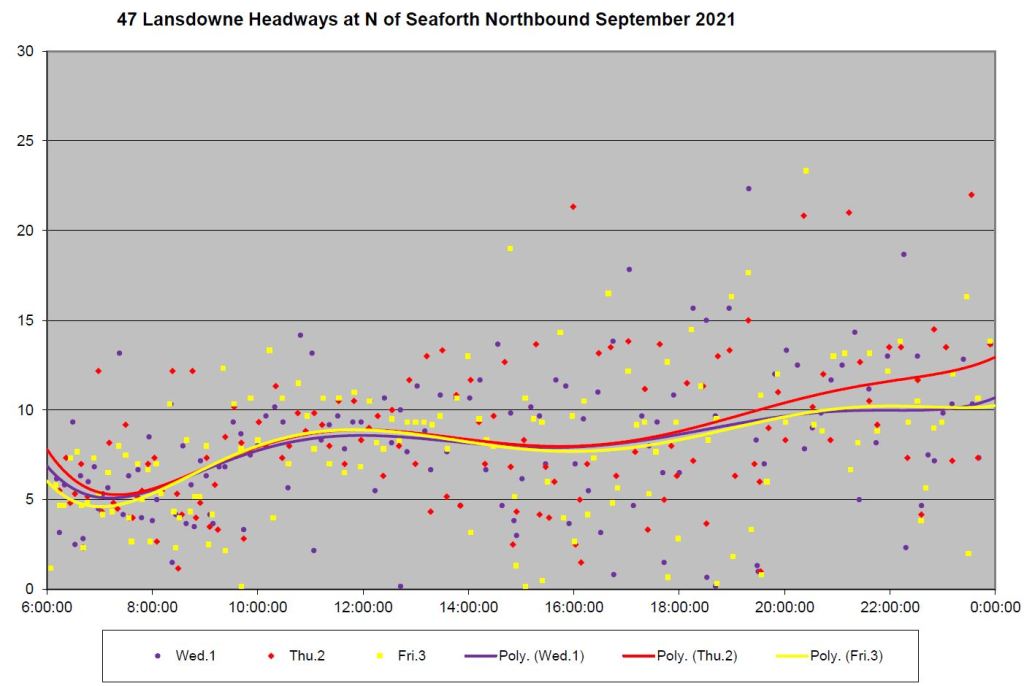
The clouds of data points span a range above 15 minutes for most of the day. This corresponds to the point where the standard deviation values rise after the am peak period. There are so many days with very short headways that I will not review each one in detail here, but give a sample. Days with very wide headways are of particular interest because this typically indicates either that buses are missing, or that bunching of more than two vehicles occurs.
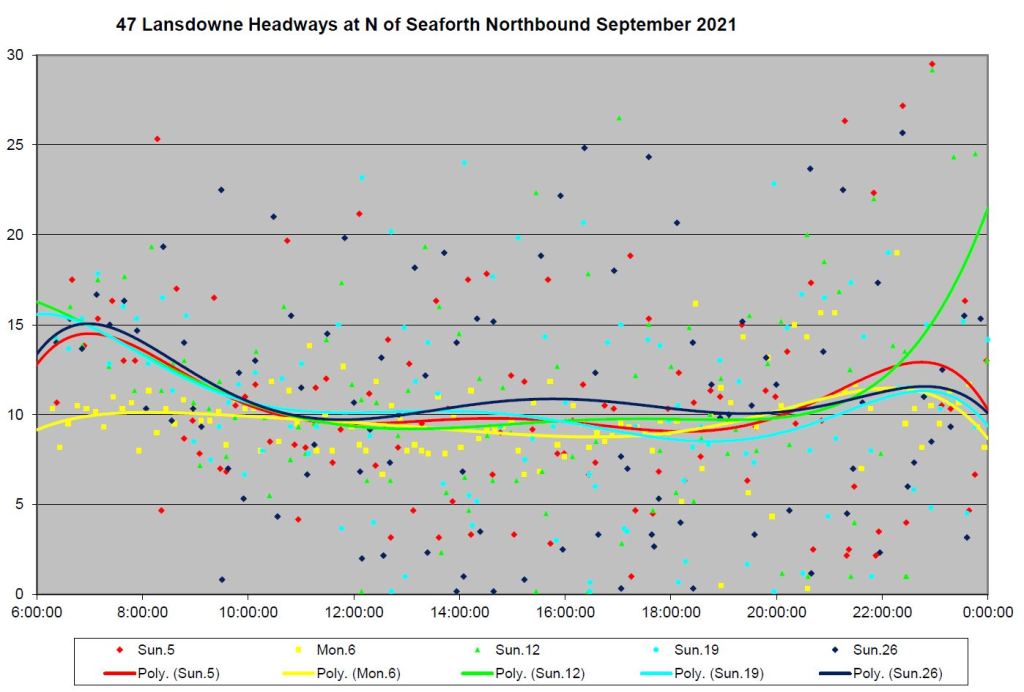
This set of charts is particularly important because it shows the service at a terminal before the effects of passenger loads or congestion could disrupt service. This is also, as of September 5, a new set of schedules where any problems with the schedule itself should have been resolved. If anything, the service is worse in weeks 2 to 5 than in week 1, although this could be due to other factors.
Saturdays show bad bunching and gapping throughout the month. Sundays also show very erratic service except, oddly enough, on Labour Day (an honourary Sunday for these charts) when headways lie much closer around the trend line.
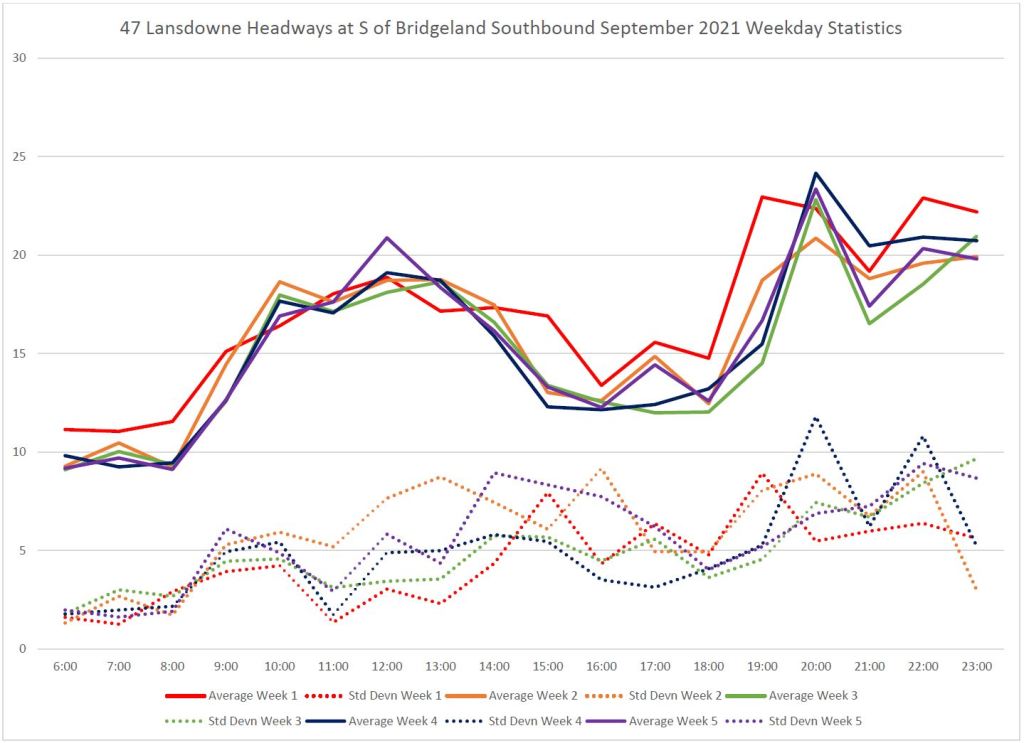
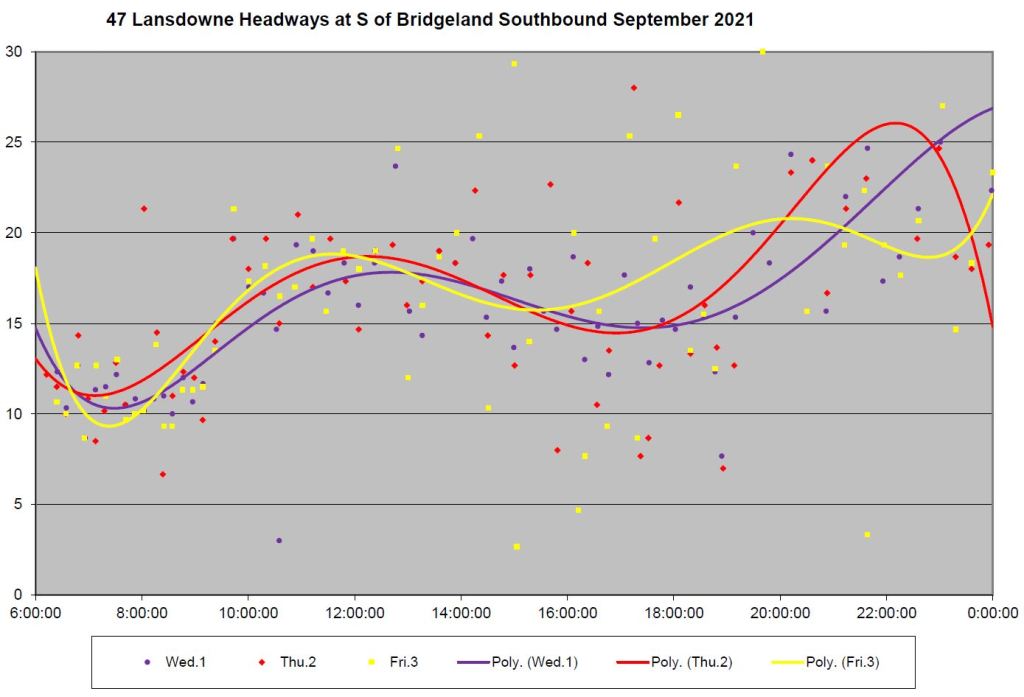
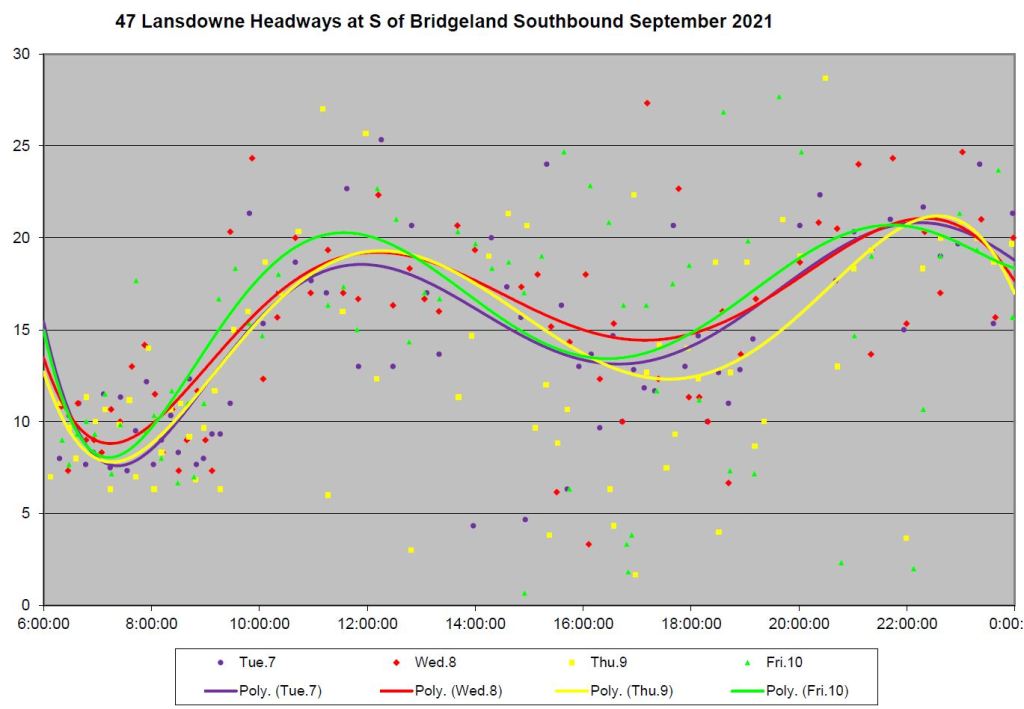
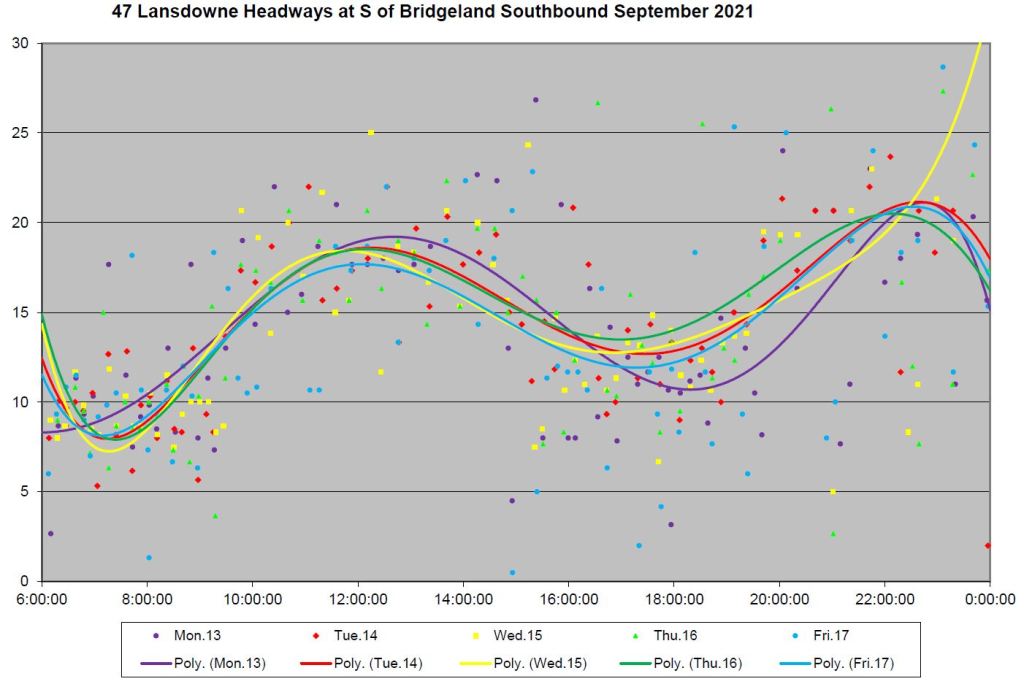
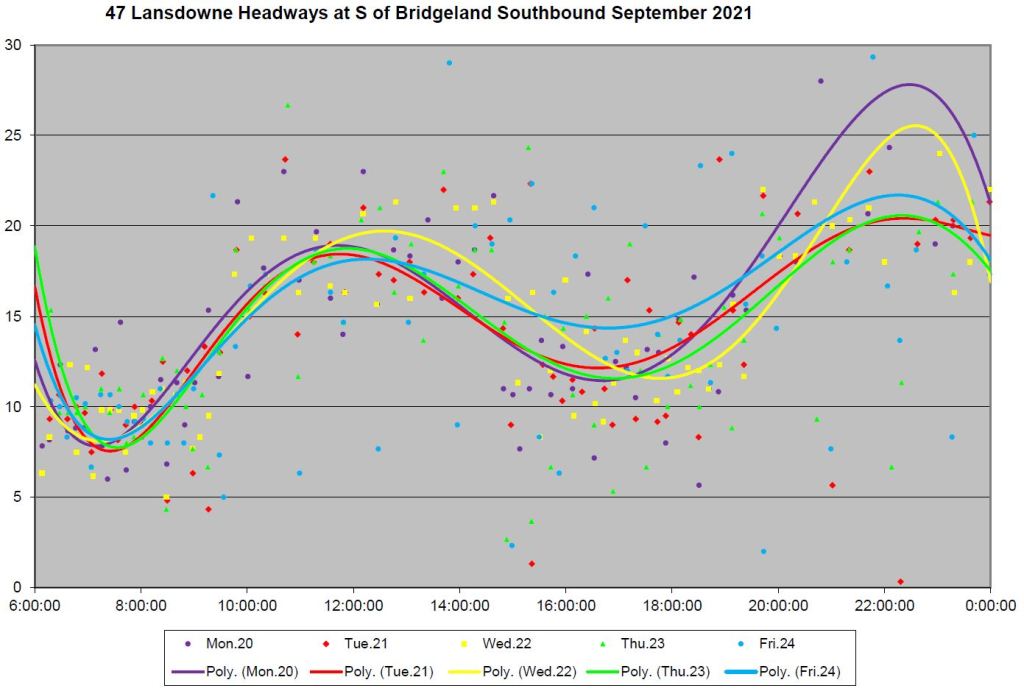
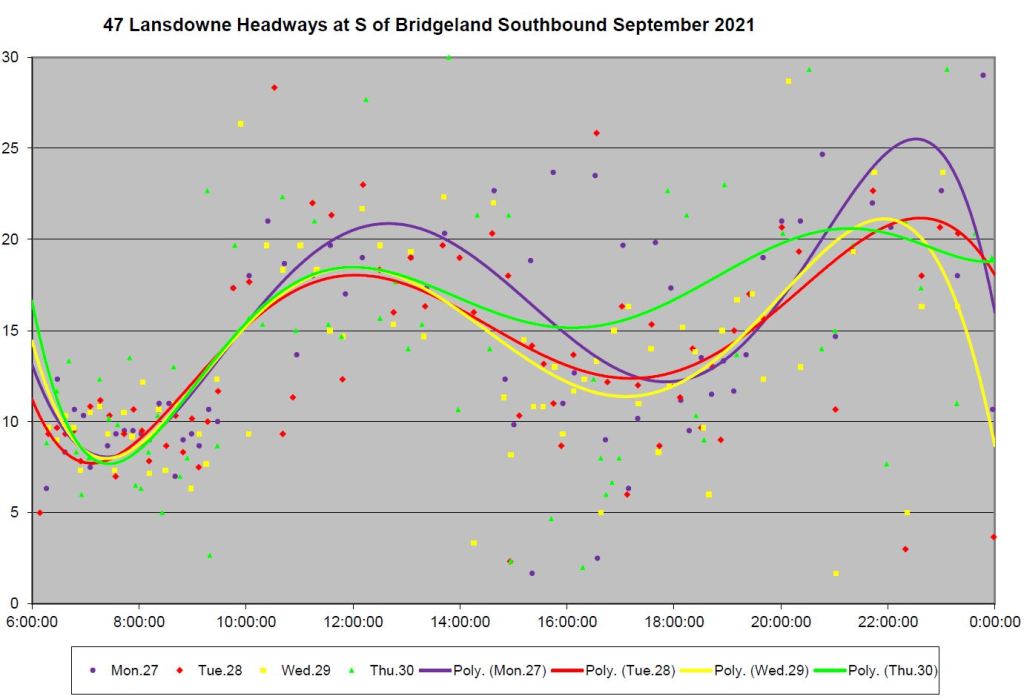
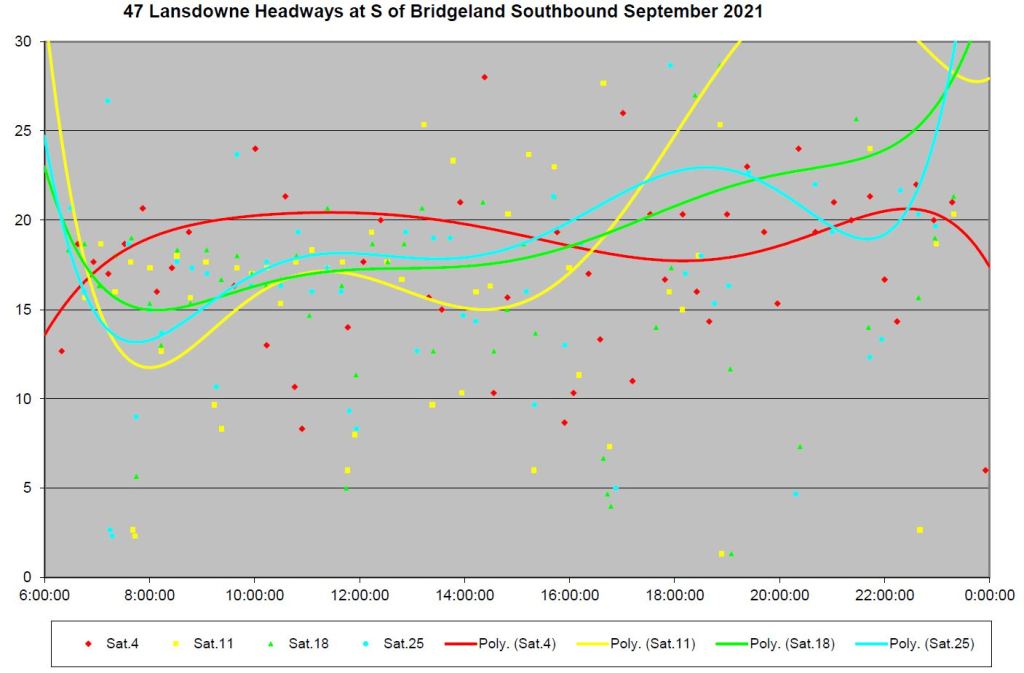
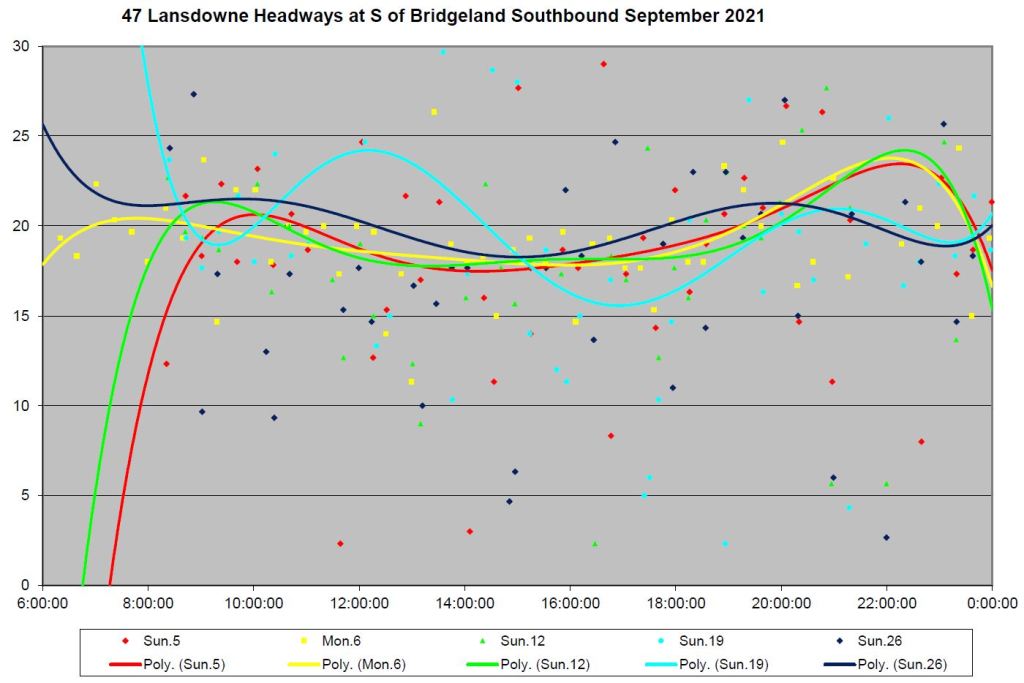
Southbound from Yorkdale Station at Bridgeland
The screenline for these charts is on Caledonia south of Bridgeland where route turns east to serve Yorkdale Station. As above, the shape of the week 1 chart differs from other weeks because of the schedule change.
Only half of the service reaches this point because of the 47A scheduled turnback at St. Clair. As at other locations, the SD values are high, but they are particularly so thanks to the wide scheduled headways and greater dispersion of data values. Weekend service is particularly unreliable with headways ranging over a wide span.
Note that some values go above the Y-axis cutoff, that is to say above half an hour.
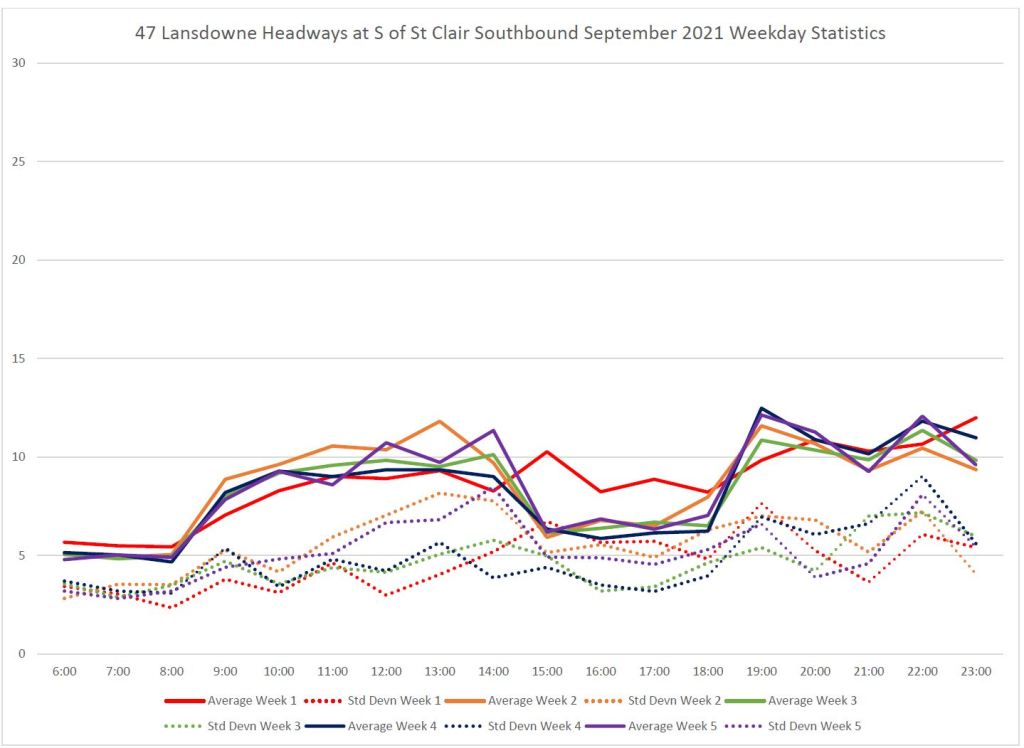
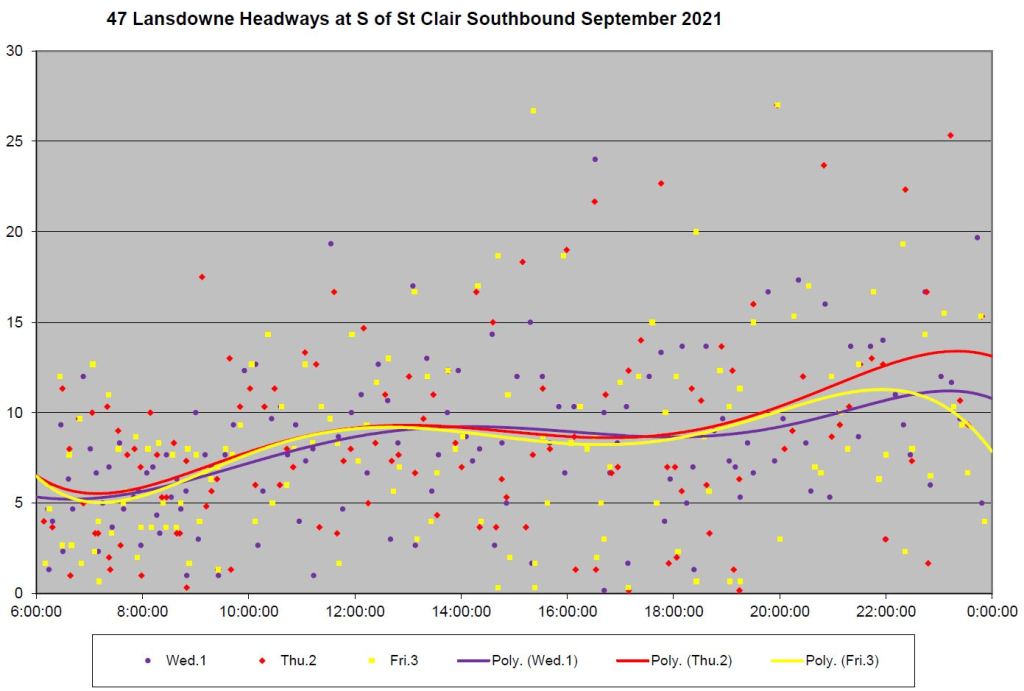
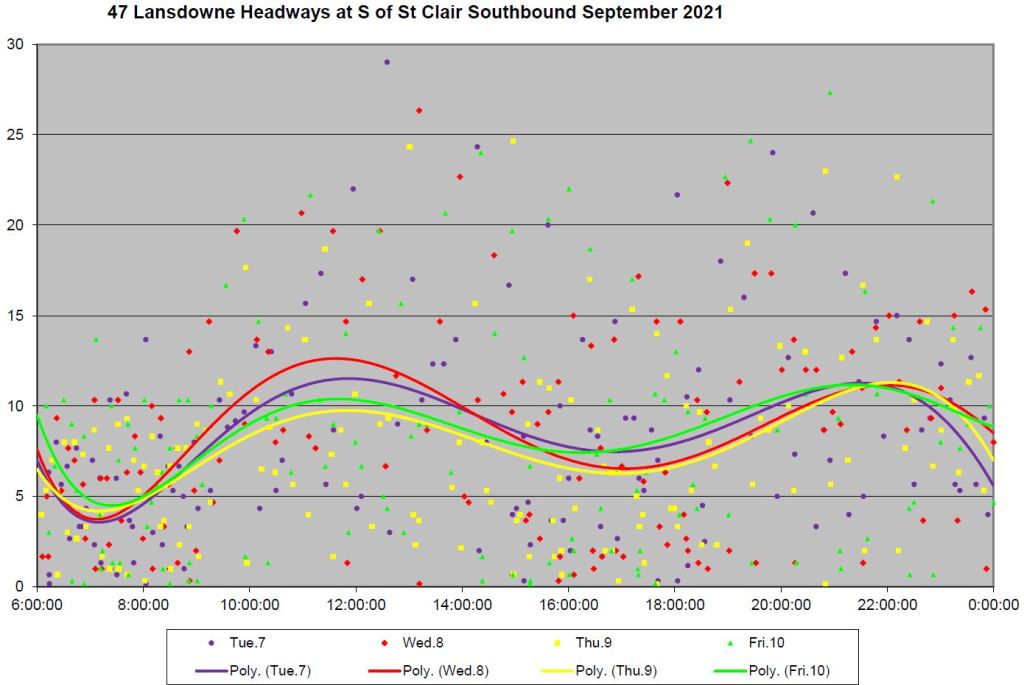
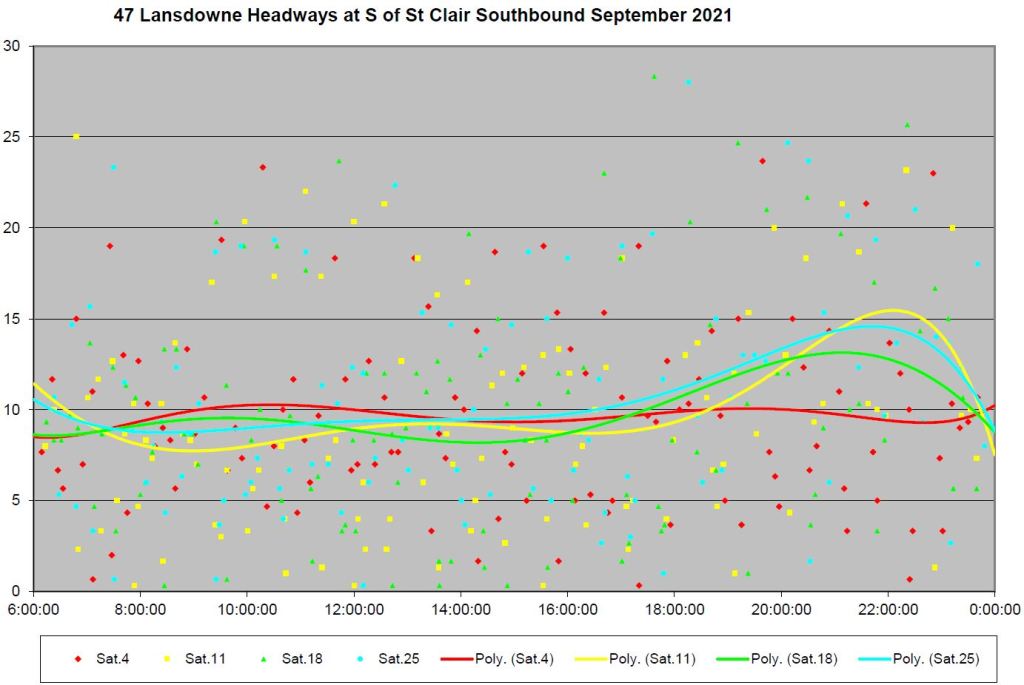
Southbound from St. Clair
Service at St. Clair includes both the 47A buses originating at Earlscourt Loop and the 47B/C service from Yorkdale via Caledonia. The SD values are typical of a midroute location where branching services “merge” with little regard for each other. The clouds of headway values are spread over a wide range with values far from the average/scheduled service.