There will be few service changes in February 2021 in anticipation of the reassignment of bus services with the opening of McNicoll Garage at the end of March.
Weekday service will be trimmed in response to passenger demand on the following routes:
2 Bloor-Danforth
509 Harbourfront
510 Spadina
512 St. Clair
The 9 Bellamy and 913 Progress Express routes will be changed to operate via Progress Avenue. Bellamy buses will no longer serve stops on McCowan Road, Corporate Drive and Consilium Place (these are served by other routes).
The service changes are summarized in the table linked below.
Overhead and station construction work on the east end of 506 Carlton.
Overhead reconstruction on various parts of 501 Queen.
The King-Queen-Queensway-Roncesvalles project.
Reconstruction of Dundas West Station Loop including expansion of streetcar platforms.
Between the construction projects and the reduced streetcar service, the peak scheduled streetcars now number only 126 (AM) and 127 (PM). Out of a fleet of 204 cars, this leaves a lot of room for “maintenance spares”. We must hope that when the TTC puts the entire network back together again late in 2021 that they will have enough working cars to operate it.
In spite of the considerable surplus of streetcars, there are still bus trippers scheduled on 505 Dundas and 506 Carlton.
The bus fleet will operate at less than capacity with a scheduled peak service of 1,520 vehicles compared to the garage capacity of 1,675 and a fleet size of over 2,000. Run-as-directed (RAD) buses are not included in this total, although there are fewer of them now that “regular” service levels have been restored on many routes.
The project list also includes some items for 2022 from the City of Toronto’s map of planned construction work, TOInview. This includes:
Completion of the KQQR project from Queen to Dundas (stop modifications).
Reconstruction of Broadview Station Loop. The status of a proposed expansion of streetcar platforms is not yet known.
Track construction on College from Yonge to Bathurst, and at the intersection of Church & Carlton. Whether the TTC will add curves in the southeast quadrant here to simplify diversions is not yet known. In a previous project at Broadview & Gerrard, the “institutional memory” forgot that there were plans to add a north-to-west curve, and a once in 25 year opportunity was missed.
Replacement of the intersection of King & Shaw.
Reconstruction of Adelaide Street from Charlotte to Yonge. It is not yet clear whether this will only involve the removal of long-inactive track or the restoration of Adelaide as an eastbound bypass for King and Queen service between Spadina and Church.
Here we are at the end of January 2021. The days are getting longer. There is a vague sense of hope in the air for the spring to come not just with flowers and warmer weather, but a more civilized political climate and the beginning of the end of the Covid pandemic. That, at least, is an optimistic view.
January 30th is this blog’s birthday. A year ago none of us had any idea of the year to come and how much the landscape would change.
Each of us has been affected in different ways. The social and economic effects will be with us for many years, not just from the disease, but from the acceleration of changes that were already well underway. The context for many debates has shifted, become more urgent, and the future of our city does not lie in “business as usual” approaches.
In Toronto, transit continues to operate at a reasonable capacity level, although not without problems, because various governments regard this as a critical service. Riders in many cities are not so lucky. Less certain is the future when special subsidies evaporate and Toronto must make hard choices about what transit we need and how much we can afford.
The shift in travel patterns puts this question in a very different context than in years past. The TTC contemplated a multi-year service plan with quite modest demand growth coupled with the opening of a few new rapid transit lines. The plan was not “aspirational”. It did not ask “how much better could transit be and how can we achieve this”.
Such an outlook is rare in Toronto’s transit planning because the starting point is always “we can’t afford it”. This in a city and province happy to commit billions to road and subway construction of dubious merit. Better bus service? Not so much.
“Better” has a new meaning in 2021, and this includes:
The ability to board buses without fear of overcrowding.
Reliability of service to ensure travel is not delayed.
Coverage of service to areas beyond the classic core-area office towers.
Provision of service for work hours beyond the classic 9-to-5 pattern.
These have always been present, but they take on extra meaning for public health. Ridership beyond the core has always existed, but transit’s big job was that peak commuting demand. With that stripped away, the shortcomings in what remains are more evident.
Demand on the TTC’s bus network fell back from about 50 per cent of “normal” to just under 40 in the last quarter of 2020, with comparable drops on other modes. Compared to pre-covid times, streetcars and subways have consistently run below the bus network because work-from-home shifts affect their service areas much more. GO Transit, whose market is almost exclusively the core area commuter, sits at 5 per cent.
In this context, the plans for massive network expansion have a surreal quality, and yet they are still discussed as if the economic crisis we now face does not exist.
From one point of view, forging ahead with plans for growth is essential if only to make up for lost time and to provide badly-needed headroom when riding returns to “normal” levels. Whether it will, and how quickly this will occur in various markets, remains to be seen.
For many years, “normal” on the TTC meant overcrowded service where cost containment took precedence over real provision for growth. That is not a condition to which we should aspire. We should aim higher.
GO Transit’s challenge is more difficult because of its narrower market. The very people that have kept the TTC busy – workers in industry and essential services – are not GO Transit’s base. Even if commuter demand returns, growth on that network is hamstrung by the entrenched park-and-ride model used as the primary “last mile” access for GO customers. Local transit might assist, but this will be compromised by auto dominance and spending priorities in regions outside of Toronto, coupled with a Provincial attitude that local transit service is not their problem.
Last year, I wrote:
There is finally a recognition at Toronto Council that transit simply cannot get by on the crumbs that so-called inflationary spending increases produce. There is a huge backlog of spending required that, for many years, the City and TTC kept hidden from view lest the borrowing it would trigger frightened passing financial analysts.
But that is only half of the problem. Surface routes both inside Toronto itself and in the GTHA beyond have long been neglected as a vital part of the transit network. We cannot move everyone everywhere on a handful of commuter rail and subway lines.
[…]
[A] bigger challenge than getting a new rapid transit line, regardless of the technology, is to get money for better service everywhere, not just on whatever new bauble we manage to open once a decade.
Every government is entering a period where there will be calls to spend for recovery, but there will be limits, some political, some financial, to how much money is really available. Toronto is lucky to have a “City Building Fund” already baked into its taxation plans for the next five years, but that would be a harder sell today now than when Council approved the scheme to fund some of the transit and housing capital shortfalls.
There is no plan for new revenue to support day-to-day operation and service. For now, the City and TTC are propped up by very large provincial and federal subsidies. These will not last forever, and they might not last through 2021. Toronto has a “plan B” to get through the year, if need be, with reserve draws and trimmed capital spending, but that is no permanent solution.
I will not attempt to foresee what awaits us later in 2021 and beyond. However, without a substantial return to transit riding as we once knew it, the momentum for continued improvement will be hard to sustain. This has a compounding effect. If people stop believing in transit as a viable way, indeed the only reasonable way we can handle travel demands on a metropolitan scale, political support for better transit could evaporate.
Changing hats from transit, and looking at my own life, 2020 was a difficult year, but not critical for me as a retiree. Many have lost incomes, or must continue to work in dangerous circumstances, while managing family needs and an uncertain future.
The Internet, for all its wealth of resources, is not the same as being at real events be they a night at the movies, a play in a theatre, or a concert in a large hall surrounded by a living, breathing audience and artists. I long to be there again when it is safe, and fervently hope that as many organizations and venues survive as possible.
The performing arts community is in a deep recession. For all the joy that they bring, they are not “essential” in most political calculus. This is only one example of how the economic landscape had changed, and is unlikely to return to “business as usual” soon. There are many more, and they are all part of the city’s economic activity and drivers of transit demand.
Where do we go from here?
Much depends on the speed with which we collectively wrestle the pandemic to a manageable level if not to extinction. Only with a renewed economy and lifting the burden of extra health and social service costs can a city like Toronto start to think beyond just getting by.
Absent a major shift in government policy, I do not expect to see much change in spending plans. Big construction projects are bound up with a lot of political ego, and are hard to alter in the best of times. Today, they are sold as essential for economic recovery. Whether they build what is the most needed is quite another matter. Digging the hole takes precedence over where and why.
For 2021, I plan to continue my dogged pursuit of service quality. The TTC has a lot to answer for in the mismanagement of service reliability and in the under-utilization of its fleet. The gap between ongoing rider complaints and sunny management tales is too persistent and too wide to be ignored.
I also do not expect much change in support for the boring-but-necessary day-to-day transit service. We will get by somehow, but any capacity increase will be consumed by latent demand.
Few will run on the slogan: “Toronto deserves better bus service”.
Toronto deserves better politicians.
With luck, we will all be back here a year from now still recovering from a wild New Year’s Bacchanal. There will be real optimism, the sense of a better future after a dark past.
We will get there through the efforts of many people in the front lines who keep the wheels turning in so many aspects of our city, people we often take for granted. We will get there thanks to a combination of technological near-miracles, belief in facts and science, and the dedication of thousands whose lives we depend on.
Updated January 29, 2021: The reference to Metrolinx fare integration studies has been updated to include a link to their late 2017 Draft Business Case and to my commentary on it.
The TTC has a study underway to look at future fare options that will lead, in about a year’s time, to a Five Year Fare Policy and Ten Year Outlook.
The study includes a questionnaire seeking feedback about what people would like to see in a new fare system. Curious fellow that I am, I took the study to see what questions might be posed, and whether there was any inherent bias in the options offered.
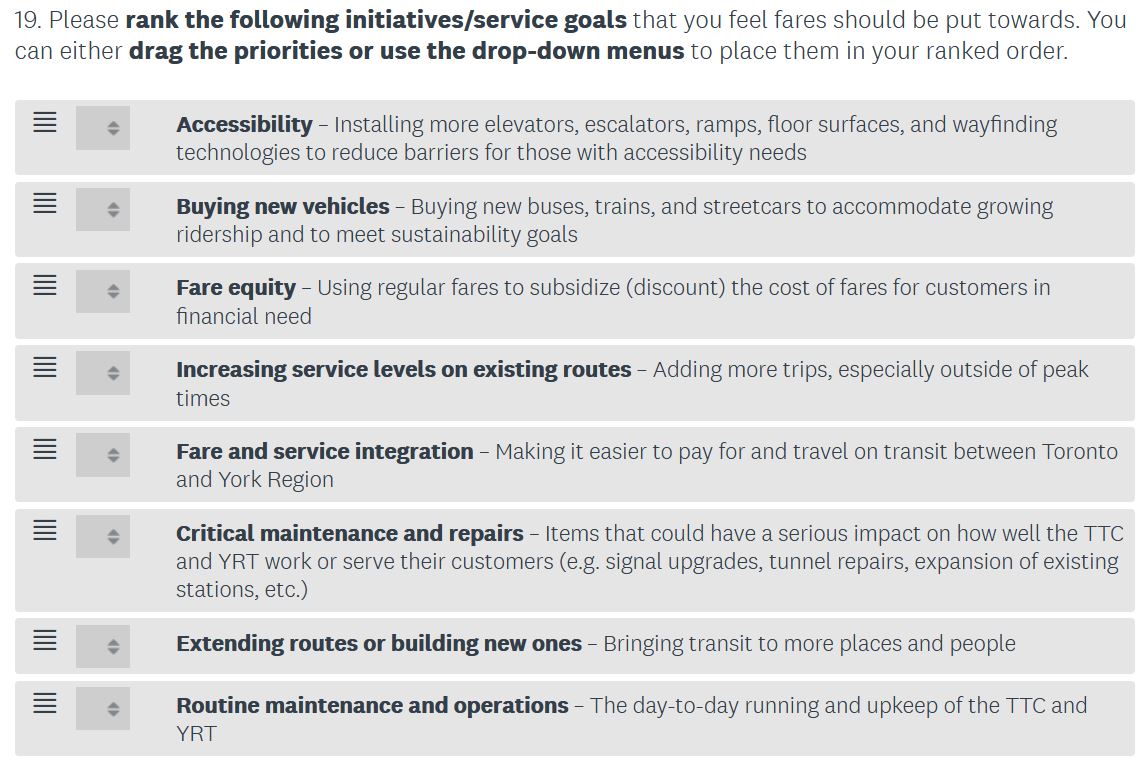
Imagine my surprise when I saw the list of things I might prioritize as a new way to spend fare revenue.
What is mind-boggling is the presence of four topics that are clearly part of the capital, not the operating budget, and which are never funded from the farebox:
Accessibility: New elevators, etc.
New vehicles
Critical repairs: All items shown in the list above are capital repairs.
Extending routes or building new ones: With the exception of bus routes where there is little infrastructure, these are substantial, multi-year commitments of capital often with subsidies from other governments.
Of particular note here is that the dollar value of each type of work is not shown, and so a respondent has no way to know what the effect on fares would be if these items were charged to fare revenue.
For example, in the 2020 Budget year, before the pandemic slashed ridership and revenues, the anticipated farebox take was $1.25 billion. This is less than the total capital spending, some of which is not yet funded, in each year for the coming decade. A big rise in fares would be required to make a substantial contribution to capital.
To put this in context, a five per cent fare increase (taking the adult Presto fare from $3.20 to $3.36 with proportionate increases in other fares) would generate about $62.5 million per year (with no allowance for lost ridership due to the higher cost).
The City’s property tax bill for 2021 includes a 1.5 per cent increase for John Tory’s City Building Fund, and this tax will increase at an additional 1.5 per cent each year to 2025. The new revenue it will generate in 2021 is estimated at about $50 million. This fund is intended to underwrite over $7 billion worth of the City’s share of various transit and housing projects. Most if not all of the projected funding is already allocated.
Is the TTC considering fare increases that would help fund the Capital Budget, and if so, how much do they hope to raise? What type of projects might be funded out of this new revenue stream?
Even more critically, what operational improvements such as better service would not be funded because fare revenue was paying for things like new signal systems and vehicles?
Two other topics also beg the question of just what riders are expected to pay for out of the farebox:
Fare Equity
Fare and Service Integration (Regional)
These are noble goals, but they should be funded from general revenues as City and Provincial priorities, not by taxing riders with a fare increase.
Many riders complain today that service in parts of the network is crowded and unreliable, but the TTC claims to be operating service at close to historic levels. Moreover, the classic TTC claim is that service levels are bounded by the size of the fleet. Both of these are not entirely true.
Because the traditional peak periods have yet to return on most routes, service operates at lower than historic levels.
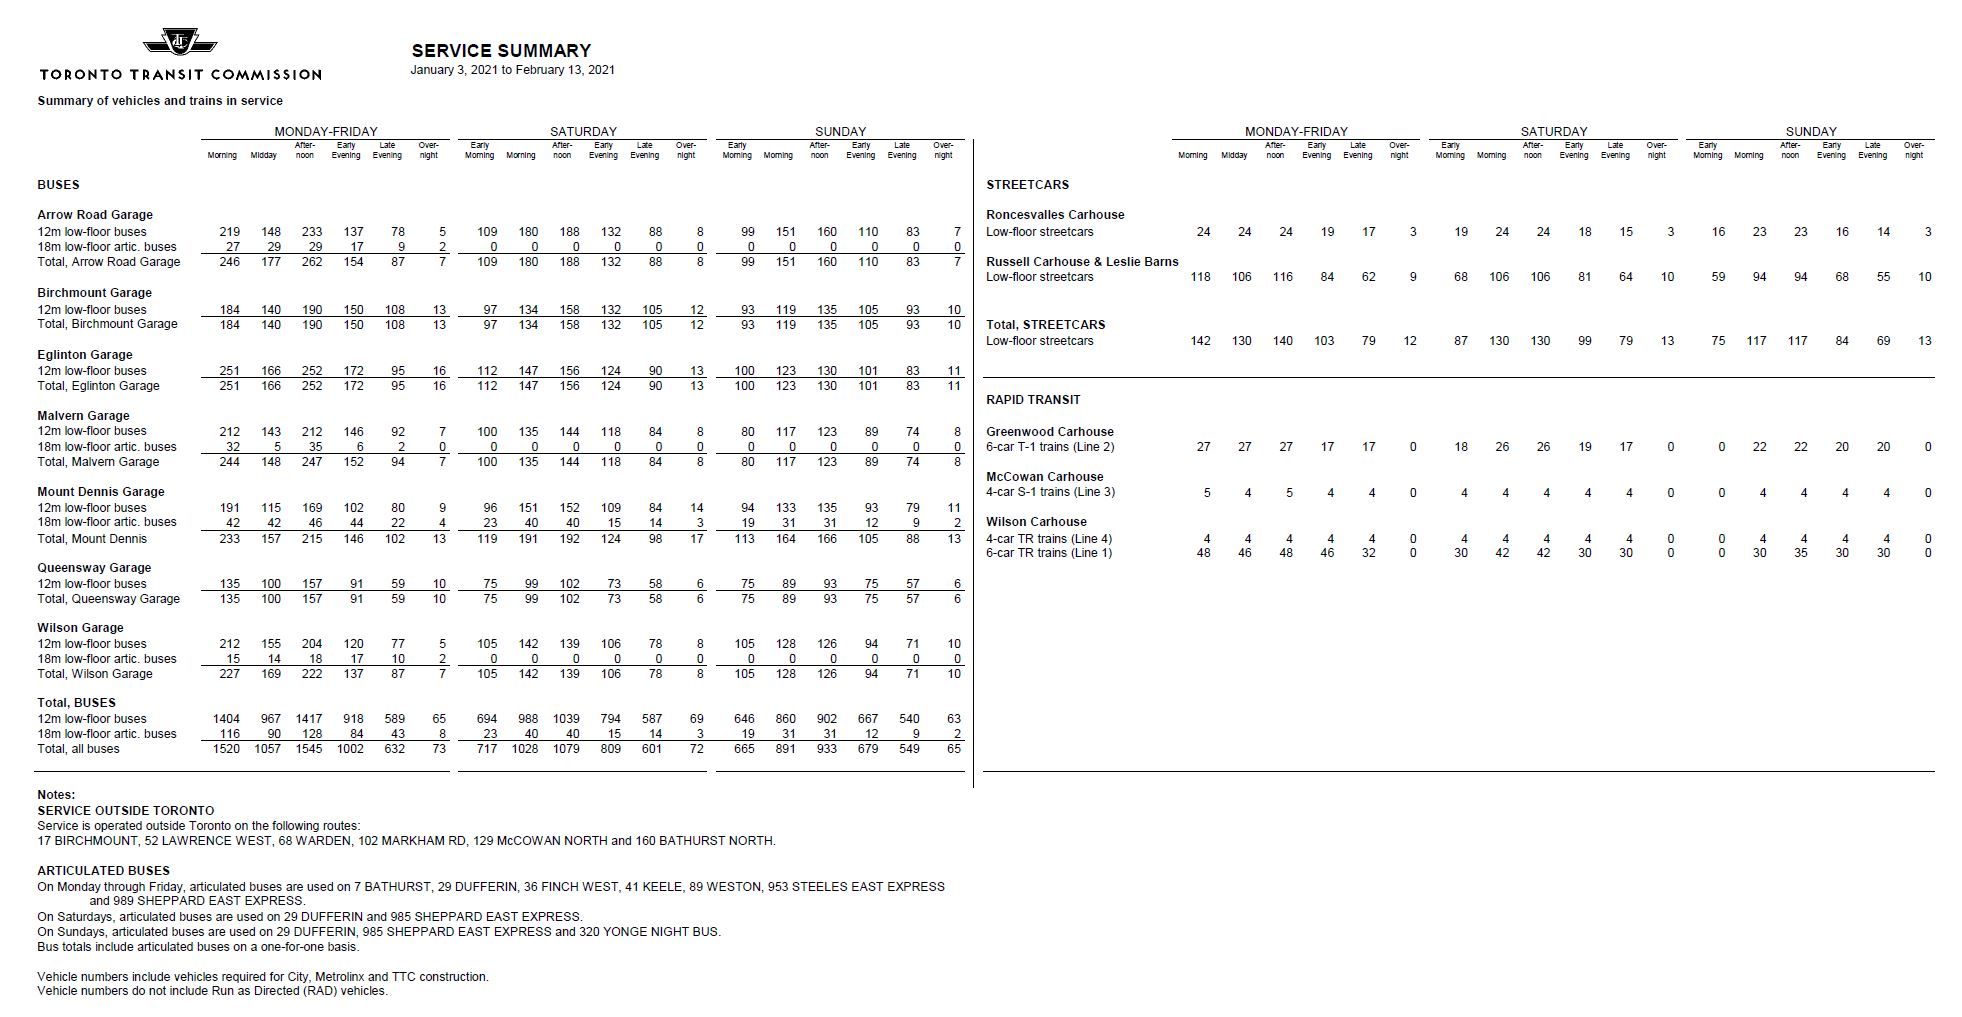
The total scheduled peak vehicles (see table below) is well below the size of the fleet.
In the case of the streetcars, this is partly due to construction projects and to major vehicle overhauls that take advantage of reduced vehicle needs during 2021.
In the case of the buses, the requirements include the replacement of streetcars on some routes, but these vehicles will become available as construction projects wind down later in 2021. Even allowing for this, the fleet is substantially bigger than would be needed for industry-standard maintenance allowances.
Source: TTC Scheduled Service Summary, January 3, 2021
The bus fleet now numbers over 2,000 vehicles, and there are 204 streetcars. Buses required to substitute for streetcars are:
501 Queen: 46
504 King: 19
505 Dundas: 8 (*)
506 Carlton: 22 (*)
Total: 95
(*) Of the 30 buses on Dundas and Carlton, 12 of them also serve as trippers on bus routes.
The primary constraint on running more service is the provision of staff and the associated budget (or subsidy) to run more of the buses more of the time. There is some headroom for more “peak” period service, and outside of those few hours a day, there is much capacity for better service if only Toronto had the will to fund it. If new money is found anywhere for transit, that is where it should go. “Service” is what riders pay for.
Notable by its absence from the survey is any mention of a new fare system based on the distance travelled. Various proposals have floated from quarters such as Metrolinx and the Toronto Region Board of Trade.
Although Metrolinx has not shown its hand publicly, they are still set on imposing a distance-based model on the GTHA to entrench their view of how fares should be calculated. This fits nicely with the prevailing political wisdom of “user pay”, but it utterly ignores other policy goals for transit and the long-standing fare structures in local transit systems.
In the Metrolinx view, rapid transit lines are considered as “premium” services and should attract a higher fare just as GO trains do today. Short trips would pay a flat rate, but at roughly 10km, fares would increase proportionate to distance travelled. The two-hour transfer would almost certainly disappear. Such a scheme would make long trips within Toronto more expensive, and reinstate the penalty on a series of short-hop trips or “trip chaining”. The goal? Subsidize cross-border trips to and from the 905 regions.
Metrolinx presented three schemes back in early 2016, and prepared to launch public consultation, but that was short-lived. I wrote about this situation at the time:
A big problem in Metrolinx fare proposals was their hope for a “zero sum” solution where new revenues (from riders lured to transit by cheaper fares, and higher fares charged to some existing riders) would offset losses (from cheaper rides for some existing riders, and lost ridership from fare increases on some trips).
[Added January 29, 2021] By late 2017, Metrolinx published a Draft Business Case for fare integration exploring various alternative fare structures, and I reviewed this in The Bogus Case for Fare Integration. In this report, Metrolinx at least acknowledges that there are two options: one is the zero sum arrangement of 2016, and the other requires “investment” (read “subsidy”) to offset new, lower fares for those who are penalized by the existing arrangement.
In due course, work on this appeared to stop, but it has not been forgotten.
The Board of Trade’s scheme uses a zonal system that is designed to allow trips inside Toronto, as well as short trips across the 416/905 boundary, to be taken for one fare, while longer trips (e.g. inner 905 to central Toronto) would pay more, although less than today’s completely separate fare on each side of the boundary. In this scheme too the two-hour transfer would probably disappear.
The fundamental problem here is that none of this is discussed in the TTC’s fare study. One of the most important questions riders might be asked is not even in the survey, nor is there any discussion of what various potential new fare schemes would do to riders’ day-to-day costs.
The TTC risks conducting a grand study without discussing a critical effect of “regional integration”. The problem is compounded by muddying the question of fares with potential support for capital projects and policy options that should not be funded from day-to-day operating revenue.
Does the TTC Board, and behind them the City of Toronto, have a hidden agenda to stiff riders for the cost of system and fare policy improvements? Or is this simply a case where nobody is paying attention?
Updated January 22, 2021: Replies from the City of Toronto to several questions seeking details of the proposed service and demand modelling have been added.
The ongoing saga of SmartTrack, once billed by then-candidate John Tory as the saviour of Toronto’s transit, took another hit with the publication of an update on the SmartTrackStations project.
As originally proposed, SmartTrack looked like this. The line ran from Unionville to the Airport Corporate Centre with 22 stations, mostly new.
It was supposed to open this year (2021). That has been pushed back to 2026, and even that could be a soft date if GO’s expansion plans are delayed.
It would have worked hand-in-glove with GO Transit’s Regional Express Rail concept as former Metrolinx Chair Rob Prichard enthused in the project’s promotional literature:
The project contemplates making the GO train corridors virtual “surface subways” with service so frequent and fast that the trains became an irresistible substitute for driving, thus significantly mitigating traffic congestion. Imagine going to the GO station confident that the next train will be along soon, just like when we go to a subway station.
Robert Prichard: Transforming the Way We Move. Address to the Empire Club April 23, 2014. Cited in Surface Subways for Toronto from John Tory’s election website [since removed].
Many parts fell off of this plan including:
The proposed Eglinton West branch to the Airport would have required a mainline rail corridor from Mount Dennis to the Airport. This was not technically practical, and plans for this area reverted to the western extension of the Crosstown LRT.
Instead of being a dedicated service with its own fare structure, SmartTrack stations will now be served as part of the GO network using whatever fare arrangements are in place by the time service begins.
The City’s plan now includes only four stations on the Weston-Scarborough corridor, plus one on the Barrie corridor that had previously been part of GO’s plans.
The most recently deleted stations were at Lawrence East and at Gerrard as these locations will be served by the Scarborough Subway Extension and the Ontario Line respectively. Bloor-Lansdowne has become a “City” station while Spadina-Front remains a “GO” station.
Park Lawn and Woodbine, also shown in the map below, are “GO” stations that are not part of the SmartTrack plan.
Of the stations that remain in the project, their viability deserves reconsideration:
Three of the stations (Finch-Kennedy, St. Clair-Old Weston and Bloor-Lansdowne) are projected to have little walk-in trade.
Transfer traffic at two stations (Finch-Kennedy and Bloor-Lansdowne) may be limited by competing nearby services including the Scarborough Subway terminal at Sheppard-McCowan and the subway-GO connection at Dundas West.
The original SmartTrack plan projected very high all-day demand:
The SmartTrack line will have a conservatively estimated ridership of 200,000 per day. This is the equivalent of about half the daily ridership of the existing Bloor-Danforth line.
Source: The SmartTrack Line from John Tory’s election website [since removed].
To put this in context, this is about two-thirds of the entire GO Transit network, pre-pandemic. That is simply not possible with trains running every 15 minutes that must also carry riders from other GO stops.
The demand projection depended on a level of service and fare structure that will not be part of whatever “SmartTrack” is by the time service finally operates to the new stations. When SmartTrack was “sold” to Council, a different service level, station count and fare structure were cited than now appears to be likely.
Indeed, Metrolinx had already change its future service plans and announced their miraculous discovery (a mix of local and express trains) at a Toronto Region Board of Trade event. Frequent service at SmartTrack stations would not be possible if the express trains did not stop there.
The report makes clear a change in service planned for the SmartTrack stations that Metrolinx watchers had suspected for years, namely that the frequent “subway like” service touted for SmartTrack had been replaced with much less frequent GO service.
From the main report:
2018 Version
2021 Version
Service Concept
Program service levels will be 6-10 minutes during peak periods and 15 minutes during off-peak periods.
Program service levels will be the same as the planned GO Expansion-level service for the corridors in which the Stations reside, with a minimum service level of two-way, 15-minute frequency commencing upon full implementation of GO Expansion service, with more frequent service to be determined on a market-led basis and subject to ridership demand.
Updated January 22, 2021:
I posed questions about service levels to the City of Toronto. Here are the responses from the Transit Expansion Office.
Q: What service frequency was assumed for peak and off peak service?
A: Program service levels will be the same as the planned GO Expansion-level service for the corridors in which the Stations reside, with a minimum service level of two-way, 15-minute frequency commencing upon full implementation of GO Expansion service, with more frequent service to be determined on a market led basis and subject to ridership demand. [This is the same text as in the report Executive Committee.]
Q: What stops (other than the new ST stations) would trains on this route also serve? In other words, do the ST trains make all local stops including the new stations?
A: All GO stations (e.g. Agincourt, Kennedy/Eglinton, Scarborough Jct., Danforth)? Stouffville trains will call at all stations, one note we haven’t made this mandatory at Danforth, which is currently on the LSE service group.
Q: Is it assumed that the “SmartTrack” service will be through-routed at Union Station as in the original proposal so that a rider originating on the western leg can ride through Union to East Harbour without changing trains?
A: We have mandated trains to run through Union station to East Harbour from KL St Clair etc – we have left a degree of flexibility whether the trains terminate on Stouffville or LSE.
Q: Was the model capacity constrained (e.g. by size and number of trains)?
A: The model wasn’t capacity constrained. Below is the forecasted service frequency.
Station
Service Group
Upon
Opening
Future
Minimums
Pk Hr
Contra Pk Hr
Off Pk Hr
Pk Hr
Contra Pk Hr
Off Pk Hr
East Harbour
LSE
4 tph
4 tph
4 tph
4 tph
4 tph
4 tph
STF
2 tph
2 tph
2 tph
4 tph
4 tph
4 tph
Finch East
STF
2 tph
2 tph
2 tph
4 tph
4 tph
4 tph
St. Clair W
KIT
2 tph
2 tph
2 tph
4 tph
4 tph
4 tph
King Liberty
KIT
2 tph
2 tph
2 tph
4 tph
4 tph
4 tph
Bloor-Lansdowne
BRI
1.4 tph (2.5 tph avg)
0
2 tph
4 tph
4 tph
4 tph
In brief, the opening day service at all stations except East Harbour will be half-hourly growing to at least quarter-hourly at an unspecified future date. This is a far cry from “subway like” service claimed in SmartTrack promotional literature. These service levels will deter transfers between frequent TTC service and less-frequent GO/SmartTrack service.
As for fares, the whole idea that somehow riders on trains in GO corridors could pay via two different tariffs with free transfers to/from TTC service was always hard to believe. It is now clear that a “TTC” fare will be achieved by forcing everything, including local TTC service, into a regionally integrated system that, judging by Metrolinx’ long-held preferences, will be based on distance travelled.
Updated January 22, 2021:
I asked the City about fare levels:
Q: What fares were assumed, especially any provisions for transfers to/from connecting TTC routes?
A: Fare setting for the Program will be considered in the broader context of regional fare integration.
Council and Torontonians were misled as they have been on more than one transit project.
A related problem, considering the size of the investment, is that the lion’s share of ST riders will not be net-new to transit, but rather will be diverted onto ST trains by the lure of a faster, and possibly less-crowded journey.
In total, the five stations are projected to attract a combined 24,000 boardings and alightings during the average weekday peak hour. Taken together, the five new stations are projected to attract 3,400 new daily riders to Toronto’s transit system by 2041 every weekday. Ridership would likely be higher with full fare integration between the TTC and GO Transit.
Source: Technical Update, p. 3
Note that by counting both boardings and alightings, these figures double the number of trips because anyone who “boards” must eventually “alight” somewhere. This will count everyone who makes a trip on GO twice for the network as a whole.
Time savings were illustrated by a “SmartTracker” website (still active as of January 20, 2021 at 3:00 pm) to demonstrate how one might make a faster journey with ST in place. The calculated ST travel times did not include any wait time for the train because service was assumed to be very frequent.
Projected values are in the Technical Update for each station, but they do not show the network as a whole. “Person Minutes Saved” are calculated by multiplying the riders for a station by the extra time they would have required to make the same trip if the ST station did not exist. For a station that is off of the beaten path like East Harbour, this translates into a large total saving.
It is not clear which lines were in the “base network” without the ST stations, and in the particular case of East Harbour, whether the Ontario Line was there or not. In other words, what is the extra riding and time saving due to SmartTrack as opposed to the Ontario Line? We don’t know because this information is not in the report. Another key missing piece of information is the service level assumed in the model.
Station
Peak Hour Boardings & Alightings
Person Minutes Saved
Notes
Finch-Kennedy
4,600 (*)
> 250,000
Demand primarily from bus transfers
East Harbour
13,000
> 1 million
Major development node and transfer point with Ontario Line
King-Liberty
3,200
> 175,000
Major residential neighbourhood
St. Clair-Old Weston
300
Limited demand, but some development possible. Project will include road reconfiguration between Keele and Old Weston Road.
Bloor-Lansdowne
2,900
Connection to subway poor
Source: Technical Update / (*) The Finch-Kennedy value is not in the report, but is derived from 24K total cited above less published values for other stations.
How Much Will “SmartTrack” Cost?
The City’s original budget for SmartTrack was $1.463 billion of which $585 million would be from the pool of Federal infrastructure funding. The project is now smaller because there is, net, one fewer station and some elements originally included have been deferred to a “phase 2” (and a separate budget line). However, the total is unchanged probably due to inclusion of other options in the design such as the City-initiated Keele-St. Clair project.
Cost estimates for specific stations have not been released yet, only the totals: $1.195b is for base station infra and $268 is for city initiated station requirements. That’s a cost/station of over $200 million, rather substantial for a line that is not underground.
Metrolinx will carry the operating and maintenance cost of the stations which they will own, and they will get to dictate the service level. Fare revenue will flow to Metrolinx who will set the tariff.
How this would interact with City policies on reduced fares for low-income riders is difficult to say, but the higher GO fares could work against any benefit for low-income areas the new stations might otherwise provide.
The TTC reports on its overall performance through the monthly CEO’s Report. This document is rarely discussed in detail at Board meetings, and often is the underpinning for “good news” about how well the TTC is doing, not about how it could be even better.
Regular readers here know that I often despair over the quality of the metrics used in this report. A few months ago, during a Board meeting, CEO Rick Leary mentioned that the metrics in his report were to be updated. This article is the first in a series discussing of what might be done to improve things. Future articles will review practices in other major North American transit systems, as well as the state of TTC service seen through a more rigourous reporting standard.
The pandemic era fundamentally changed the environment where the TTC operates. Ridership is down, but demand for reliable service is as strong as ever because social distancing is a new requirement. In past years, riders might complain about crowding, but this could be fobbed of with the usual excuses that things were not too bad on average – in any event, we could not improve service because either we had too few vehicles or too little budget room to operate more.
Plans were always tailored to available subsidy funding and the on-and-off-again political desire to “improve” transit by freezing fares. In spite of repeated requests from some TTC Board members, staff would never produce an aspirtional budget showing how much it would cost to plan for overall service improvement beyond a minimal level. That was the approach in the Ridership Growth Strategy, now almost two decades old, and hard fought-for in its time.
Today, a crowded bus represents more than an inconvenience – riders see crowding as a safety issue in this pandemic era.
Looking ahead in 2021 and beyond, there is a potential for resurging transit demand at a time when government support for emergency funding could wane. This could force cutbacks just at a time when transit needs to at least hold its own, if not improve.
The TTC reports superficial measures of its service that do not tell us much about rider experiences even though that is the “shop window” of the transit business. Far too few data are reported at a granular level where the variation in experiences is evident. Little data is available online for review, and much of that is not up to date.
The Tyranny of Averages
Riders do not consume “average” service. Getting to work on time, on average, is not an option. Riders have to assume that the service will be bad and build padding to compensate into their plans.
Riders usually board the first vehicle that shows up after an indeterminate wait compounded by potential crowding. Even if they allow for irregular service, they have no control over whatever shows up day-by-day. Both the physical environment and the need to be somewhere on time can add anxiety to their journey.
Many routes and trips are not crowded, considered on an all route, all day basis, but some are. A major problem here is how we count things.
If we count crowded buses, we might find that, over the day, ten percent of vehicles are crowded. However, there are more passengers on those buses and so the experience of crowding affects proportionately more riders. The same applies to long waits before a trio of buses appears at a stop. The “average” service might match the scheduled buses/hour, but the true experience is of a long wait followed by a crowded journey.
This is the basic reason why management can claim that “on average” service is pretty good, even in these difficult times, while riders complain bitterly that it is not. Service metrics are needed to reveal the variations, how often and how badly the TTC misses its targets, as well as the number of affected riders.
Big Data vs Big Reports
Over the decades, the CEO’s Report (formerly the Chief General Manager’s Report reflecting the position’s earlier title) varied in volume and complexity. This depended on the interests of the then-sitting Board and the style of the then-current management. For a time, it included detailed project status reports on everything from major subway construction all the way down to routine system repairs, but with no interpretive summary to flag problem areas.
Only the most dedicated would read every page, and the report accomplished its objective of appearing to inform while overwhelming with raw detail. Much more information was available about capital project status than day-to-day operations.
At the other extreme, performance data are consolidated to a level where Board members can digest them, but with a loss of detail.
In our time of Big Data, there is a danger of information overload. Readers who follow my route performance analyses know of the volume of charts and data published here, and those are only the tip of a very large iceberg. Nobody would read a monthly description of every route.
The point should not be to read all of the detail, but to have a summary that flags problem areas with the detailed information as a backup. If the same problems show up every day, they are systemic issues, not ones caused by occasional disruptions. The Board should know about them and about what management is doing to correct and improve affected areas. This is Management 101.
From an accountability viewpoint, riders and politicians are interested in their route, in their wards, but those responsibile for the entire system should be able to verify that overall behaviour is not consolidated beyond recognition into a meaningless average. This requires two important changes in how performance data are presented:
The granularity of analyses in time and space (e.g. by route and location) must be sufficient that it can be related to the experience of a rider making a specific trip at a specific time.
Exception reporting of problem areas should flag these for action and be tracked in overviews like the CEO Report, but the detail should be available online on a timely basis.
Those points as written are aimed at service reliability, but can easily apply with modifications to areas such as equipment and infrastructure.
Why Do We Measure?
The reasons for measuring things are summed up in this quotation from an extensve report on the subject that is now close to two decades old:
Agencies collect … measures to help identify how well service is being provided to their customers, the areas where improvement may be needed, and the effects of actions previously taken to improve performance. In these cases, agencies use performance measures to help provide service as efficiently as possible, monitor whether agency and community goals are being met, and—over time—improve service so that it attracts new riders. Changes in policy, procedures, and planning can result from an understanding and appraisal of certain measures.
… [D]ecision-making bodies, such as transit boards and funding bodies, need to have access to accurate information to help them make decisions on where and when service should be provided and to support actions designed to improve performance. The public is also interested in knowing how well service is being provided and may need convincing that transit provides a valuable service, for them, for someone they know, or for the community as a whole.
Performance measurement data provide transit agency management with objective assessments of current circumstances, past trends, existing concerns, and unmet needs.
Eagle-eyed readers will notice that I have not mentioned financial issues like fares, subsidies, cost control and “efficiency”. Too many transit discussions start with the question “how can we reduce costs” before asking “what quality do we want and are we providing it”. However, if the publicly reported data are spotty and do not address specifics rather than general averages, any political discussion of funding will be hobbled.
What might be “efficient” transit service depends on our goals, and use of that term typically implies that there is some way to do more with less, and that we should aim lower. “Good service” may not be viewed as a public good in some political circles except when the time comes to woo voters.
Finally, we must beware of metrics that allow management to “game the system” by hitting easy targets, or by measuring and reporting in a way that puts them in the best possible light.
Objectivity is another aspect of reliability. Those involved in developing measures, obtaining data, and analyzing performance should not permit their self-interests to affect the accuracy of the results. Performance measures should not be selected on the basis of which measures will make the agency look good and avoided where those performance measures make an agency look bad. Rather, selection of performance measures should be based on how accurately and fairly those measures assess agency performance and whether they can be used as a tool to measure goal achievement.
In response to the steep decline in demand on their rail services, Metrolinx announced substantial changes to off-peak services on January 14.
Union-Pearson Express
Service now begins at 4:55 am every day and continues until 1:00 am every half-hour. This will change:
On weekends, the first train will leave Union at 6:00 am.
The last train will leave Union at 10:00 pm every day.
Half-hourly service will be provided only during these periods:
Weekdays 5:30 to 9:00 am, and 3:00 to 8:00 pm
Weekends 9:00 am to 7:00 pm
Hourly service will operate at other times.
GO Transit
All weekend and evening train service on the Kitchener, Barrie and Stouffville corridors will be replaced by buses operating from the new Union Station bus terminal. The changeover will begin on Friday, January 22 for Stouffville trains in the evening due to planned construction on the line that weekend.
The Effect of Covid-19 on GO/UPX Ridership
In recent years, Metrolinx has been proud to show strong growth on its network, and was starting to think in terms beyond peak-period, peak-direction commuting to downtown Toronto. With the work-from-home shift in the business core, this demand has collapsed.
The map below shows the growth in ridership for the period April-December 2019 compared with the 2018 figures. The size of the dot at each station is scaled to the change in demand. (Click on the images below for larger versions.)
Covid-19 changed everything, and ridership in April-September 2020 is only a fraction of former levels.
The decline in demand has been severe, and no corridor is carrying even 10 per cent of its former demand. This is much worse than the situation on the TTC network where demand, although down from 2019, ranges up to 50 per cent of former levels thanks to continued strong ridership by essential workers and by those for whom car travel is not an option.
At a corridor level, the best performance is on Lakeshore East at 9.4 per cent of former demand, while Richmond Hill brings up the rear at 1.5 per cent, or 87 riders per day.
At a station level, the best performance is at Oshawa at 11.6 per cent of former demand, or 418 riders per day. Some stations are below 10 per day.
A tabular version of the station-by-station values is available here:
Weekday train service to Niagara Falls was suspended earlier in GO Transit’s covid-era schedules, and the weekend service was dropped on Saturday, January 9. GO hopes to resume weekend service in spring 2021.
Longer term, the challenge for Metrolinx will be the pace of demand recovery on its network given its strong commuter orientation. The program to expand GO capacity and, eventually, to electrify parts of the network now depends on assumptions about future levels of service and demand including when or if these will be achieved.
As on the TTC, it would be easy for budget hawks to claim that big spending on transit is a waste, but this is entirely the wrong time to make such a call. We do not know what the situation will be even a year from now, let alone further out, and what course the pandemic era will follow. This is not the moment to give up on transit much as road-building advocates might prefer to kick the competition while it is down.
There is a more subtle, but important point about GO Transit’s situation. If their service and policy focus shifted away from downtown commuting to all-day, everywhere service, this could bring a truly “regional” outlook.
Governments of both the Conservative and Liberal stripe at Queen’s Park have no interest in “local” transit service beyond funding provided to municipalities via the gas tax. The tax amounts just announced are for the fiscal year 2020-21 and are already baked into local budgets, and are separate from any covid-specific relief. They are not “new money”.
Ontario suffers from a combination of limited local transit and even less intercity service thanks to the disappearance of private sector carriers. A few new services have appeared, but there is no sense of a network approach let alone provincial funding to build ridership. With the core GO Transit network at historically low ridership, an expanded role for GO buses is the last thing on anyone’s mind. The problem is compounded by a political orthodoxy that somehow the private sector will fill the gap, ideally without any public funding.
Metrolinx and Queen’s Park are happy to focus on transit megaprojects, but the benefits are confined to specific corridors, some at great cost, and are years in the future. Meanwhile, we wait and hope for transit demand to recover and restore GO Transit’s relevance.
A revised version of the service change memo has been issued by the TTC. This article is updated to reflect new information.
Introduction
This article has been delayed from its usual publication a few weeks before changes go into effect. Schedule changes were still in flux, and information on what would actually operate was inconsistent.
There are many sources for service information:
An internal memo from Service Planning detailing the pending changes for a coming “board period” (usually a six-week interval). This exists in draft form a few months ahead of the implmentation date, but a final version is issued two-to-three weeks ahead of time. By this point, everything is more or less frozen in place because operators have picked their crews based on the new schedules. This is the memo on which I base my regular articles detailing pending changes.
At roughly the same time as the final version of the planning memo comes out, the TTC publishes electronic versions of schedules through the City of Toronto’s Open Data Portal. These are in an industry-standard format called GTFS (General Transit Feed Specification) used by agencies to publish their schedules for use by trip planning applications.
A separate version of the schedule data is created for NextBus which has its own format different from GTFS. On occasion the conversion process goes awry and NextBus does not have correct info.
The TTC’s own publicly posted schedules on its website appear to be generated from the GTFS data, although this conversion process can also run into problems.
Finally, there are the Scheduled Service Summaries. These come from Service Planning and they give an overview of service on all routes. Under normal circumstances, a new summary is published on the TTC’s Planning page just after new schedules go into effect. With so much service operating ad hoc through crew cancellations and RADs through 2020, these summaries did not fully reflect what was going on. In practice they could not because their structure is intended for simpler times. Some periods had no published summary.
Throughout the pandemic period, and especially at its outset, the TTC service planners had to make many last-minute changes including the conversion of express operations to “tripper” local runs, selective cancellation of crews, and creation of a pool of “run as directed” [RAD] buses and streetcars. The RADs were used both to fill schedule gaps and to supplement service where needed.
A useful factor in this was the automated passenger counting (APC) data that could be mined to locate routes with capacity issues. Many would argue that the TTC did not do enough to deal with crowding problems on some routes, but a related issue often discussed on this site was service regularity. On paper, a route might have enough service to handle demand at acceptable crowding levels, but in practice if service is badly bunched some vehicles will be badly crowded while others run with light loads.
In 2021, Service Planning hopes to get back to schedules that are properly constructed for reliable service rather than ad hoc responses to the pandemic.
The January 2021 schedule change encountered problems because of last minute-changes that caused the various sources of information to go out-of-sync.
As of January 3, the GTFS schedules reflect plans in mid-December (their posting date is December 21), and plans for some routes have changed.
The information on TTC schedule pages appears to reflect more recent changes to plans implying the existence of a refreshed set of GTFS data. This has not yet been published.
For reasons that are not yet clear, the NextBus versions of the January schedules were both incomplete and included outdated routing information. This caused NextBus to display little or no data for many routes until mid-afternoon on Sunday, January 3. Some late-breaking changes/corrections to TTC plans do not yet appear in the NextBus versions of the schedules [as of January 3].
The generic Service Change page does not list all of the changes because (a) it appears to be based on the original version of the service memo, and (b) because some changes, notably major restructuring of streetcar routes, have been missed. This is complicated by the TTC’s placing notice of one change, the restructuring of Queen services, in the Route Diversions page, not together with the list of service changes. There is no notice of changes on 504 King or 506 Carlton which now operate as split routes.
This situation reflects problems of last-minute decision-making, of multiple sources for data, and of fragmentation of responsibility for managing updates into (at least) three groups: Service Planning, IT and Communications. When a lot is changing on the fly, some things slip through the cracks. This is not to criticize staff, but rather to point out a structure where co-ordination problems can occur.
I will update this article as additional information becomes available.