Correction: The original version of this article stated that the “Income and Transit Use” paper was the work of Steere Davies Gleave (SDG). This was an assumption on my part – that it was a continuation of their previous work. I have been advised by SDG that this paper is not their work, but that of Metrolinx staff. All references to SDG in connection with this paper have been modified appropriately. My apologies to SDG for mis-attributing work to them.
Updated: This article was updated on February 19 at 6:45 pm to include comments on the things Metrolinx should also be studying, but omitted in their review of incomes and transit use. Scroll down to the end to see the update.
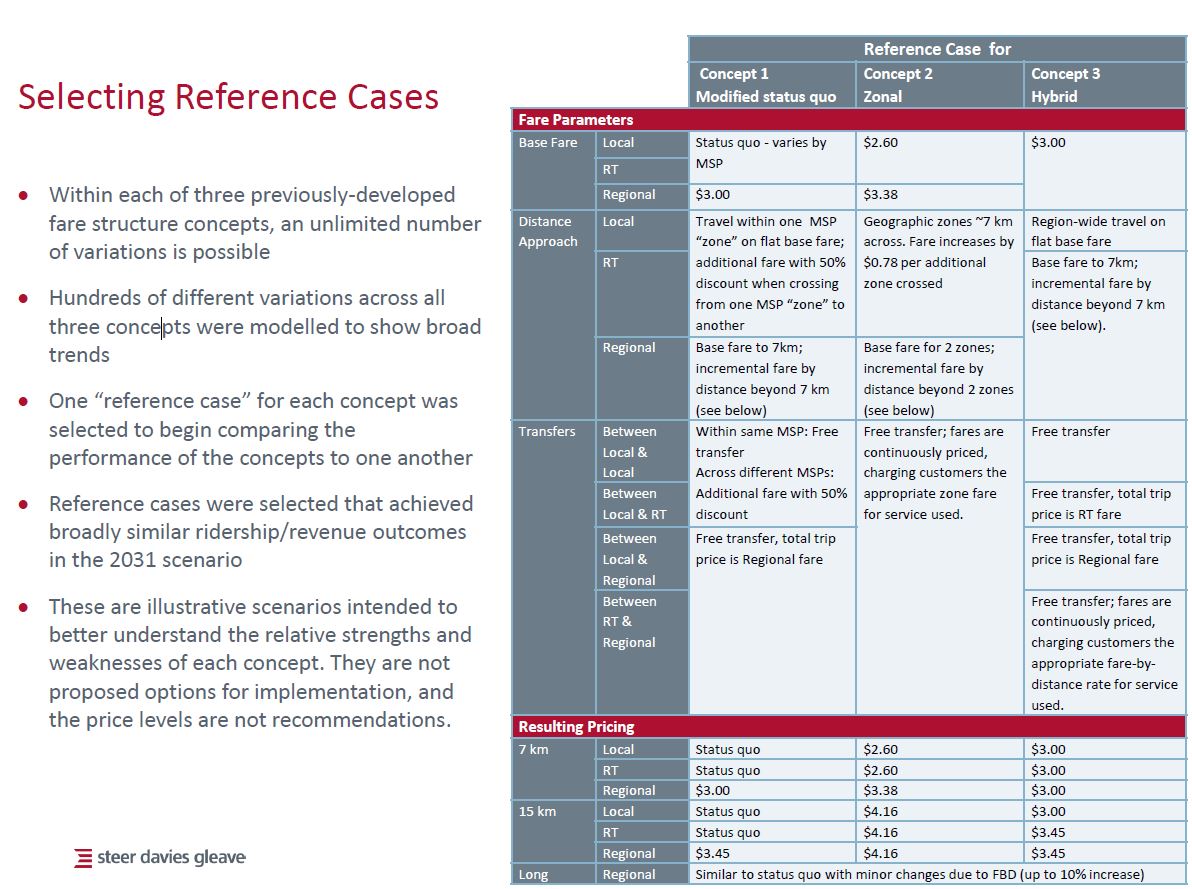
In two previous articles, I have examined the February 2017 update to the Metrolinx Board by staff on Regional Fare Integration, and a June 2016 background study by Steere Davies Gleave [SDG] on fare integration concepts.
This article reviews another June 2016 study by Metrolinx Staff on income equity: GTHA Fare Integration: Income and Transit Use
The context for this study, nominally, is to determine whether a new fare scheme will affect low-income households.
In reviewing potential modifications to the transit fare system across the Greater Toronto and Hamilton Area (GTHA), the social equity implications of transit fare policy must be considered. Lower-income households rely more on transit for their mobility, are more sensitive to the fare they pay for their transit trips than higher-income households, and, as a result, fare policy choices may impact them more. [p. 1]
However, the selective examination of effects by Metrolinx staff focuses on the benefits of a lower fare for “short” trips while playing down the effect on “long” ones.
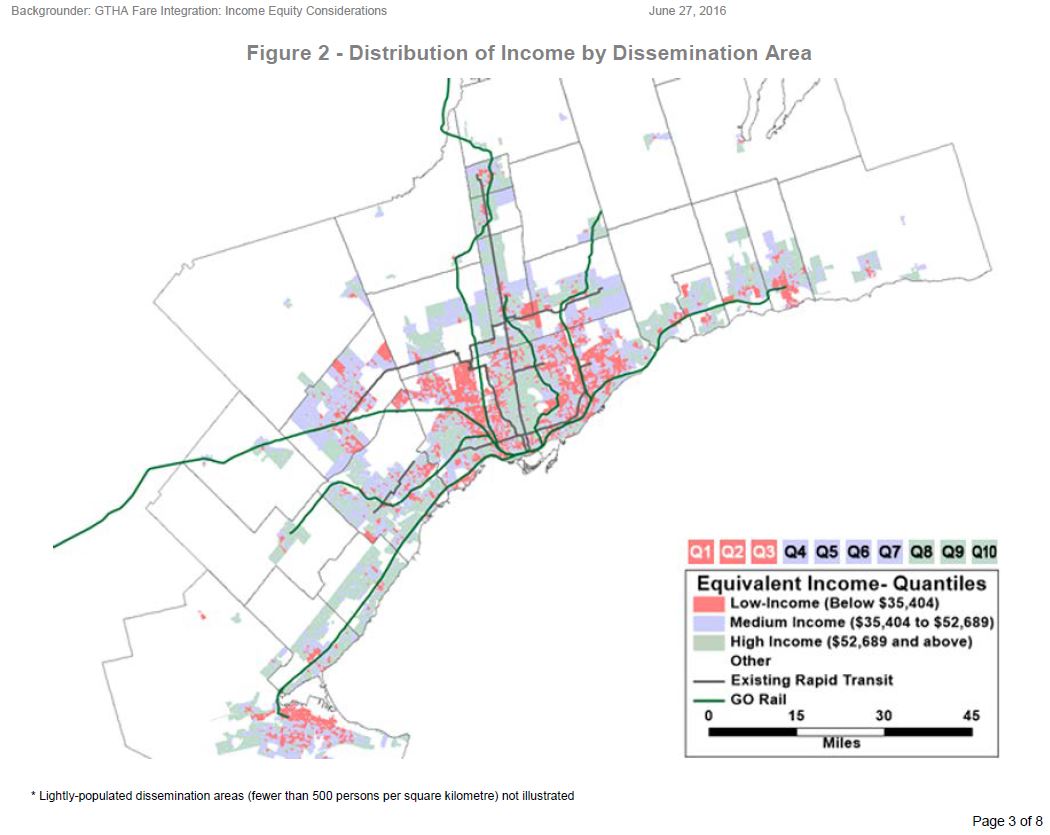
For the purpose of the analysis, Metrolinx looked at a fine-grained version of census data, “dissemination areas”, where each element contains less than 1,000 people.
[these …] typically exhibit greater homogeneity in the household incomes of their residents than larger geographic units. [p. 2]
Each of these areas would lie within one geographic section of travel surveys (the Transportation Tomorrow Survey which, at the time of writing would have been based on 2011 data), and the transit usage for each dissemination area was taken from the corresponding TTS area’s results. Census data on income was used to assign each census area to one of ten income ranges, and through this to map transportation patterns to incomes.
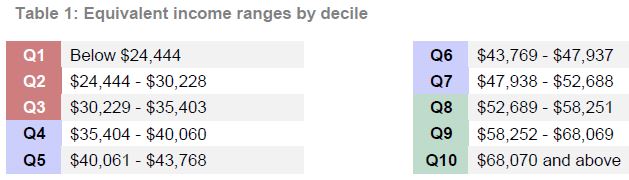
Note that there was no adjustment to reflect the availability of transit in any of the census areas, and the results merge data across the region. The income groupings are based on dividing a population of 6.5 million into roughly equal groups of 650,000. “Equivalent income” is a value derived from a combination of household income and household size.
The actual distribution of income shows a familiar pattern with higher incomes along the Yonge Street corridor and in some parts of the 905, notably those well-served by GO Transit.