
 Recently, there has been a lot of discussion here about the practicality and desirability of adding capacity to the Yonge-University subway. My position is clear: there is more to be gained by adding new capacity in other corridors that can, in addition to relieving pressure on the Yonge line, provide alternatives in the transportation network to what now exists.
For twenty years, the focus has always been on beefing up the Yonge line, and this reflects the TTC’s long-standing tradition of looking only at their network when planning transit capacity. Earlier subway expansion schemes completely omitted the GO Transit network from calculating potential regional demand and modelled all growth in riding on the subway system. The effect of this shows up in the Network 2011 proposal that projected large increases in subway demand. Those increases triggered a study in 1988 of what could be done to add capacity to the Yonge line, and we are still living with some of the fallout from that study today.
When I dug the report out of my archives, I thought that I would only scan, edit and post a few chapters. However, I soon realized that the arguments of 20 years ago are worth reading today because they are instructive both for the basics of transit operations, and because they show the origins of some current thinking.
For convenience, I have chopped up the document into sections. The text, which was originally doublespaced typewriter (Courier) format, has been converted to single spaced Times Roman (yes, I know some of you just hate Times Roman). Some exhibits that didn’t lend themselves to text-based conversion have been scanned separately as jpegs.
The first installment (this post) contains chapter 2 and the first parts of chapter 3 of the Final Report (chapter 1 was the Executive Summary) dealing with the problem of projected congestion and the various ways in which signal changes could be used to reduce headways. In the next installments, we will see:
- detailed descriptions of four schemes for signalling changes to achieve closer headways
- a discussion of vehicle requirements
- conclusions and recommendations for signalling
- four schemes for a reconstructed Bloor-Yonge Station
- evaluation of impacts at other stations and terminals, notably Finch and Wilson
- options for the Yonge-Spadina loop
- final summary and recommendations
Chapter 4 (the Bloor Yonge schemes) contains useful material to those of you who have been, figuratively speaking, drawing lines on maps for the past few weeks with possible alignments for additional tracks. It helps to know the lay of the land both above and below ground.
Because we have already had quite a lot of discussion about routing alternatives, I will exercise my editorial prerogative to delete or severely cut repetitions of past discussions. The main reason I am putting this material up is to show what was actually considered and how the history of past studies like this colours future projects. That’s an important context for the current Regional Transportation Plan discussions — things that seem trivial today will take on the aura of historical received wisdom in less than a decade. Maps drawn on stone tablets are hard to change.
Chapter 2 sets the initial problem — a projected growth in demand on the Yonge line beyond its capacity.
Right from the beginning, there are problems with the premise and the assumptions. The question of a 90-second headway had been on the TTC’s mind for six years already, but the long station dwell times needed to handle passengers posed a challenge. If these went above 30 seconds, the trains could not serve the stations on a close headway. We will learn later that there are huge challenges to remove all barriers to close headway operations, but other than a passing reference to the Downtown Rapid Transit line (aka the Downtown Relief Line or DRL), the assumption that the Yonge line must be modified to handle this demand is never challenged.
This chapter includes two diagrams of interest.
Exhibit 2.1.1 shows the Network 2011 base case flows for the existing subway system. Note that this does not include the contribution of the Sheppard Subway which would add to the demand at Bloor-Yonge. The projected peak demand southbound to Wellesley is 41,600 per hour. Oddly enough, there are demand problems on the Bloor-Danforth and University lines too, but these are not mentioned anywhere in the report.
Note that the stated capacity of the line is 34,000 per hour, not the more commonly cited 40,000. The reason for this is that it is physically impossible to run service frequently enough to handle that demand with the present signal system and track configuration (this is discussed at length in the report).
There is a reference to the Harbourfront-Spadina LRT which, at the time, was still a decade in the future. It does not actually appear on the chart, but is mentioned for some reason in the legend.

Exhibit 2.2.1 is taken from the Downtown Rapid Transit study and shows the preferred alignments for the DRL. The out-of-the-way alignment via Eastern Avenue was needed because this was the era of ICTS (the Scarborough RT), and there was pressure for the TTC to build the DRL with this technology. Such a line could not share the existing subway yard capacity, and it was routed out of its way to Eastern Avenue where a yard might be constructed. Resurrection of the eastern waterfront wasn’t even on the table, and it’s worth noting that there is no station between Queen & Pape and Sherbourne Street. Even that one is shown as “optional” with the first “real” station at Yonge or Union depending on the alignment.
This option was rejected because the prevailing political mood focussed on growth of the suburban transit network. More capacity into downtown was seen as a way to stifle the growth of suburban nodes. That’s a rather quaint idea seen from a few decades’ distance given what passes for “downtown” at those nodes. Development went where people wanted buildings, and that was downtown supported, oddly enough, by the same GO Transit commuter rail system that the TTC ignored in its studies.

Chapter 3.1 sets out the basics of then-existing subway operations. Note that the headway in 1988 was actually more frequent (130 seconds) than it is today (140), and this corresponds to the peak capacity of 34K per hour. In 1988, the line still had a mixture of the old Gloucester (“G”) cars and the newer Montreal Locomotive Works (“M”) and Hawker Siddeley (“H”) equipment. Both the “M” and “H” cars were capable of “high rate” operation, but this was not possible on the Yonge line for two reasons. First, the “G” cars couldn’t keep up, and second, the “H1” cars had severe problems with motor vibrations at high speed.
Over the years, the TTC has rejected high rate operation even on the BD line where it has been technically possible since 1966. In any event, as we will see later, close headways and fast operation don’t mix well, and this is something of a moot point for a line operating with a train every 90 seconds.
Even in 1988, the TTC was unable to get the headway down to the 120 second design limit of the signal system. Bloor-Yonge station, with its long dwell times, was always a problem, but with the addition of Finch Terminal in 1974, the TTC created a track layout whose geometry makes a 120 second headway impossible. It simply takes too long for trains to move in and out of the terminal due to the length of the crossover. (Similar problems exist at the terminals on BD.)
Chapter 3.2 discusses the frequency of subway service. How often can a transit system operate trains on its lines? The material here is standard transit design stuff, although I amazed how often people who should know better don’t appreciate the basics.
One important change since this report was written are hte operating practices for automatic block signals. When the system was installed, a single red aspect meant “stop and proceed with caution”, and the track circuits were arranged so that a train could creep past a single red. Indeed, trains could pull up right behind their leaders provided they did it slowly. Current operating practice, thanks particularly to the Russell Hill crash, is that a single red means “stop and stay”. This has the effect of keeping trains further apart in congested parts of a line and accentuating the effect of long station dwell times.
Where a northbound train could formerly pull right up to Bloor Station and drive into the station as its leader was pulling out, current practice holds the next train just north of Wellesley, and it cannot actually enter Bloor Station until the preceding train clears a track circuit well north of Bloor Station.
One of the advantages of the planned automatic train control system will be the elimination of this restriction.
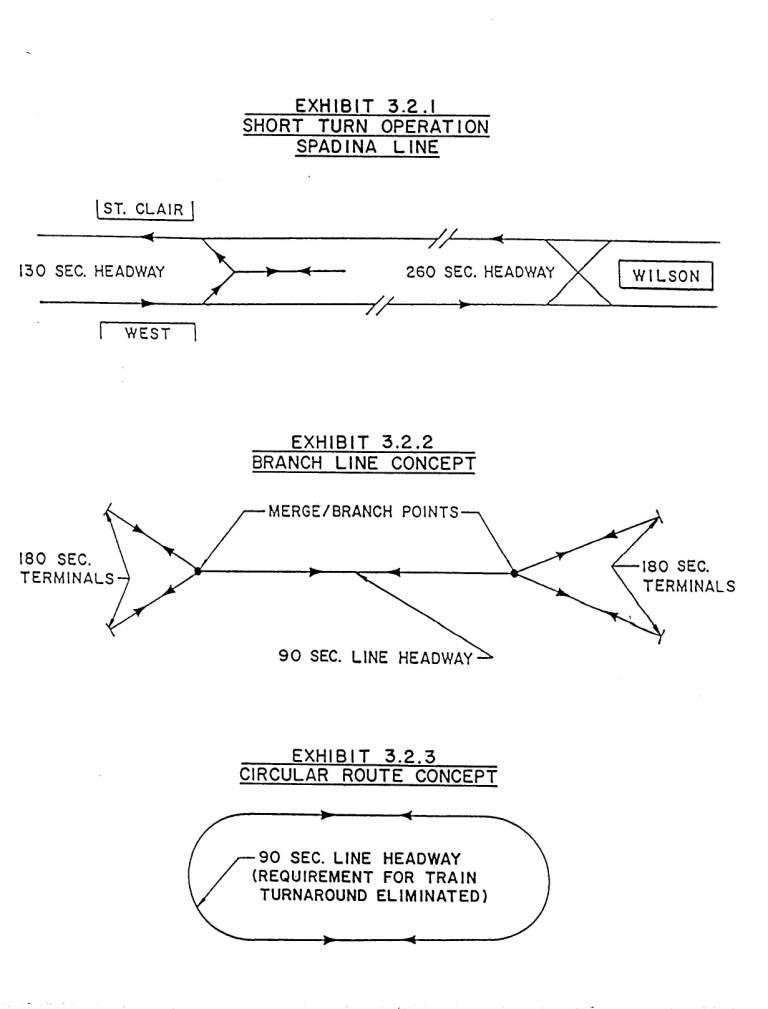
Exhibits 3.2.1 through 3.2.3 show three track configurations that allow restrictive terminal times to co-exist with a 90-second headway. The first diagram shows the existing operation with a 260-second headway beyond St. Clair West. A similar scheme could be used with an extension north of Finch to divide terminal operations. The second shows a schematic layout of a line with two branches at each end, each taking half of the service. That layout is not applicable in Toronto
The third shows a loop line where there is no terminal, and this concept led directly into the proposed Yonge-Spadina Loop which, as we know, was never built. The loop was a dubious proposal when it would have connected from Yonge to Dufferin via Steeles, but as the Spadina line swung further west, it became totally impractical. However, this scheme was responsible for an “Environmental Assessment” that established that only subways were appropriate for expanding the rapid transit system to the north. Self-evidently, only subway technology is workable for a loop configuration, but that “assessment” (a term I use with some contempt) was subsequently used by the TTC to block any study of an LRT network in the northern 416 and southern 905.
In the next segment, I will continue with the detailed evaluations of four proposals for modified signal systems.
