The TTC’s 2017 Operating Budget will be discussed at a special Board meeting on Monday, November 21, 2016. When work began on this round, the TTC stared at a $231 million hole in its potential 2017 funding, and it was apparent that the Mayor’s request for a 2.6% cut in subsidy was small change beside the TTC’s much larger problems.
Updated November 17, 2016 at 6:40 pm: Responses from the TTC clarifying the treatment of externally recovered costs have been added to this article.
The Budget Report is now public, and initial media comment suggested that the TTC had wrestled that huge potential deficit to the ground. However, a lot of that is spin and accounting trickery, not a real reduction in the TTC’s needs.
Still facing a gap of $61 million, TTC management list many unpalatable ways that operating costs could be trimmed. In effect, the message to Council, and especially to Mayor Tory is this: being a “transit mayor” costs money, and it’s time to pay up.
This article looks at the Operating Budget, the one that provides service and handles day-to-day maintenance activities. In a separate article, I will review the Capital Budget.
Understanding The Budget Mechanics
The TTC (and all City agencies and departments) begin work on their next year budget midway through the year. The 2017 budget has been “in the works” for months and in many ways is based on 2015 rather than 2016 results because the year was barely half-over when the 2017 budget cycle started. This can lead to problems when the “current” year does not turn out as expected as happened in 2016.
An important first step in looking at TTC budget numbers is to recognize that any year-to-year comparisons are relative to the 2016 budget, not to the probable actual results for the year. This has some important effects:
- The fare revenue projection for 2017 is based on a lower projected ridership than was used, but not actually achieved, in 2016. Therefore, revenues go “down” in this budget (without allowing for effects of a fare increase) simply to get the estimated ridership back to a reasonable level. 2016 was described as a “stretch target” for ridership, and the budget elastic didn’t stretch as far as hoped.
- Some 2016 costs are coming in under budget, notably for employee benefits but also for diesel fuel. These are savings in actual spending in 2016, but they also show up as “reductions” in 2017 when they are rolled into the budget. It is important to distinguish between reductions in costs that affect actual spending in 2017 as opposed to simply being a lower budget number.
- The 2015 budget included a “capital from current” item for the purchase of new buses. This is not an “operating cost” in the traditional sense, but it avoided putting the item on the City’s Capital Budget. For this reason, 2015 is an odd year in any stats unless the capital portion is factored out (notably from the claimed subsidy per rider). There is no such payment in 2016, and so a direct comparison with 2017 is possible without adjustments, at least until some of the TTC’s new budget tricks are factored in. For 2017, the TTC proposes to shift some operating costs onto the Capital budget and, as a result items that were billed to “operations” and counted as part of the rider subsidy in past years would disappear. The City Manager’s Office does not concur with this tactic. The point here is that year-to-year budget and subsidy comparisons cannot always be made without adjusting the figures to a common basis.
Another important factor is that in the total numbers reported in the media, the “conventional” and Wheel-Trans (WT) budget numbers are often conflated. When demand for WT is growing quickly, as is now the case with improved eligibility criteria from Queen’s Park, costs for this service grow proportionately. This cannot be wished away by budget hawks who care only to limit tax increases, but worse it can create a situation where the conventional system is pillaged for dollars to handle the WT demand. That is not the sort of conflict we should be seeing in budget debates, but it is inevitable when the extra cost of WT for 2017 is almost equal to the revenue from a 1% property tax hike.
Finally, there is a distinction between true savings that represent lasting reductions in expenses, and one-time benefits from procedural changes or special accounting provisions. The impression can be given that a budget is in much better shape than reality by giving the impression that a large initial deficit can be whittled down.
Getting From $231 Million to $61 Million
The budget gap was “closed” by a number of measures, some of which are simply savings against the 2016 budget that are carried forward into 2017. On an “actual spending” basis, the savings have already happened. They are not the result of new, recent actions by TTC management.

As I reported previously when reviewing at the Budget Committee discussions, the reduced healthcare costs were actually achieved as a saving in 2016 against that year’s budget. They are a reduction in 2017 only on a budget-to-budget basis because the $10.3 million was part of the 2016 budget as a starting point.
The recommended savings in the current report are:
- Reduced PRESTO fees due to the delay in rolling out Metropass support. With less of the TTC’s revenue flowing through PRESTO, the cost of serving this does not have to be included in the budget. Note that this treats PRESTO costs as a net addition and does not include an offsetting saving in handling costs for Metropasses likely because the two modes would co-exist during a transition period.
- As in past years, energy costs are expected to be lower than the previous year’s budget level. The saving shown here is $12 million, but $5 million of that is already projected to be saved in 2016 actual results as per the October 2016 CEO’s Report, p. 50.
- Capitalization of City construction impacts. When the city tears up a street (for example the Queen Street watermain project now underway), the TTC incurs extra cost to divert and supplement service. This has been borne out of the operating budget but without an explicit chargeback to the capital project for which this should rightly be a cost. This appears to be a new practice for 2017 and it is unclear whether the City and its agencies have agreed to pay these charges. (See update below)
- Elsewhere in the budget, there is a section on cost recoveries from Metrolinx for its construction project effects on service. This would be done on a cost recovery basis as with City construction, but it is unclear why one of these has been included as a “saving” but not the other. (See update below)
- Delays in Bus Reliability Centred Maintenance. TTC management had proposed a higher fleet spare ratio and maintenance practices to pro-actively get ahead of failures rather than doing predictable repair work after a vehicle had already passed the likely failure time and possibly actually broken down in service. In the Capital Budget, the TTC is proposing a very large order of buses to replace the Hybrid fleet before its due date, and this would reduce maintenance needs by substantially lowering the average age of the fleet. It would also place a large chunk of the fleet under warranty effectively transferring operating maintenance costs to the Capital budget. This tactic has a downside as the TTC has seen in the past when a homogeneous fleet reaches its non-warranty period, and later the higher cost of maintenance (and staffing requirement) of older vehicles. This is a time bomb built into the budget even though it could “solve” a short term problem.
- Reduced contracted services. It is unclear what this refers to, and I have sought details from the TTC. The largest “contract service” the TTC has is the provision of service in York Region, but this is done on a full cost recovery basis. If YRT takes over a service the net change to TTC’s budget should be zero. (See update below)
Update: The TTC has clarified the handling of externally funded costs in an email from Vince Rodo via Brad Ross.
With respect to City construction projects:
It has been a long standing practice for the TTC to charge the incremental cost of service to TTC capital projects. For example, when we tear up streetcar track, we run replacement bus service during the construction period. We charge the difference between the regular streetcar service and the bus service to that project as part of the cost incurred because of the project. In the past, we have not done that for City of Toronto construction projects. The city has agreed that the practice for TTC projects can be used for city projects too. So for example, if the city were closing an intersection for work and we had to re-route service round that, we will now be able to calculate that extra cost and bill it to the city, who will charge it to that project. Since these costs had to be covered by the TTC operating budget in the past, they have been included in the TTC operating budget. From now on, they will not show in our expenditures because there is no net cost to the TTC.
With respect to Metrolinx cost recoveries:
The Crosstown Master Agreement calls for Metrolinx to reimburse the TTC for incremental operating costs associated with the impact of Eglinton Crosstown construction on TTC service. For 2015, we billed them and they reimbursed us for $5.2 million. I don’t have a final figure for 2016, but I suspect it will be in that range. That is not included in our budgets because there is no net cost to the TTC. For 2017, it is similarly not included in our budgets because once again there will be no net cost to the TTC. So the treatment of this and the city construction above will be completely consistent on a go-forward basis: no net cost included in the TTC budget. We flagged this in the 2017 budget report because: (i) the quantum is increasing substantially in concert with the ramping up of Crosstown construction, (ii) it stays high for at least the next 5 years and (iii) because we are hiring 169 TTC employees to provide this augmentation of our service. If it were the same range as 2056 and 2016, we may not have highlighted it.
With respect to York Region cost recoveries:
The service the TTC operates in York Region under contract to YRT is included in the budget as both an expense and a revenue and that has been the case for decades. It is the service they request us to operate on their behalf.
With respect to contracted services:
The “reduced contracted service” has nothing to do with any of the items mentioned above. It has to do with reduced purchases of services such as IT, human resources, IT licenses, cell phones, etc. No impact on service on the street. It all about saving money everywhere we can.
The different treatment appears to arise from whether there is a net delta in the budget (i.e. a new condition, and therefore reported as a budget-to-budget change) or a continuation of an existing practice where costs and expenses always balance out. [End of update]
Four additional sources of revenue or savings are proposed:
- A draw of $14.4 million from the Transit Stabilization Reserve. This money comes from “surpluses” (planned subsidies that were not needed in good years) that have been banked against lean years of which 2017 is most definitely one. This is not a “saving”, but rather one time revenue that can offset the budgetary pressure for 2017 only. The underlying costs will not disappear, and they will show up as part of the 2018 pressure.
- A fare increase of 10 cents on the adult token rate, pro-rated through other types of fare (the details are discussed later in this article). The added revenue is net of the anticipated loss of riders. If pushback from the increase is less than expected, then the TTC could do better with new riders than planned, but many other factors will affect riders’ decisions about staying with transit.
- The TTC proposes that the cost of new batteries for Hybrid buses of $8.5 million be transferred to the Capital budget. This is an interesting accounting debate because parts replaced during a major bus overhaul (typically at mid-life) are paid for from capital, while parts replaced in normal day-t0-day maintenance count against operations. However, the lifespan of these batteries is short enough that capitalization is an odd treatment.
- Some TTC capital assets are not subsidized by the City in part because their lifespan is too short, and in some cases this is likely a holdover from the days of provincial subsidy when certain items were excluded from that funding. As an accounting mechanism, the TTC funds these purchases out of working capital, and recovers the money as a depreciation charge against the operating budget over their lifespan. The TTC proposes that this amount be treated by the City as a capital cost thereby shifting $29 million out of the operating budget.
The City’s response to the final two items is not exactly welcoming:
Both of these items were reviewed with City staff and not supported because they reflect a shift from the operating budget to capital, requiring City capital funding. Staff suggest these items be given further consideration by the City as they might help address the operating pressures while immunizing customers from service adjustments or further fare increases, to the extent possible. [pp. 5-6]
Fare Increase Options
TTC management recommend a ten cent increase in the adult token fare from $2.90 to $3.00 with proportional changes in all other fares except cash which would stay at $3.25. This is expected to bring in $27 million in new revenue, net of the loss of 1.2 million riders and the PRESTO fees that are a percentage of the revenue stream.
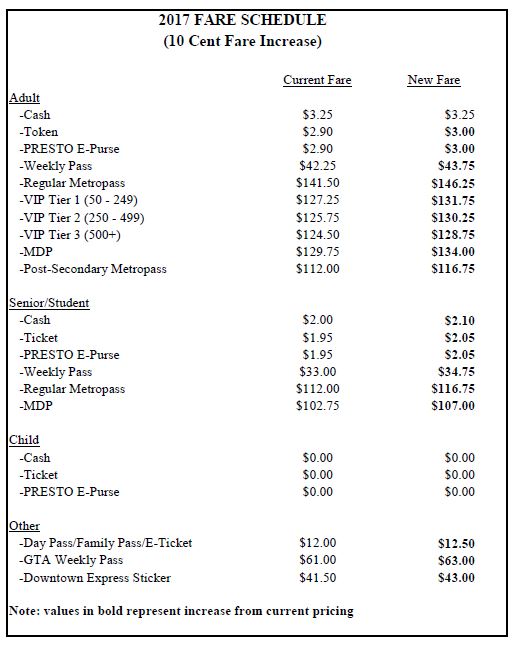
There is no discussion of the issue of special fares as a social benefit, and that issue will get tangled up in proposals to deal with the (at least) $61 million remaining gap between projected revenues and expenditures.
One set of proposals involves larger fare increases. These would inevitably trigger higher ridership losses than the proposed ten cent level, but this is really uncharted territory for the TTC. Moreover, there is the question of perceived value, and whether riders feel they would actually be ripped off by a fare increase if service did not materially, and fairly quickly, change for the better. Paying more for what many perceive to be inferior and declining service is no recipe for retaining customers.

In addition to fare increases, there is the question of the many forms of discount fare. The table below shows the estimated “cost” to the TTC of these fares. This is the sort of issue where fare:ridership elasticity can get very tricky depending on the nature of each market and the extent to which elimination or reduction of a discount is considered to be “unfair”. A related problem is the TTC’s perennial treatment of these concession fares as a cost, as if giving people cheaper rides drives up the cost of service, or represents revenue that might be available if only we could get everyone to pay a higher fare. This is directly contrary to many City objectives to reduce barriers to travel among many groups of citizens, and the recognition that mobility has a value.
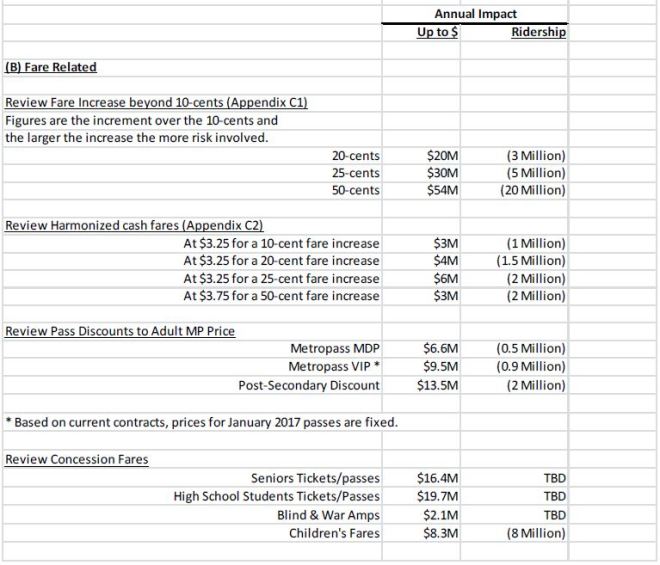
Note: The 8 million lost rides by children does not incur a cost because they are travelling free today. However, it is an indication of how much more riding is done today by children, and the degree to which this unexpected bump in one rider class is masking declines in others, notably adults.
Service Cuts
Another way to trim the TTC’s budget gap is to roll back service improvements, possibly even to levels below those imposed by the Ford/Stintz regime. This would be a bitter pill for the “Transit Mayor” to swallow, and in the midst of such grandiose spending plans as we see on major capital projects, the idea that these services would not be funded should be deeply embarrassing.
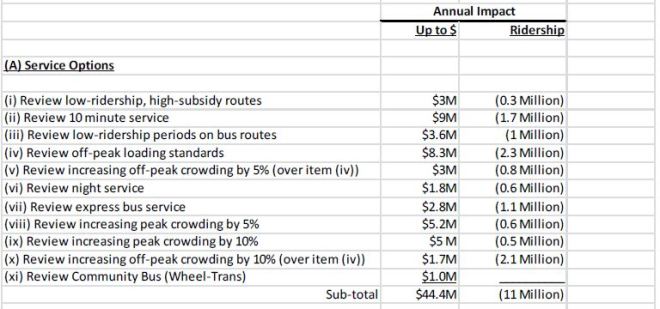
This table shows quite clearly that the usual poster children for “waste” in the transit budget will not yield a great deal of savings, notably the “low ridership, high subsidy routes” and the night services. The big money is to be found is reducing Service Standards, and rolling back both the 10 minute network and the full service 19-hours-a-day policy.
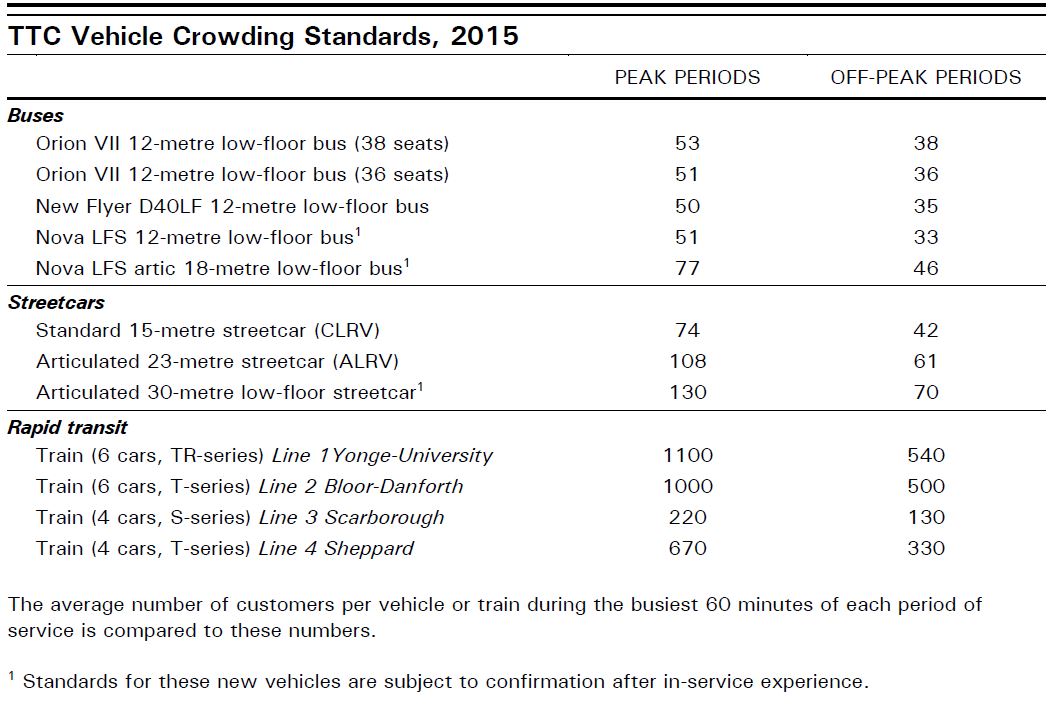
Here are the current loading standards for TTC vehicles. Note that these are based on averages over a peak hour and some vehicles will have more passengers while others are half-empty either due to bunching, or because they are short-turned and are of little use to many riders. The TTC only reports averages, not max-min values nor standard deviations.

As things stand, the service budget for 2017 includes:
- A 0.4% increase over the budget for 2016 for the target ridership level of 545 million, but no provision for ridership growth.
- Annualization of improvements made in 2016 including express buses and earlier Sunday service.
- Restoration of full streetcar operation on all routes including the conversion of 511 Bathurst and 514 Cherry to Flexity operation.
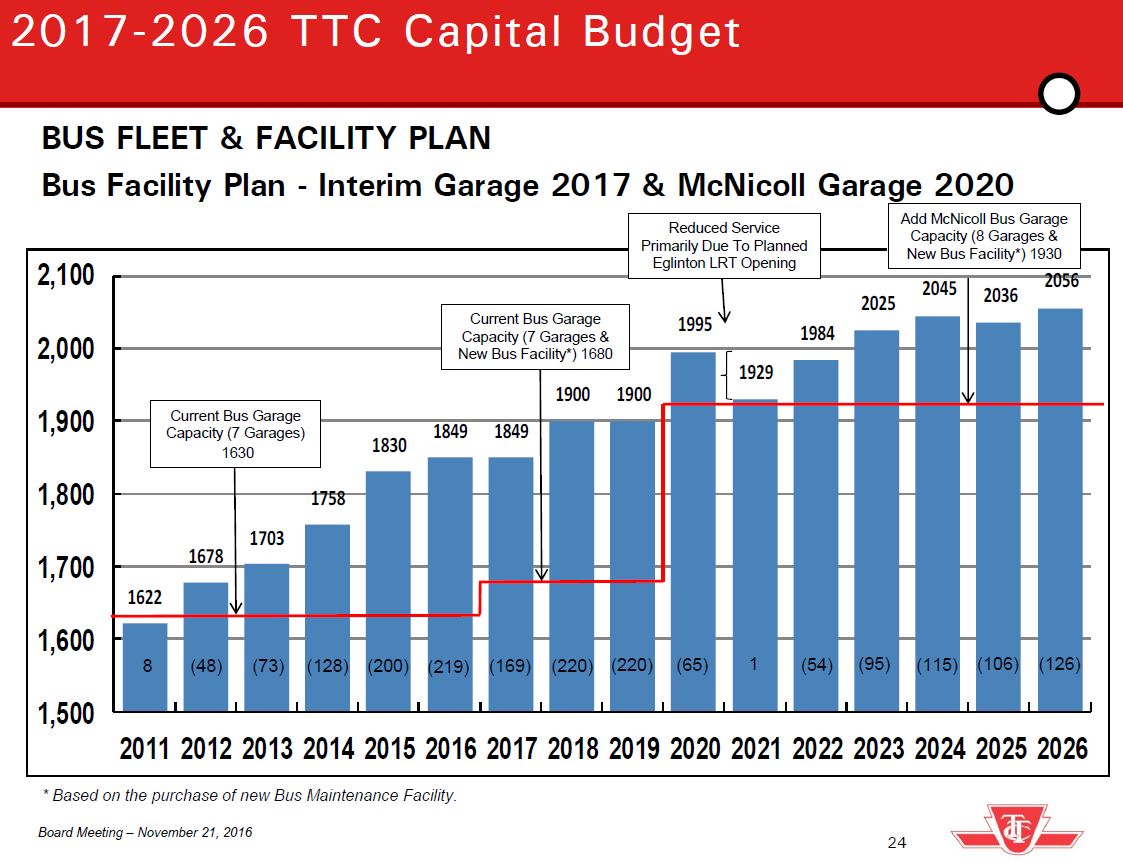
- Opening of the Spadina extension (TYSSE) in December 2017 and concurrent reductions in contracted service for York Region.
- Provision of new bus service to the Renforth Gateway.
Major Changes in Expenses
Several cost areas will contribute to the increase expense budget for 2017:
- Collective bargaining agreement increases: $24.3m
- PRESTO commissions and new faregate maintenance: $14.5m. This cost is almost entirely due to PRESTO fees because maintenance costs on the new faregates are largely offset by savings in maintenance on the old ones. At this point there is no offsetting saving shown for staff reductions due to PRESTO, but a discussion of this comes up later in the report.
- TYSSE opening: $6m for 2017, projected at $30m for years following. Note that the extra cost of operating the extension is equivalent to revenue from a 1% property tax increase.
- Cap & Trade: A $5.2m additional cost in fuel. According to the report “This is expected to increase the TTC’s diesel costs by 4.7 cents per litre and its natural gas costs by 3.3 cents per cubic meter.” The TTC has not produced consolidated figures showing the combined effect of price changes in fuel, the benefits of hedging, changes in consumption, and the new tax.
- Hybrid bus battery modules: $8.5m. This is an operating cost that the TTC seeks to transfer to the Capital Budget as described earlier.
- Accident claims: $6.2m. Actuarial evaluation of existing claims indicates a need to increase the provision for settlement. TTC self-insures except for disaster coverage.
- Traction power and utilities: $5.5m. Again, it is clear that “lower energy costs” of $12m cited as savings earlier in the report have offsets elsewhere in the budget.
A full list with explanations is in Appendix D of the report.
Workforce Effects
A perennial issue at City budget time is the matter of “headcount”, to the point that some Councillors fetishize this to the exclusion of any other measure of a budget. Transit service, of course, requires people to operate and maintain it. If you buy a bus or a subway train, someone has to drive it, someone has to maintain it, and in the case of a subway, someone has to maintain the infrastructure the train runs on. The TTC projects changes in their workforce for 2017, but the big increases come in two areas: operators needed to provide service that will be paid for by others (Metrolinx) resulting from their construction projects, and additional staff needed to operate and maintain the subway extension net of savings on the surface network.
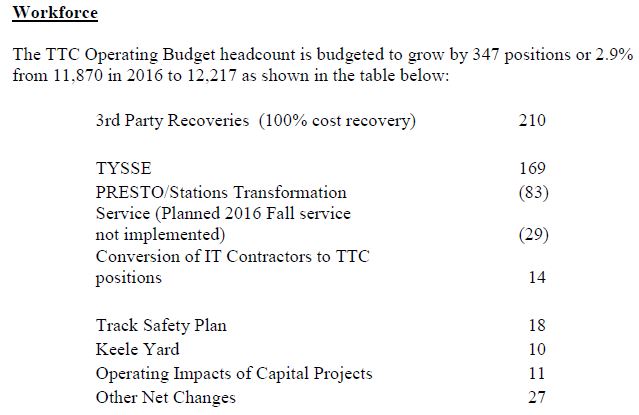
Of the 210 staff covered by 3rd party payments, 169 are for service operation in the Eglinton corridor where the TTC expects to receive $72.5 million from Metrolinx from 2017 to 2021. 36 are to provide frontline PRESTO support for which Metrolinx is responsible, but the TTC is acting as their agent. The remaining 5 are for vehicle repairs that are charged to others.
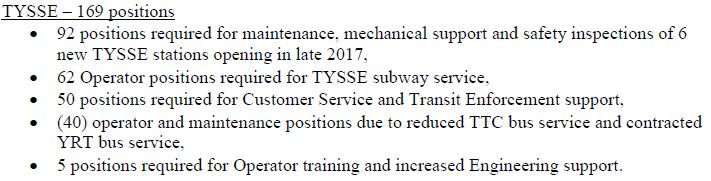
The staffing required to open a subway extension is considerable as shown in this breakdown for the TYSSE. Note that the saving in bus operators is considerably lower than the extra staff needed to operate and maintain the subway.

As for the PRESTO rollout, the lion’s share of savings from elimination of Station Collectors will be offset by the new staffing model for subway stations. Something that the TTC has never made clear is the degree to which the value of the Collectors was included in the fare collection costs that PRESTO is supposed to offset. Whether the “evolution” of stations will “meet and exceed customer expectations” is difficult to say considering that we still do not know the actual function and service quality the new Customer Service Reps are expected to provide.

A complete description of the purpose of all workforce changes is in Appendix G of the report.
Wheel-Trans
The Wheel-Trans budget is a major source of cost pressure for the City of Toronto. Demand is rising quickly due both to demographic changes and increased eligibility mandated by Queen’s Park. It should be noted that the TTC (and other municipalities) receive no provincial subsidy for their accessible services. Indeed, the cost of running WT in 2017 will be about 90% of the value of the operating and capital gas tax contribution Ontario makes to Toronto. This is not to suggest that increased WT service is bad, indeed it is long overdue, but to show the relative level of provincial support for transit generally against the cost of providing just this component.
Wheel-Trans expects to carry 28% more trips in 2017 than in 2016 which itself is expected to be 14% over 2015. WT has almost no revenues (fares cover a trivial amount of the total cost), and this rate of increase means a big jump in subsidy requirements from the City. The extra demand is projected to add $24m to the WT budget offset by only $1.5m in fares.
There is a very small increase in WT workforce because the additional trips will substantially be handled through contract services, not the TTC’s own fleet. Indeed, the TTC projects a reduction of trips carried on WT vehicles as trips shift to other modes and as the new “Family of Services” program diverts more trips to being partially served by the conventional system (i.e. WT handles the “last mile” portion of a trip between a subway station and the rider’s origin and/or destination).
How successful the TTC will be in shifting its WT demand between various types of service remains to be seen. This will involve not just a more complex booking system, but also the ability to ensure that connections between legs of mixed-mode trips actually work as planned.
Accessible transit is a fast-growing part of Toronto’s network, and City Council should ensure that it can be properly funded without endangering the base system used by all riders, including ambulatory WT passengers who can, in part, ride conventional transit if it is “there” and not crowded or erratic beyond their endurance.
Ridership Growth Strategy
At Budget Committee meetings, there has been talk of a new “Ridership Growth Strategy” to improve the TTC’s attractiveness and to return to an era of steady growth on the system. A report on this is supposed to be coming before the TTC Board early in 2017, although the rather grim situation painted by the budget report suggests this will be a wish list for the future. One might joke that it’s just the sort of thing someone might run on for re-election in 2018, if only there were a sense that there would be political support to pay for it.
Just keeping the TTC at the level it is now at in service and fares will be a huge political struggle with a Mayor and his supporters on Council who cannot get past their promise to limit tax increases and fund any growth or improvement from those mythical “efficiencies” we have heard about for years.
Anyone who looks through the list of “savings” in the TTC budget will realize that little of the reduction from that original $231 million gap for 2017 and the now-proposed $61m number is due to management actually squeezing blood (or possibly gravy) out of a stone. Some is the luck of changing costs, some is a matter of accounting, and some is wishful thinking that the City will take on more costs without actually treating them as part of the “operating subsidy”.
The shell game continues.