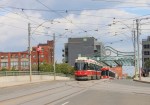
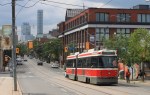
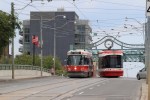
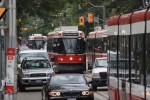
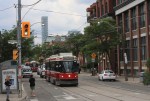
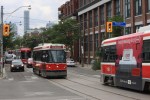
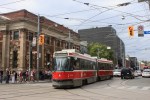
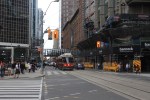
A Potpourri of TTC Items

Several items have languished unreported here for a while, and it’s time to push them all out of the door in preparation for the deluge of budget information and the new Service Plan that will come in December. My apologies for not keeping you as up to date as I might have.

The items covered here are:

  • Ridership and revenue
  • Vehicle reliability
  • Service quality (briefly)
  • Automatic train control
  • eBuses (electric buses)
  • Fare evasion

Continue reading

Flexity Reliability Update: October 2019

At the TTC Board meeting of October 24, 2019, there was a staff presentation on the question of streetcar reliability and statistics, as well as a statement by Bombardier about their improvements in quality control. [Links go to the YouTube video recording of the meeting.]

In a previous article I wrote about claims that the TTC was keeping “two sets of books” on vehicle reliability, and that the numbers cited for the Flexity fleet omitted failures that were counted against the “legacy” CLRV and ALRV fleets. The TTC has now produced statistics for the Flexitys distinguishing between failures chargeable against Bombardier’s contract performance, and a broader class of delays including those caused by other factors.

The charts shown in this article were clipped as screen grabs from the meeting video. When I get better resolution versions from the TTC, I will update the illustrations here.

There are several “Key Performance Indicators” (KPIs) tracked by the TTC and Bombardier, and some of these appear in the monthly CEO’s Report. Responsibility for these varies between the supplier, Bombardier Transportation, and the buyer, TTC, as shown in the chart below. Of particular concern was the Operational Reliability Mean Distance Between Failures which is calculated based on all in-service failures and provides a measure much closer to rider experience than Contractual Reliability that tracks supplier-specific faults.

Production of the new cars suffered for roughly the first third of the order because of manufacturing and engineering problems at Bombardier. This was acknowledged in Bombardier’s presentation about which more later in the article. The chart below does not fully show the severity of the problem because a “defect” could range all the way from something cosmetic to a fault in the physical structure. The chart does acknowledge “Major Quality Defects” and this corresponds to the portion of the order with unacceptable welding from Bombardier’s plant in Mexico.

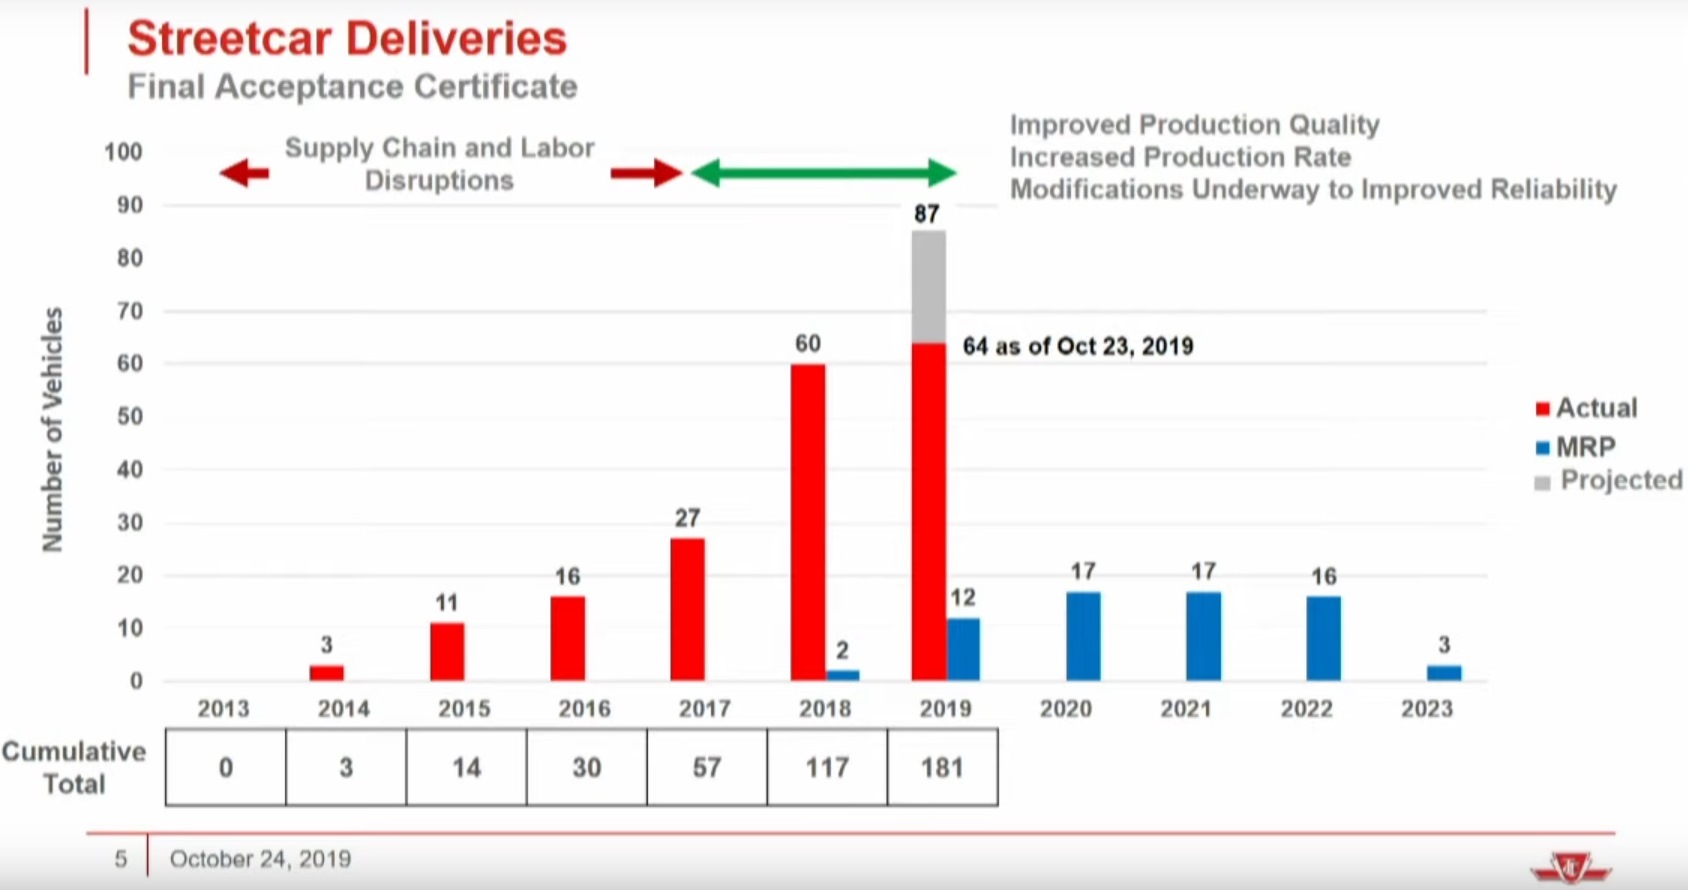
The delivery pattern is shown below with the anticipated completion of the order by December 31, 2019. This could be missed due to subcontractor supply issues at Bombardier.

The blue bars in the chart show the planned repair program to re-weld the frames of the early cars. This project will occur on a rotating basis so that the number of cars removed from the fleet at any one time is small and does not have the same effect it would were all 67 cars deemed unfit for service.

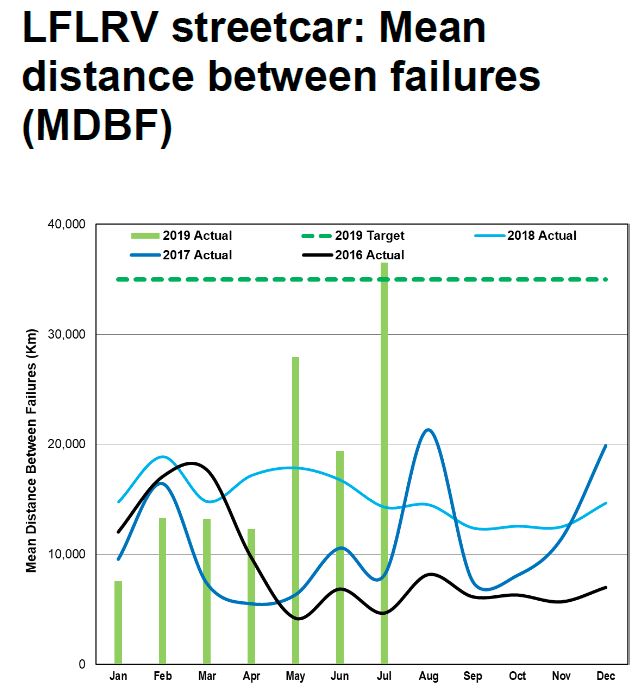
The reliability statistics have been recalculated back to January 2016 to distinguish between vendor-related issues and all others. On the latter basis (the “Operational Reliability”), the MDBF numbers are lower for the new cars. While still better than the legacy fleet, they are not as dramatic an improvement as cited routinely by the CEO as justification for retirement of the old cars.

(Item 2.iii below contains a typo: it should read “worn”, not “warn” with respect to the pantograph carbons. Quality control is not just an issue for manufacturing.)

The chart below shows the contractual method of calculating reliability including month-by-month figures (amber) and a twelve-month average value. The dotted line is a projection showing what must be achieved to meet the contract requirement of one year’s average at 35,000 km MDBF. Although this chart ends at August 2019, Bombardier reported in their presentation that the figure remains well over the target into October 2019.

When the calculation includes failures that are not chargeable to Bombardier, the monthly averages fall considerably with the low points for the new cars not far off the high points for the old ones. To be fair, one factor in the ability to keep the legacy cars’ MDBF as high as it is recently has been the retirement of the least reliable cars in the fleet.

The real challenge will be to see how the Flexitys make out through the winter of 2020, and the degree to which vendor-related problems affect the contractual as opposed to operational reliability statistics.

The table below expresses the data on the basis of failures per vehicle showing that on both bases of measurement, this number is falling as the fleet grows showing that newly delivered cars are not contributing to high failure rates as they were earlier in the contract. This could be due to better reliability of the newest cars, or to the accumulation of a larger number of reliable cars in the fleet overall, or some combination of the two.

Reliability In More Detail

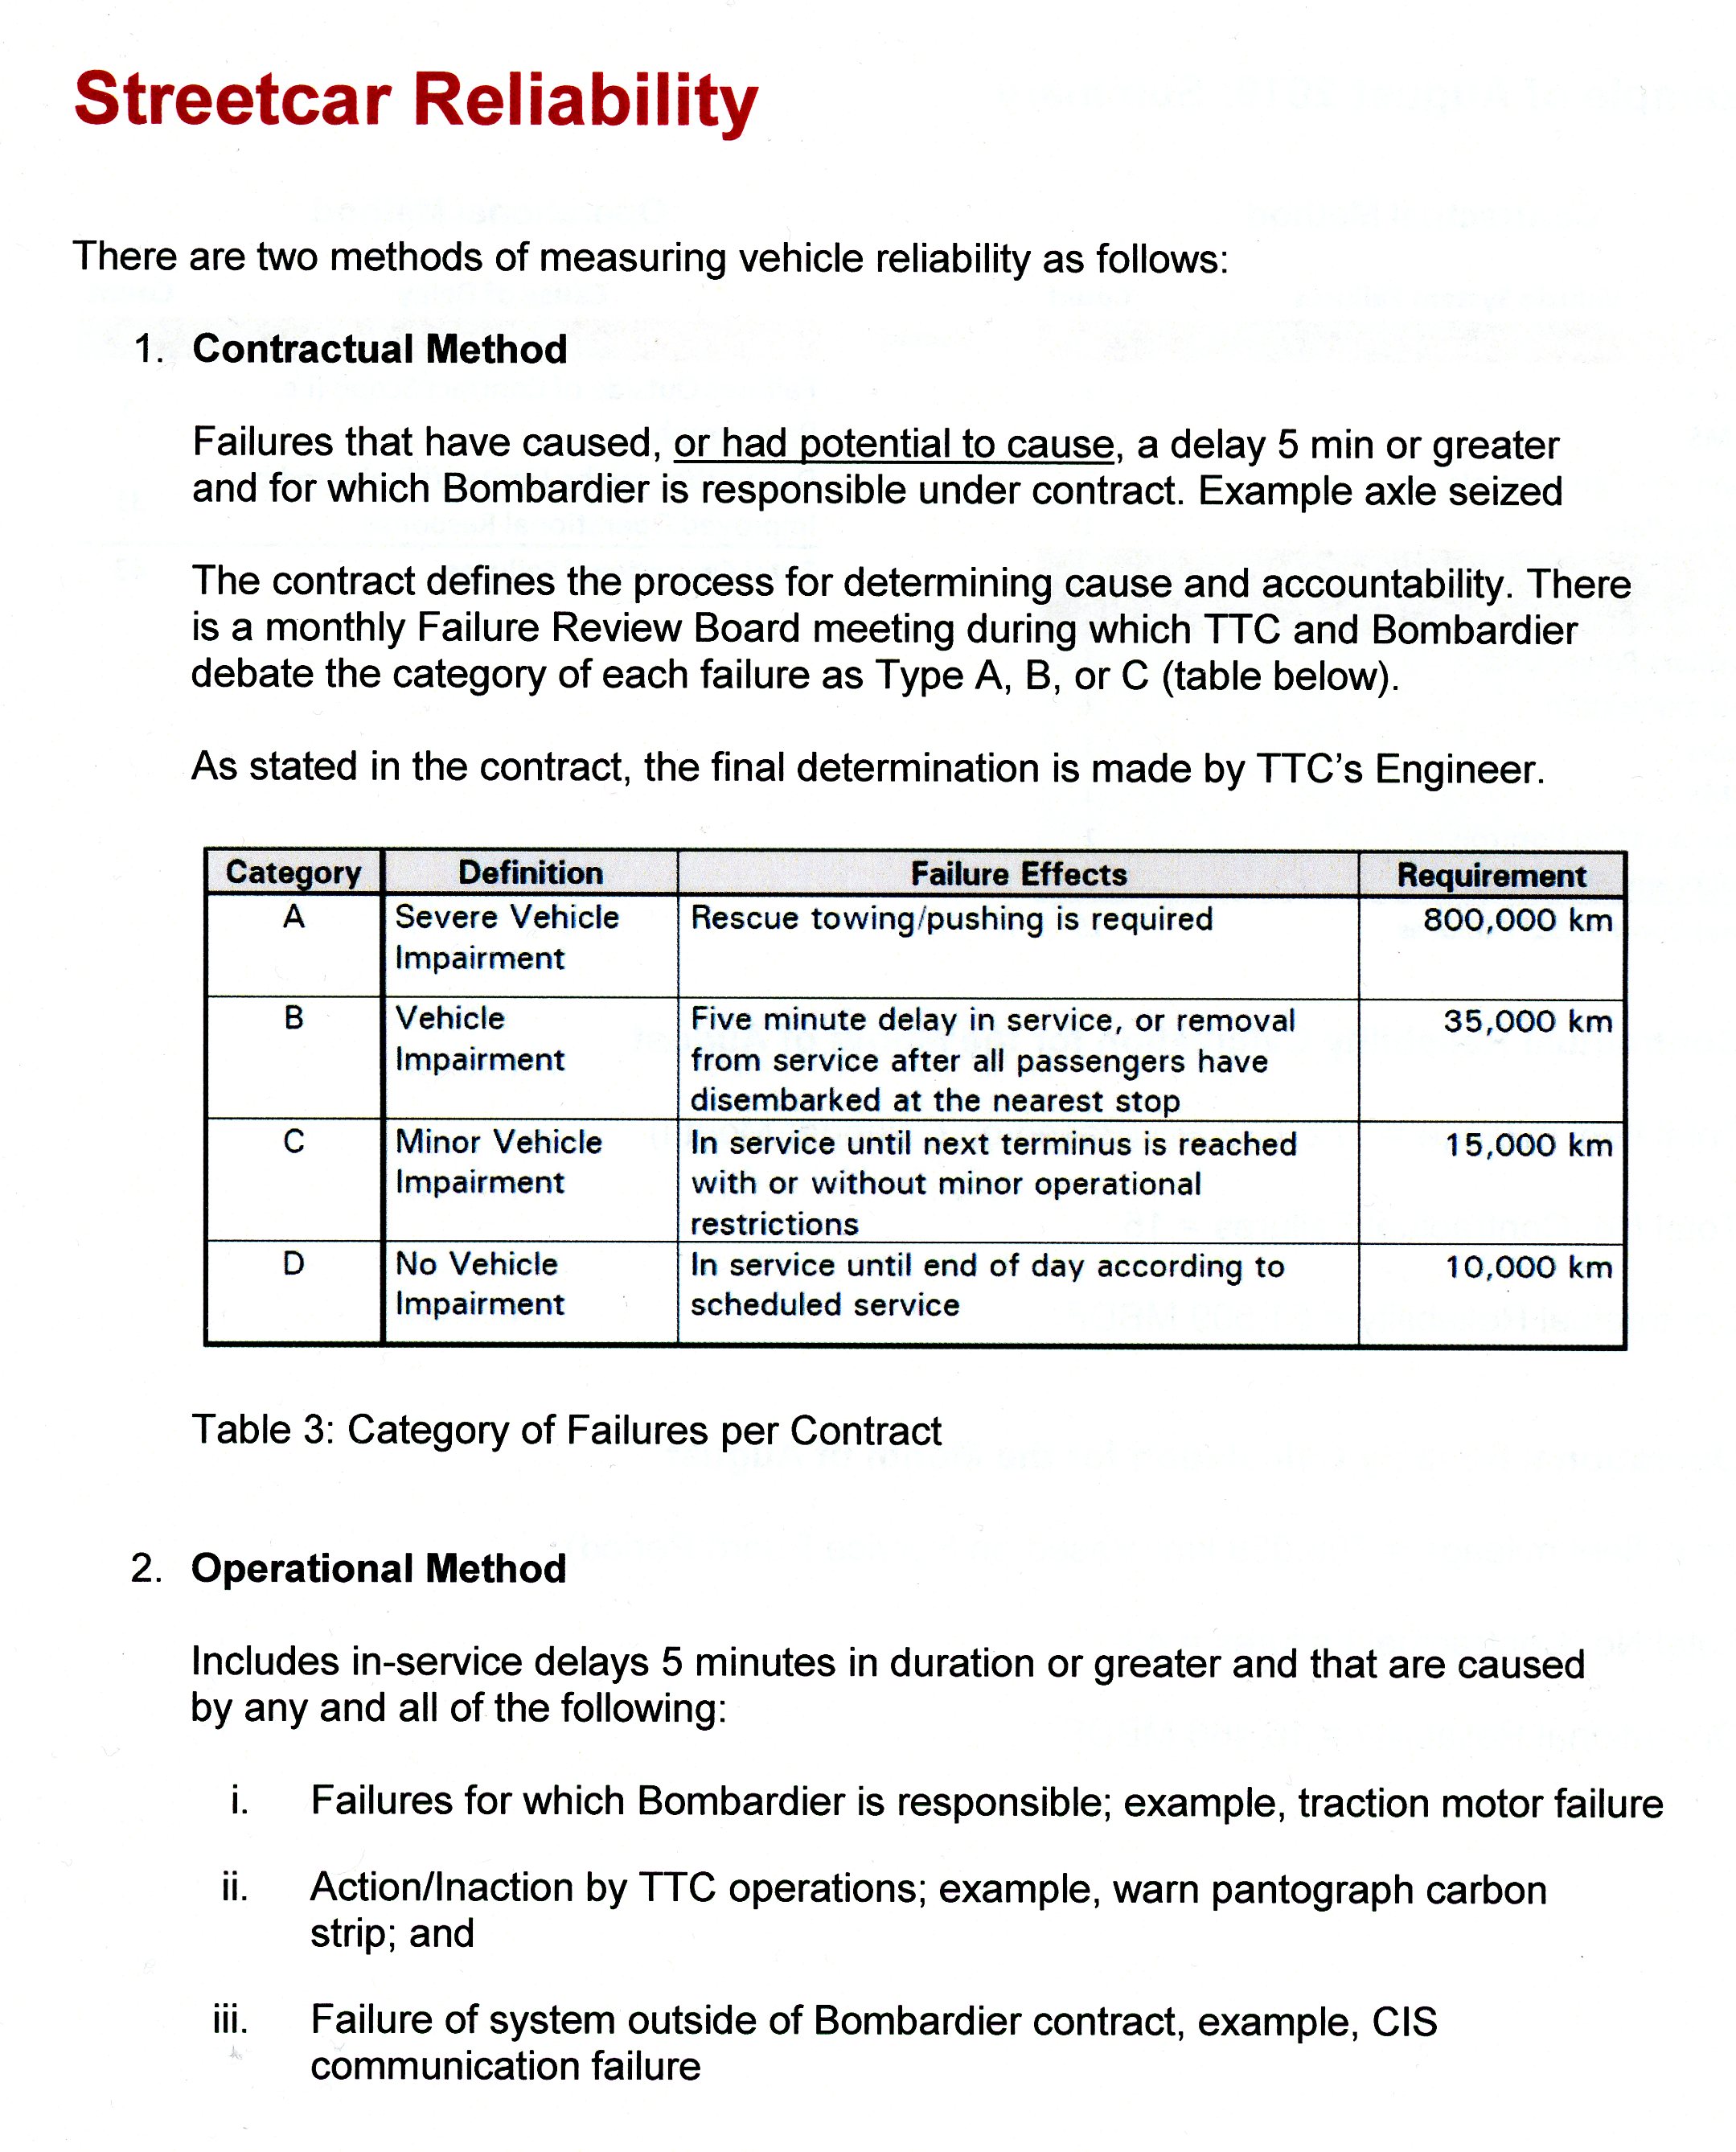
Within the contractual method of calculating reliability, there are four categories of failure, of which the “B” type has the 35,000 km MDBF target. These are described below, and the Bombardier presentation refers to “B” failures on a few occasions.

[Source: TTC]

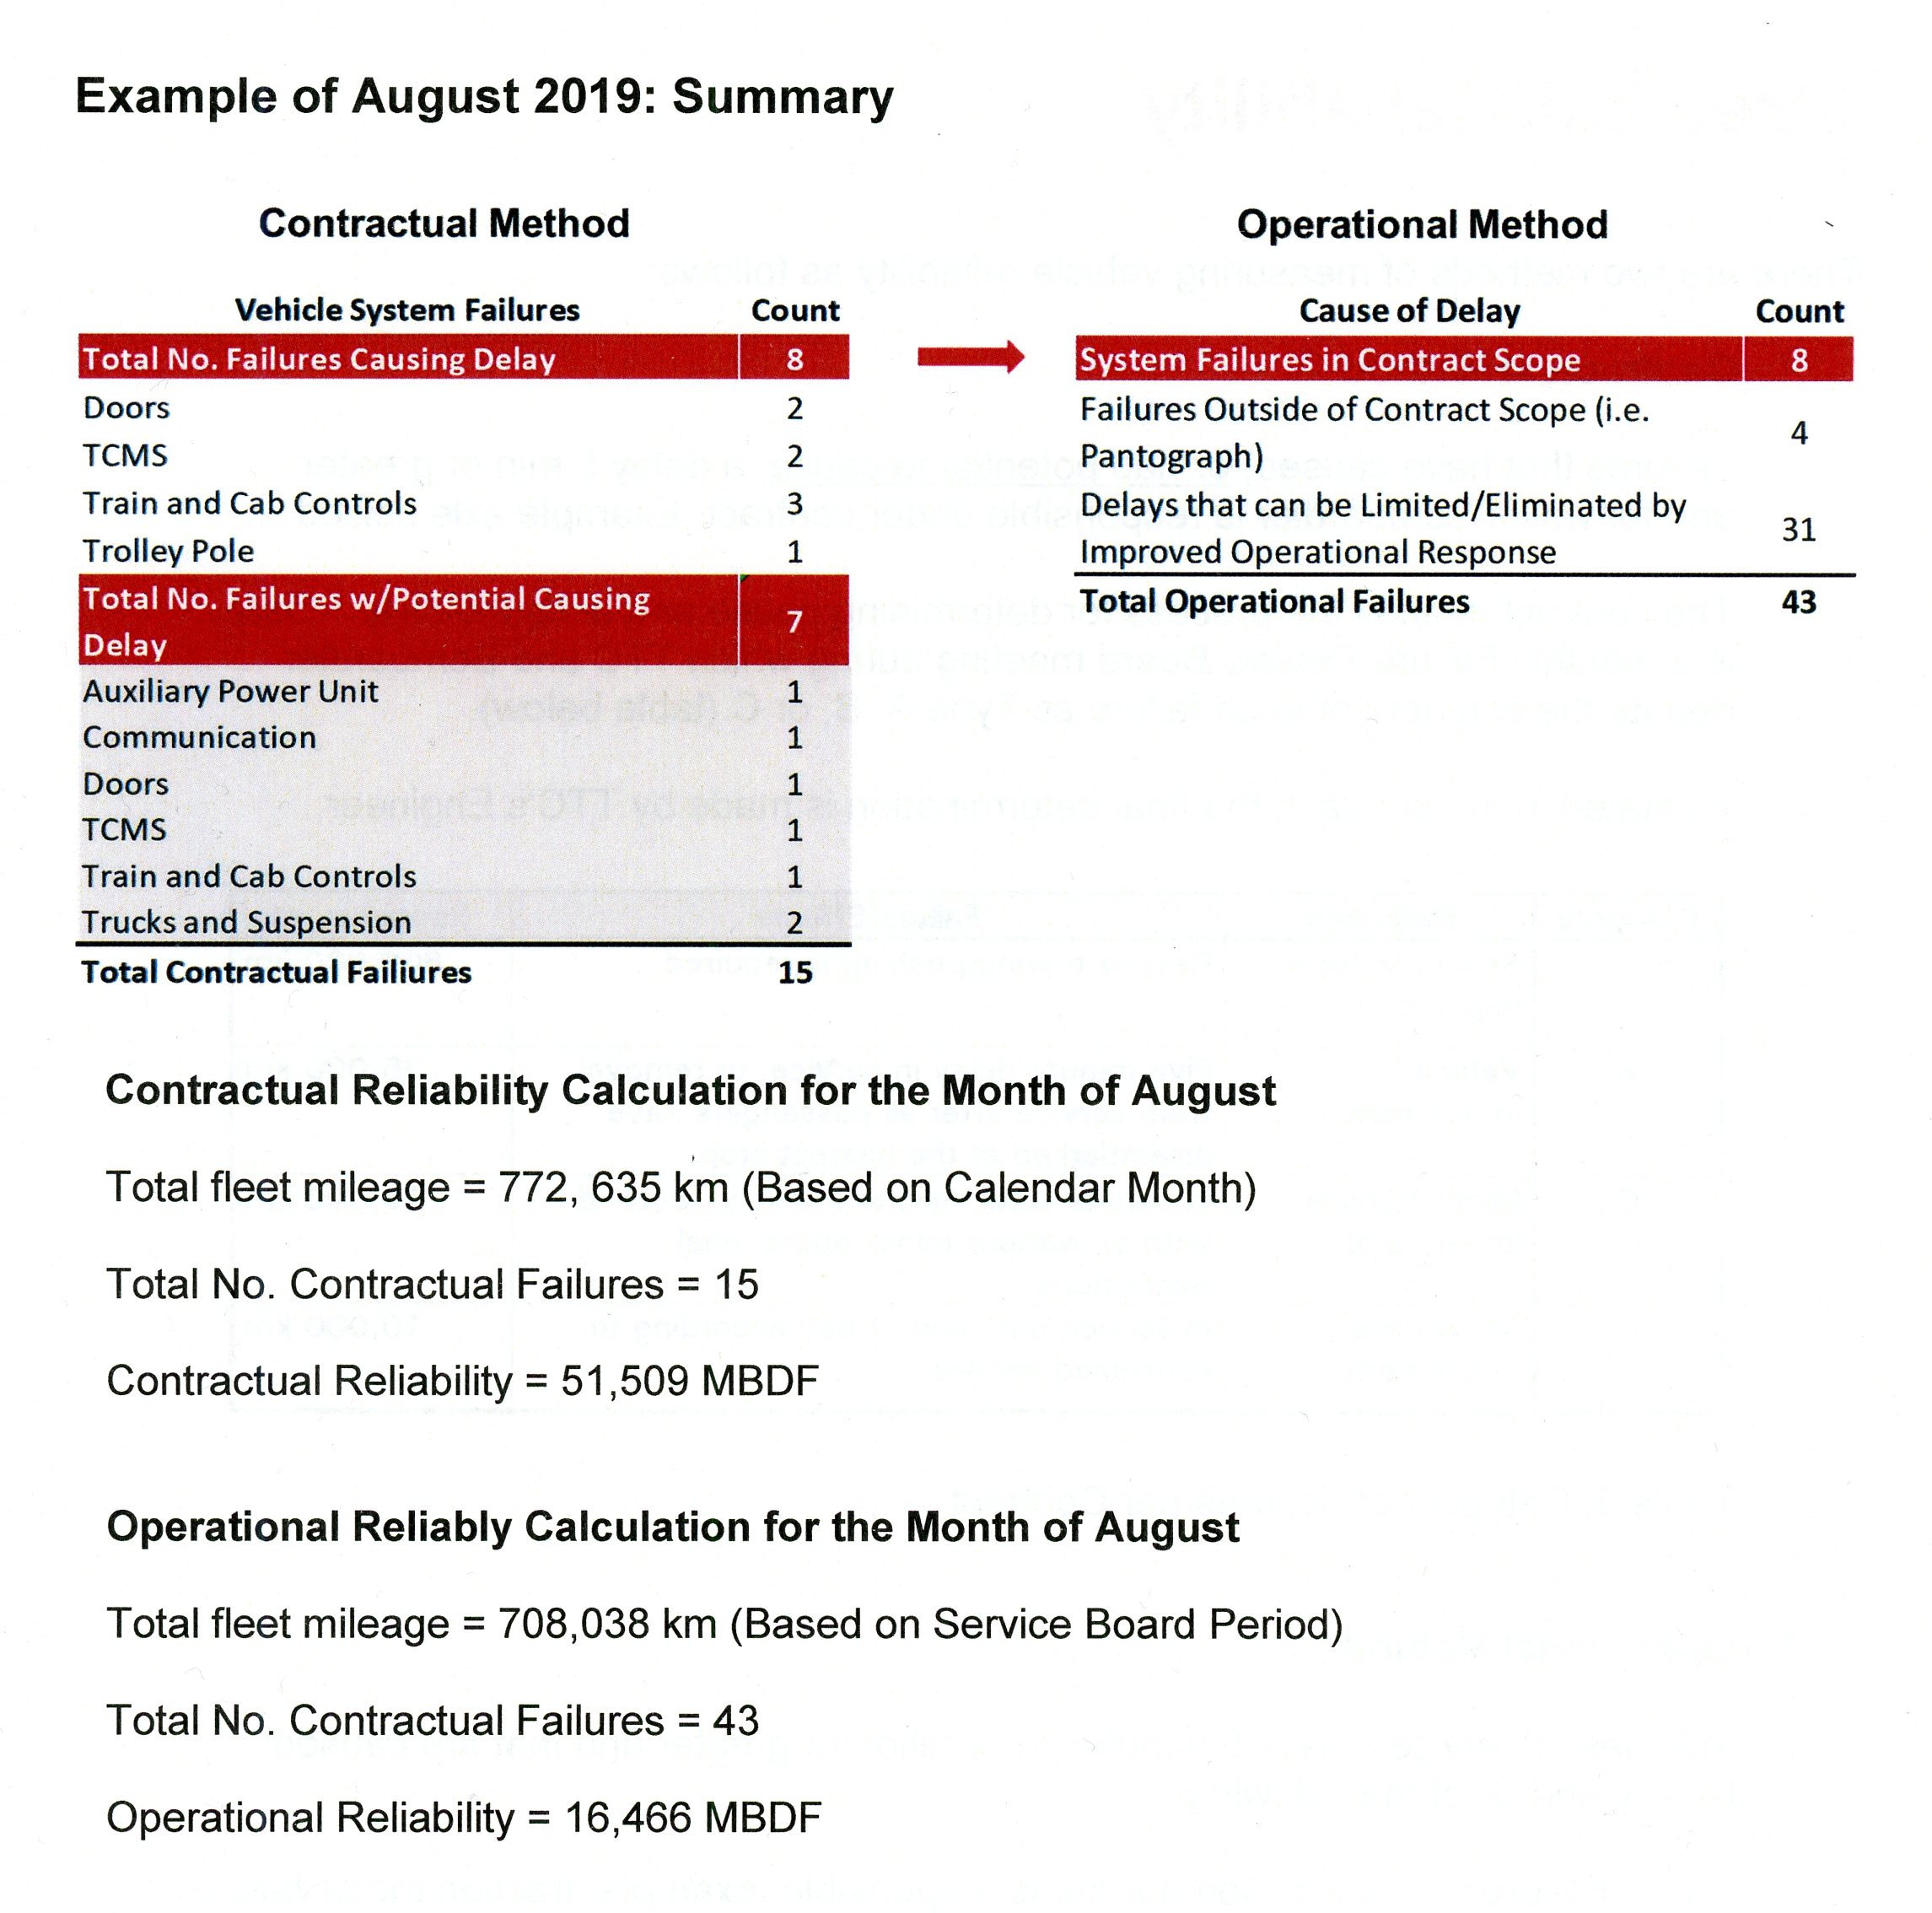
In the table below, the one on the left side lists a total of 15 failures chargeable under the contractual method, of which only 8 actually caused a delay while the other 7 did not. All 15 are counted in calculating the contractual failure rate. On the right side are the 8 contractual failures causing delay plus a further 35 that are not chargeable to the vendor.

Of particular note is the group of 31 “delays that can be limited/eliminated by improved operational response”. This implies there is work to be done on the TTC’s side in better handling and preventing failures that are at least to some degree under their control.

This is echoed in the October 2019 CEO’s Report:

With respect to the Operational MDBF, there were 28 additional delay incidents contributing to the 16,402 kilometres. These incidents included delays such as communication issues, camera issues and faults that should have been remedied under five minutes due to redundant systems on the vehicle. [p 41]

[Source: TTC]

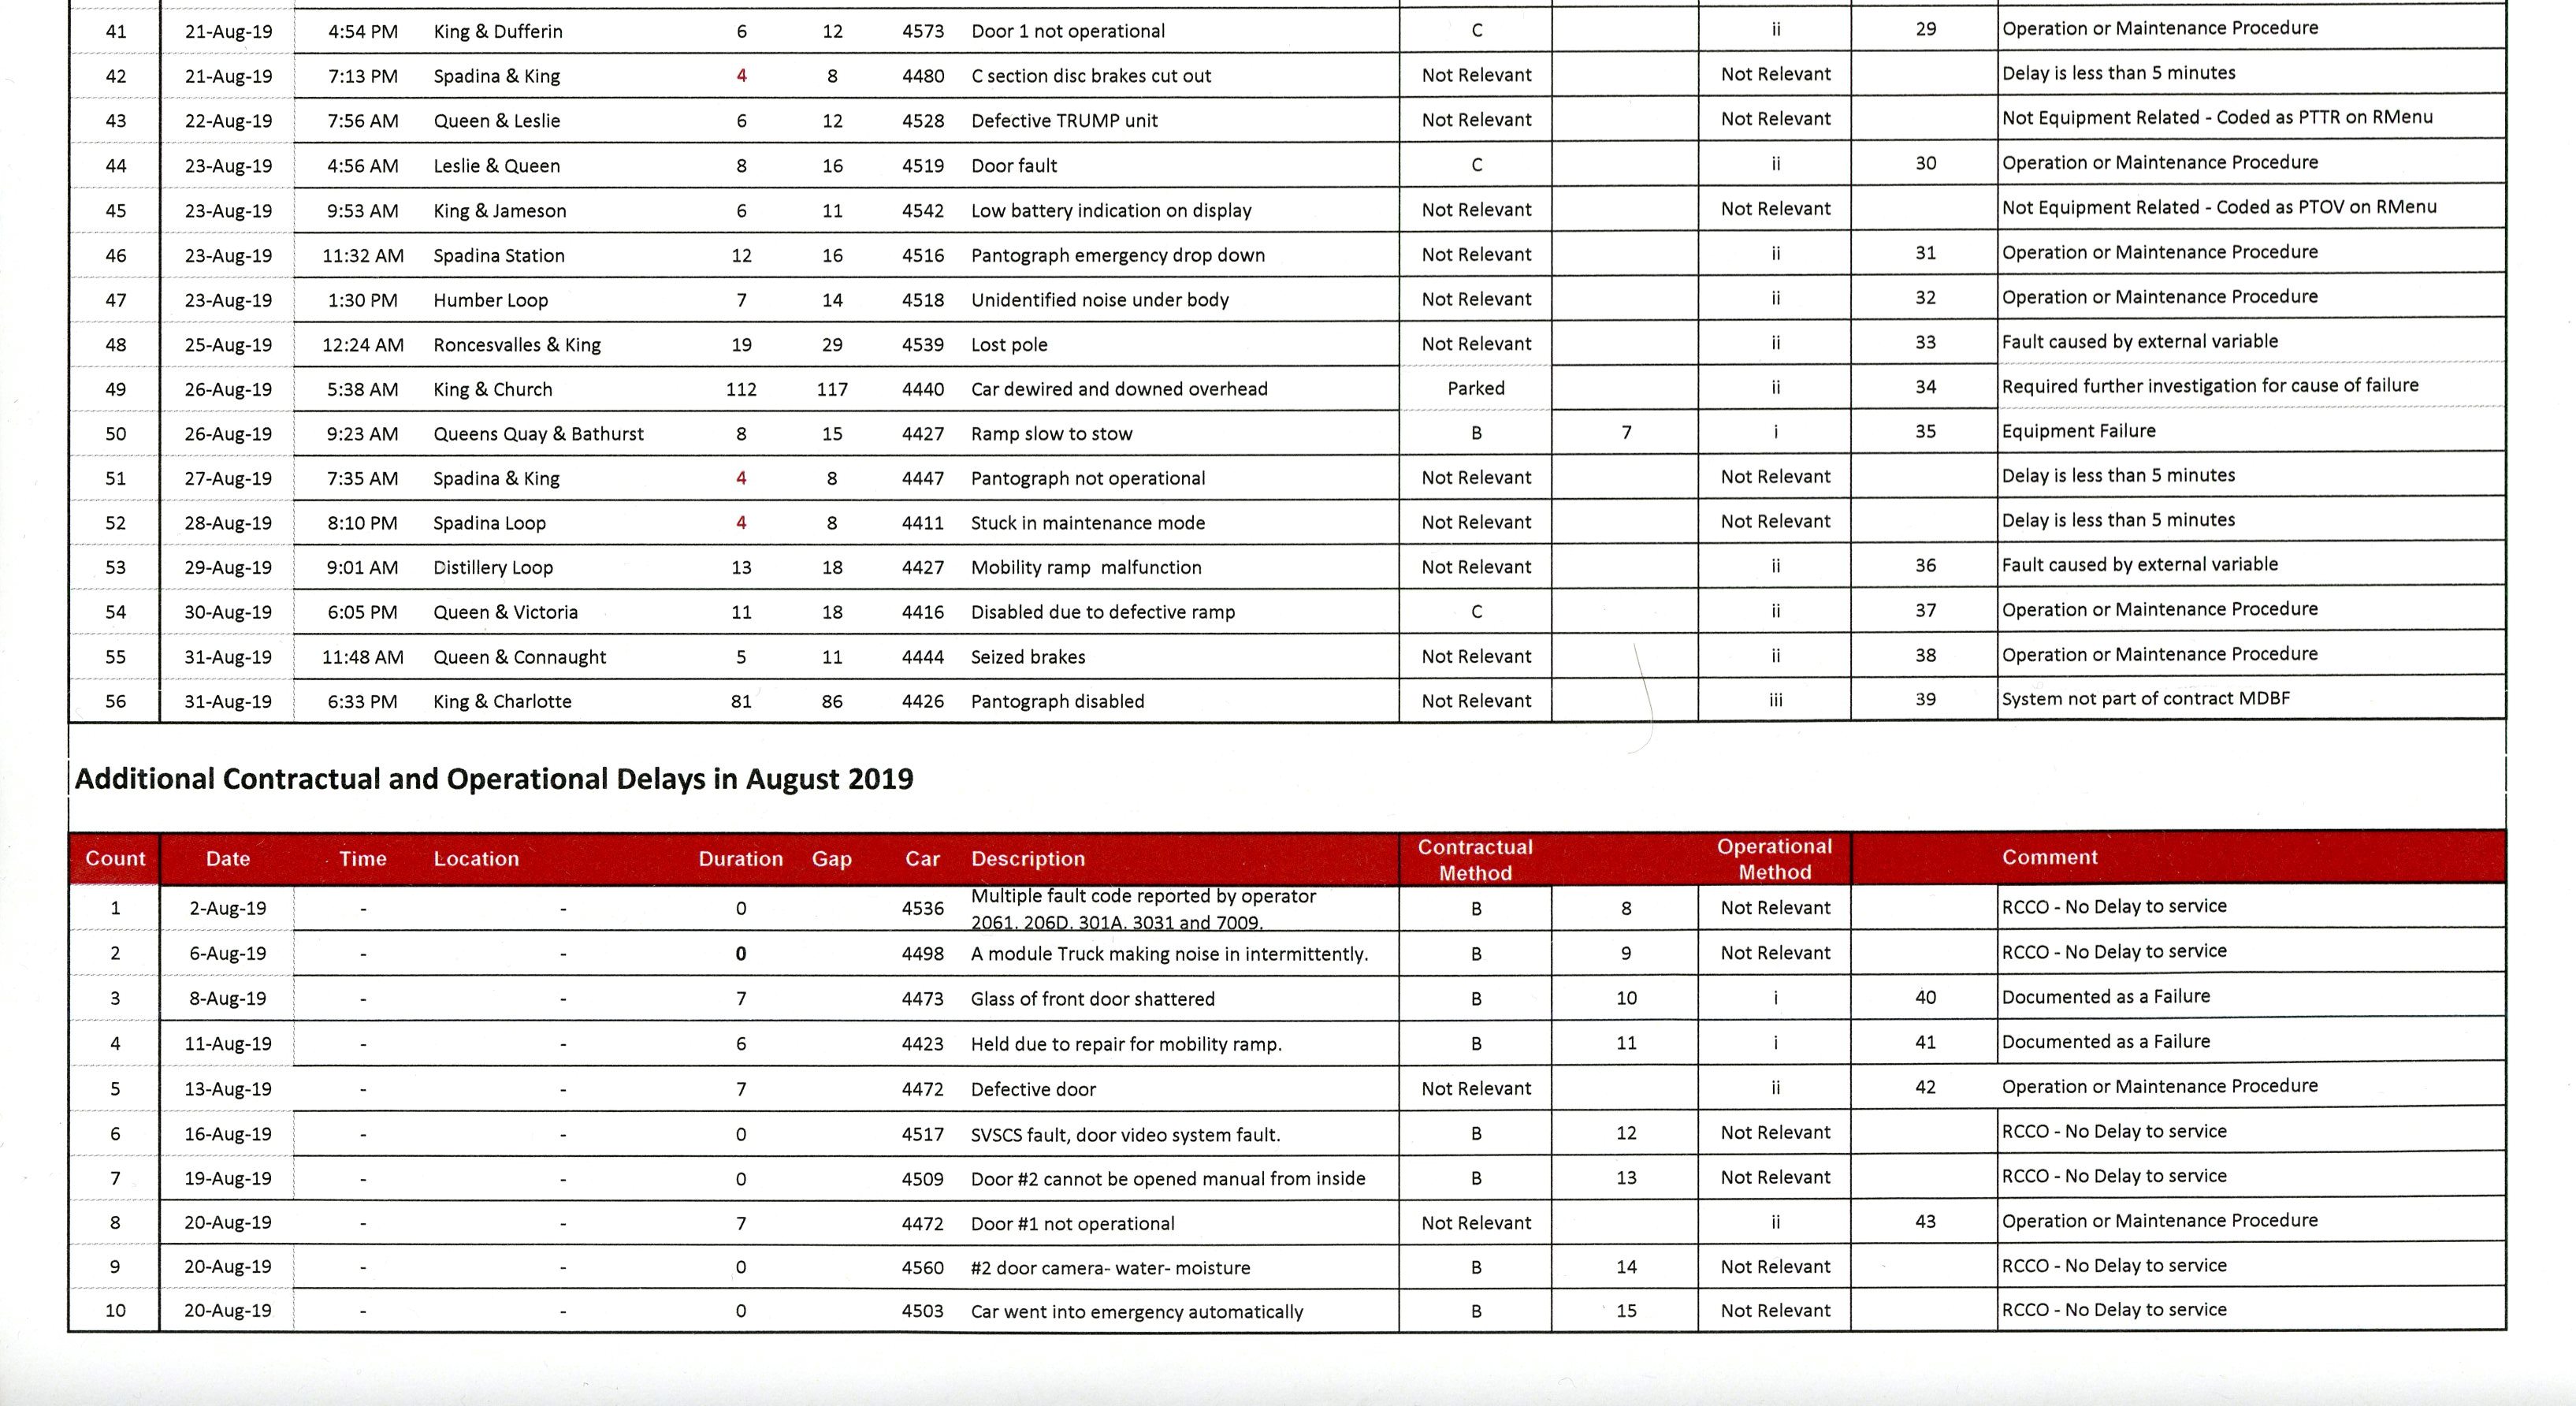
In my previous article, I included a detailed list of failures/delays that was built from the same source material Ben Spurr used for his article in The Star. This information was sent to a wide audience of politicians and media outlets including this blog. The TTC provided me with an updated version of this list including incidents not covered in the material published before. [Click to enlarge.]

[Source: TTC]

Bombardier’s Mea Culpa

Bombardier appeared at the Board meeting with a message about how their production pace and quality had improved. They were represented by Lee Sander, president of the Americas Division of Bombardier Transportation, and David Van der Wee, COO for that division.

Most surprising was their quite free admission that Bombardier greatly underestimated the complexity of adapting a car they had successfully built in and for the European market to Toronto conditions (use of salt in winter, grades, curve radii and track gauge) and of transferring manufacturing techniques from an experienced plant to their Mexican operations which were the source of many problems.

In the original bid for these cars, the competing proposal from Siemens was 50% higher than Bombardier’s price. Bombardier admits that they lost a lot of money on this contract. To what extent these losses might have been avoided with better project planning and management we will never know. This might show up indirectly in the bid price for any add-on streetcars if Toronto ever gets to the point of calling for quotes on them.

This was clearly a pitch to say “look at what we can do today” as a measure of what the TTC might expect in a supplementary order for streetcars. The problem, however, is that Bombardier’s reputation, and not just for the TTC order, is in tatters thanks to quality control problems of past years. There is little political love for a company that has had so many bailouts, and other vendors hope to cash in on a potential market where the outcome of bids is less influenced by political considerations.

The TTC’s plan to rebuild rather than replace its T1 fleet for Line 2 puts a big hole in what might otherwise have been a considerable vehicle purchase stream through the 2020s. I do not agree with this decision, but for reasons that have nothing to do with sending work to Bombardier. Rather, the TTC is locking Toronto into the existing capacity on Line 2 for over a decade by keeping the T1 trains.

As for new streetcars, the TTC desperately needs more to handle existing and future demand, not to mention potential network expansion in the waterfront, but all of the capital spending is now focused on subway and suburban LRT expansion, not on the existing surface network. Provincial funding cuts will hobble Toronto’s ability to expand service on its streetcar and bus networks for many years.

The Star’s Ben Spurr writes about Bombardier’s presentation here.

Tips for any vendor making a presentation especially to a potentially hostile audience:

  • If you have a slide deck, make sure that it contributes to what you are saying rather than just having a set of beauty shots.
  • Be sure all of the photos are the right way around (one was reversed) and show your product in the best, recent light (pantographs up, please) from your own photos rather than culling them from the internet.
  • Learn to pronounce the names of locations where you have employees correctly before you get here rather than stumbling over them while reading a prepared text (“Etobicoke”).

These gaffes might not have been noticed by everyone, but they speak to attention to detail, something the whole Flexity supply experience lacked.

How Reliable Are TTC Statistics?

Ben Spurr in the Toronto Star published an article on September 30 about the mis-reporting of vehicle reliability for the fleet of Bombardier Flexity streetcars.

In brief, the TTC reports defects for the new cars on a different basis than for the old ones (the CLRVs and the recently retired ALRVs), and this has two effects:

  • The reliability of the old cars looks worse by comparison to the new ones, and this supports the argument that the old cars should be retired as soon as possible.
  • The new cars have recently crested the performance specification from the Bombardier contract, but this is based on the way the failure rate is calculated.

The September 2019 CEO’s Report contains Mean Distance Between Failure (MDBF) charts for both types of streetcars still in active service. August 2019 saw the new fleet’s reliability go about the 35,000 km MDBF, and CEO Rick Leary reported at the TTC Board meeting of September 24 that the current number was running above 50,000 km.

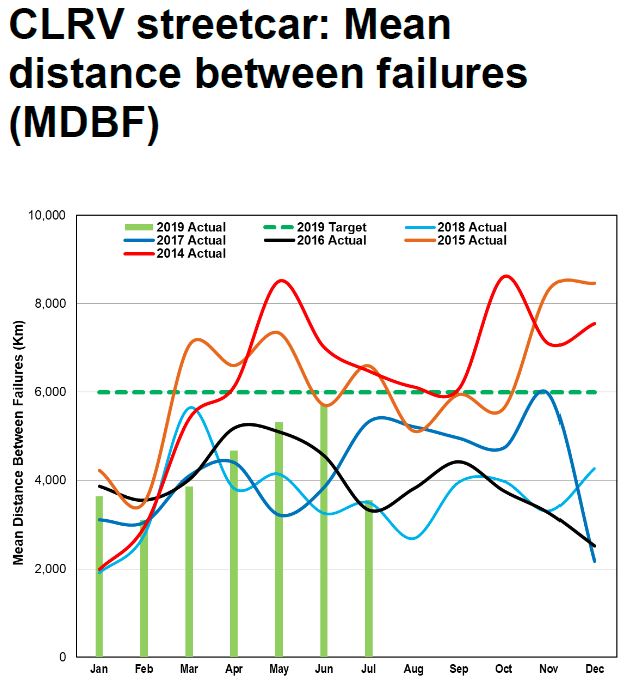
By contrast, the CLRVs have failed roughly every 4,000 to 6,000 km for much of the past three years with problems more common during the cold months. Note that the scales of the charts below are not the same.
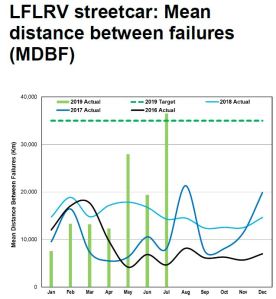
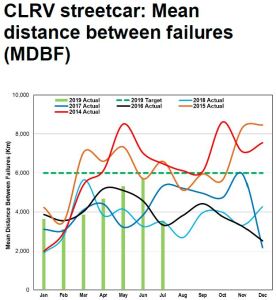
However, according to Spurr’s article, the basis of calculation is different for the two fleets. In the case of the new cars, only failures chargeable against Bombardier’s contracted reliability level are counted while for the old cars any failure counts. This makes a big difference when one considers how many of the in service failures were not included in the calculation for the new fleet.

Spurr writes:

The vehicle contract the TTC and Bombardier signed in 2009 set a MDBF target of 35,000 km. The cars were supposed to reach that figure by the time the 60th vehicle was delivered. That car arrived in January 2018, but the new fleet failed to hit the target then or in subsequent months.

That changed this summer. As Bombardier edged closer to completing its delivery of the 204-car fleet, and the TTC weighed the option of placing an order for additional streetcars with the company, the publicly reported reliability figures shot up.

They showed the cars had an MDBF of 36,500 km in July, and 51,500 km in August, the best the fleet has recorded since the early days of the order. CEO Leary cited that most recent figure at last Tuesday’s meeting as evidence the cars are “performing exceptionally well.”

However, over the same period the unpublished reliability figures didn’t improve. The “legacy” numbers showed an MDBF of just 16,400 km in August, which while much better than the early months of the year, was virtually unchanged from the mark set in May.

The unpublished “legacy” figures are consistently significantly worse than those the contractual numbers.

He goes on to write:

Internal TTC documents reviewed by the Star show that in [August] the new streetcars experienced dozens of delays related to faulty brakes, malfunctioning doors, broken HVAC units, and short circuit warnings. The agency tabulated 43 significant delays during that period, but only 15 were deemed Bombardier’s responsibility and included in the version of the stats that are made public.

That lower delay figure led to the contractual number of the cars running more than 51,500 km without a failure.

Readers can judge for themselves the type of delay that is omitted from the TTC’s reliability numbers from the following table which is compiled from TTC delay reports.

TTC_201908_LFLRV_DelaySummary

There are 56 items in the list and several patterns are immediately obvious:

  • Problems with the power collection system are common including pantograph failures, lost trolley poles or defective shoes, and dewirements snagging poles and/or damaging the overhead.
  • Brake problems
  • Mobility ramp problems
  • Failures early in the morning on cars that are probably just entering service

Many of the problems have nothing to do with Bombardier reliability stats and are not included in the calculation included in the CEO’s Report. If they were, the numbers would not look anywhere near as good.

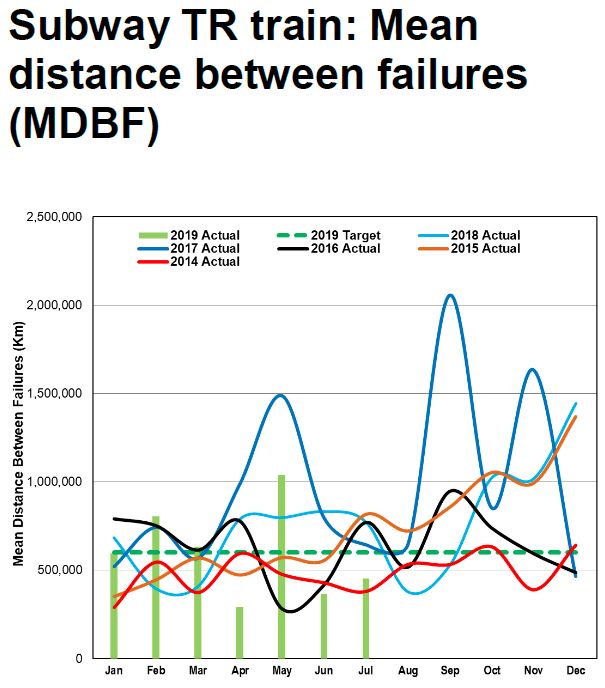
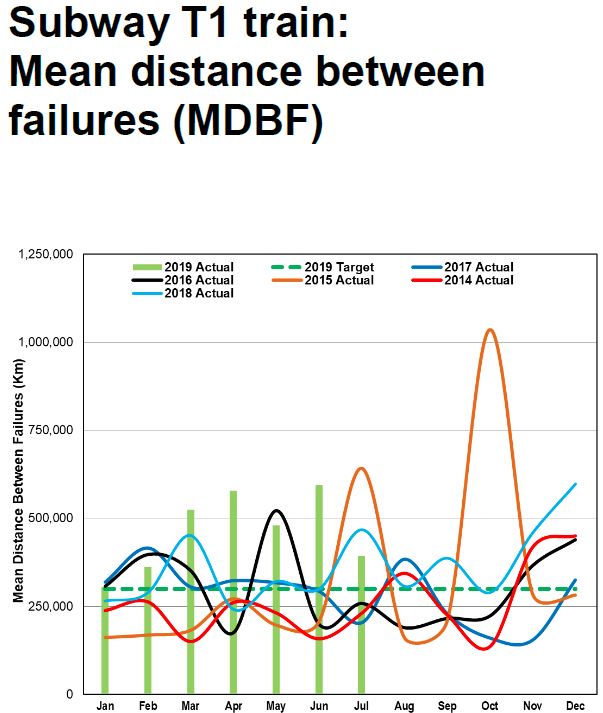
Something that is evident in reported reliability stats is that there can be large variations in MDBF values from month to month. The TTC does not make huge changes in the mileage operated by its fleet each month, and so the large swings must be due to a relatively low number of incidents. For example, if there were typically 100 incidents per month and this swings up or down by 10%, then the MDBF would not change much. However, if there were typically only 20 incidents per month, a small change in the month-to-month numbers would produce a big swing in the MDBF. This is evident in the Flexity reliability values and in those cited for the subway fleet, notably the newer TR trains on Lines 1 and 4.
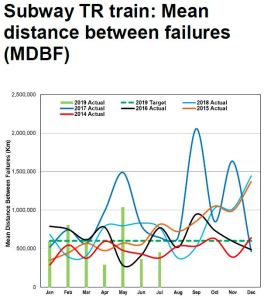
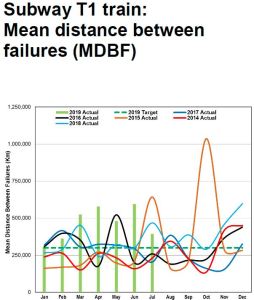
Even if all types of failure were counted, the service delay it causes must be five minutes or more. This is a standard adopted from the NOVA group of rapid transit operators and really is more appropriate for rapid transit lines.

An important distinction is that vehicles that run in trains have the capability of “getting home” even if one unit is disabled under most circumstances, and reliability stats for this type of operation will be higher than for single vehicles on a streetcar system. Also, rapid transit lines operate at higher average speeds, and failures that are affected more by hours of service than by mileage are spread over a larger distance operated. This is quite evident in TTC subway stats where the MDBF is much higher than for streetcars.

By contrast, it is difficult to imagine how a bus breakdown can cause a significant service delay except in comparatively rare circumstances, and the five minute delay screen for a chargeable delay makes no sense for the bus fleet.

The question of just how reliable various vehicle types might be is part of a larger issue with the selective, and possibly misleading reporting of statistics by TTC management.

Delays to service, especially on the subway, are caused not just by equipment failures, but by a raft of other subsystems and problems such as signals, track, power supply, fires, passenger assistance alarms and track level incidents. The TTC tracks the various types of delay, but reports on them only rarely in public. This means that sources of service delay that might be under the TTC’s control are not tracked in a report that is routinely seen by the TTC Board, nor is there any tracking of the effects of preventative maintenance or capital works to reduce this type of delay. One obvious example is the new Automatic Train Control system which is now operating on about half of Line 1 YUS, but we know nothing of service reliability on that section, Vaughan to St. Patrick, compared to the old signals still in use from St. Patrick to Finch.

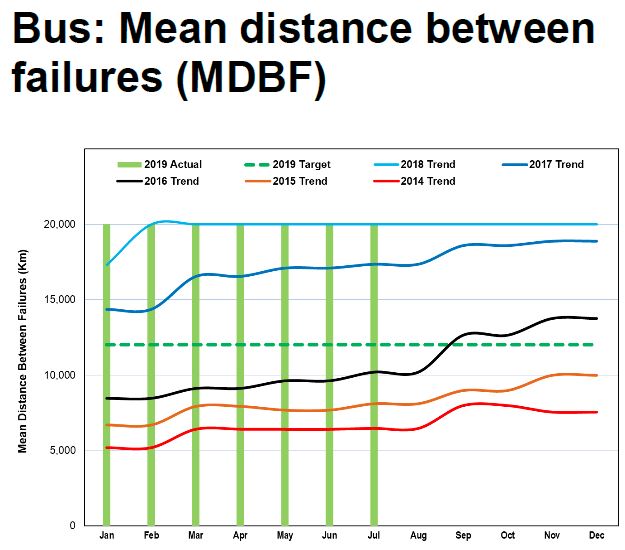
Bus reliability is reported in the aggregate for a fleet that ranges in age from brand new to over twelve years old. The TTC used to keep buses for at least 18 years, but now chooses to replace rather than rebuild old vehicles. Retiring a large tranche of 12-20 year old buses in recent years has had three effects:

  • The average age of the fleet is now quite low, and it will continue to drop. Half of the fleet is less than five years old, but as the “bulge” of new buses ages, the fleet reliability will fall.
  • With many new buses coming on stream, the TTC can keep old buses in service and maintain a high ratio of spares to service requirements. The situation is very different for the streetcar fleet where with the retirement of old cars, the fleet is too small to provide service on all routes with an adequate number of spares for maintenance.
  • The large order of buses soaked up the then-available funding for transit infrastructure as it was the only way Toronto could spend its allocation within the short timeframe dictated by the federal government.
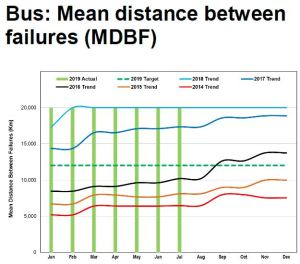
For reasons best known to the TTC, the chart above is clipped at 20,000 km rather than showing the actual variation, and this has been the case since early 2018. It is unclear whether the actual numbers are rising or falling over the past two years. Moreover, the values average the reliability for the entire fleet rather than showing subsets such as diesel and hybrid buses, or buses of varying ages or manufacture. This type of breakdown is vital in understanding fleet planning, not to mention tracking the benefits (or not) of technology changes such as the move to an all-electric fleet which is only just beginning.

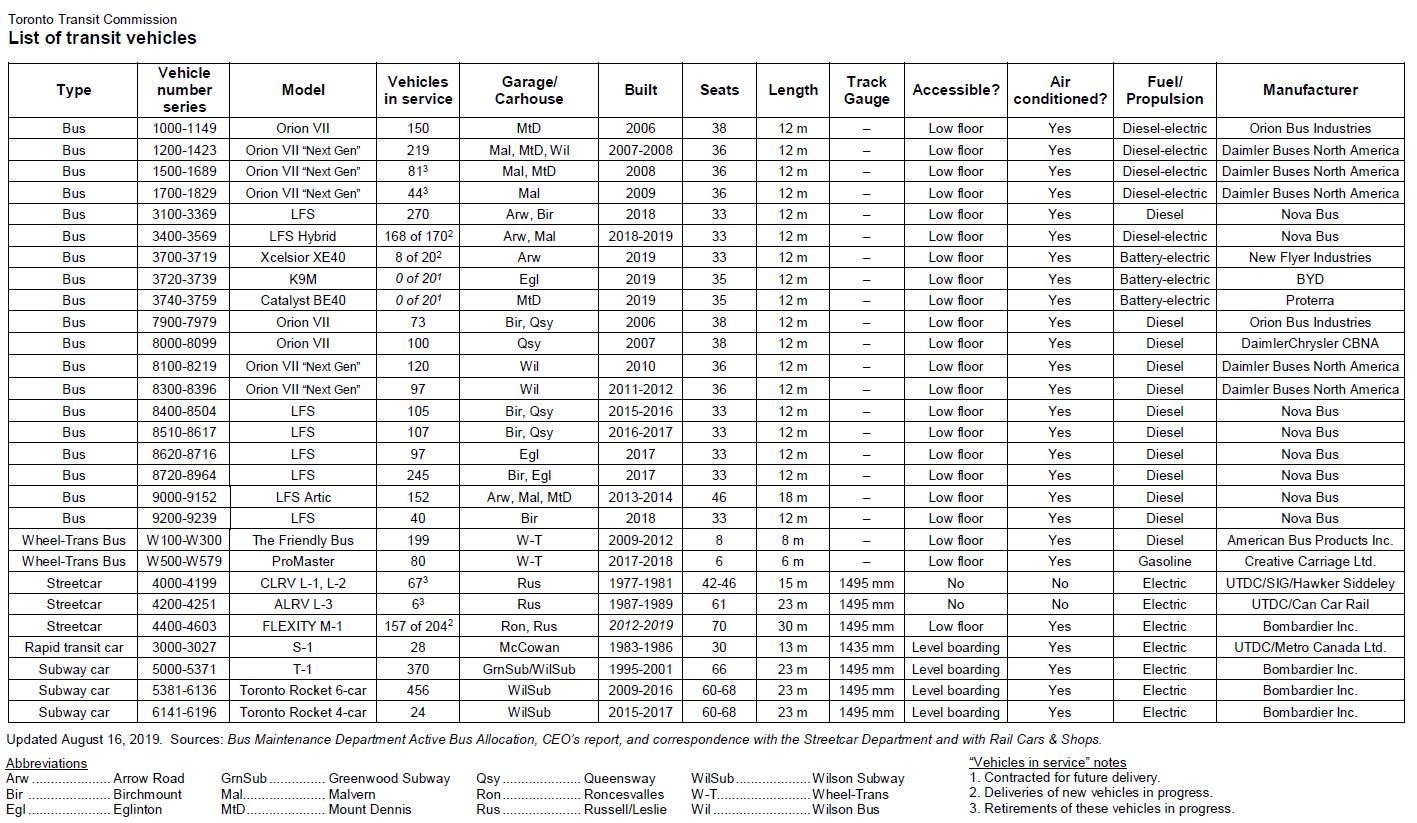
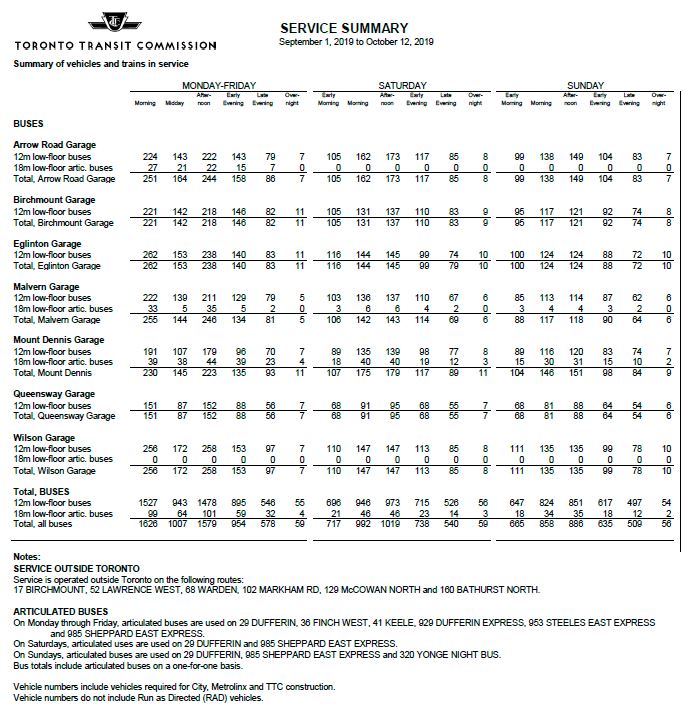
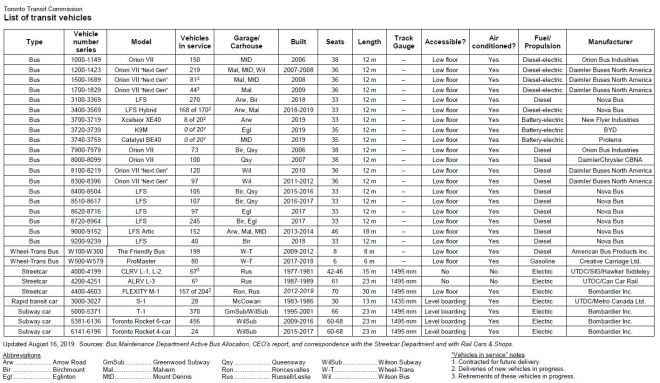
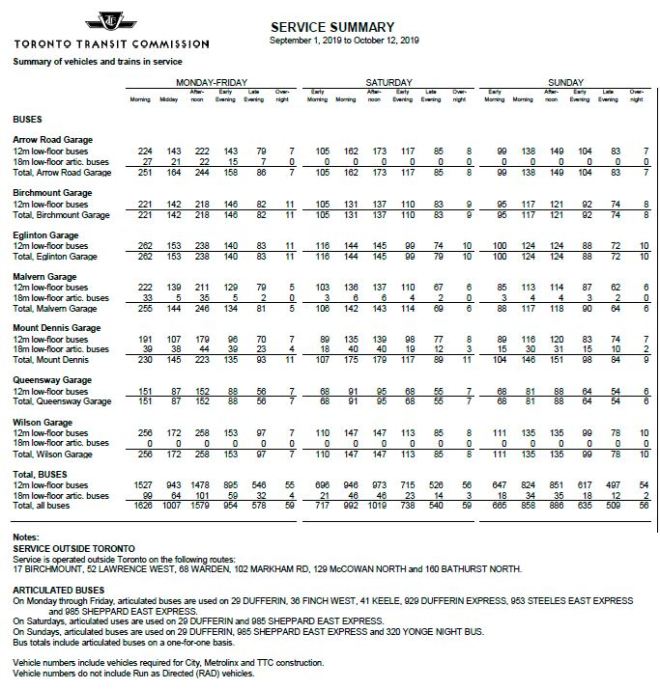
The TTC fleet of buses is much larger than its requirement for service. In total, as of the September 2019 vehicle list (taken from the Scheduled Service Summary, last page) shows a total of 2,076 vehicles as compared to a peak service requirement of 1,626 (p. 63 of the same document). This is a generous spare factor of over 27%, or one spare bus for every four in service. It is easy to get very good performance from your fleet with such a high ratio, but this also means that, in effect, the TTC operates one garage worth of spares for every four garages worth of regular service. This is far higher than the target spare ratio for rail vehicles.
In a separate post, I will turn to the question of service reliability, scheduling and the way in which service quality is presented by management to the TTC Board. This is another area where there has been a lot of work to make the numbers “look good” but with detrimental effects on the system.

Questions for the TTC:

I have posed a series of questions to the TTC and await answers from them. This article will be updated when they reply.

1. Has the Flexity reliability number always been quoted on the basis of failures chargeable to Bombardier, or was there a change in the methodology somewhere along the way? To put it another way, was there a change in what counted as a failure that created an artificial improvement in the reported numbers?

2. What is the situation with subway delays and MDBF numbers? Are all failures counted (at least those producing a 5 minute or greater delay) or only those considered to be the manufacturer’s fault? Is the calculation done the same way for the TR and T1 fleets?

3. The NOVA metric which the TTC uses is based on the idea of a failure that causes a delay to service. This only makes sense in the case of rail modes where a car/train failure can block the line. For buses, only a rare and well-positioned failure could actually block service. How is a chargeable failure calculated for the bus fleet?

4. Are numbers available for subsets of the bus fleet (e.g. all buses from the same order, age, technology) so that reliability figures can be compared as they have been with rail modes?

5. The CEO’s Report includes only stats for delays caused by vehicle faults, not from other sources such as infrastructure failure. Why is this info not also tracked in the report so that the effects are clear on a proportionate basis? In particular, there is no tracking of signal failures on various parts of the subway with older and newer technologies.

Summary:

TTC management should report vehicle reliability numbers on a consistent basis for all types of vehicles.

The calculation of service interruption rates should reflect what riders experience, not simply numbers to establish contract performance for suppliers or to artificially enhance the reported performance of some vehicle types.

The reliability statistics for the bus fleet should be broken down by major vehicle groups (manufacturer, propulsion technology, age) to allow meaningful comparisons and to ensure tracking of maintenance/reliability as parts of the fleet age.

The very large spare ratio for the bus fleet should be reviewed to determine whether this size of fleet is actually required, or if more service could be operated if only the TTC would budget for the cost of its operation.

Delays caused by infrastructure issues and other interruptions should be tracked and reported so that their effect on service quality can be seen in comparison to vehicle related problems.

The Last (Official) Trip of the ALRVs

Today the TTC officially retired the last of the ARLV (Articulated Light Rail Vehicle) fleet with 4204 and 4207 doing the honours running a 501 Queen shuttle between Russell Carhouse (east of Greenwood) and Wolseley Loop (at Bathurst Street).

In what has become a tradition with the TTC’s older cars, there was an emergency truck and a “pusher” CLRV whose job would be to push its partner ALRV back to the carhouse (or at least off of a main route) if something went wrong. 4117 shadowed 4204 while 4156 partnered 4207.

Nothing went amiss, and the ALRVs ran their three hours of service without incident. Indeed, 4207 did double duty making an early trip as part of the Labour Day Parade before making the first eastbound trip on the 501 ALRV shuttle from Bathurst Street.

Many people are posting photos from the day on Twitter and Facebook. Here are the best of my own.

TTC CEO’s Report: August 2019

Although the TTC Board takes a long siesta through the summer, the CEO produces a monthly report even in months when the Board does not meet. The August 2019 edition was recently posted on the TTC’s site.

This report continues a format established some time ago by CEO Rick Leary in which the focus is on measures of system performance. There is no financial information here, and only summary ridership numbers with no sense of the associated revenue. All of the financial reporting was hived off of the CEO’s report into a quarterly CFO’s report, but we have not seen one of those since April 2019, and that covered the year ending December 2018. One might have expected an update at the July Board meeting, but the abrupt and unexpected departure of CFO Dan Wright in early June appears to have iced the short-lived report.

I spoke with Wright at the Audit & Risk Management Committee meeting the day before he left the TTC, and he gave no indication of his impending departure. We spoke about the problems of counting “rides” in an environment where there is only a tenuous link between fare payment and the actual number of trips (or trip segments) taken.

The TTC has been wrestling with the possibility that ridership has been over-reported for some time, and the situation is further complicated by Metropasses, the move to Presto and the two-hour fare. Just what is a “ride” for statistical purposes? I had planned to follow this up with Wright for an article here, but alas he vanished like so many other senior TTC staff in the past year. The problem is summarized in the CEO’s Report:

Higher PRESTO adoption appears to have affected measured ridership in two ways. First, we now have more precise ridership data compared to counting tokens and weighing paper tickets. Second, more than 25% of our former monthly pass customers have converted to PRESTO pay-as-you-go e-purse each month in 2019, likely to take advantage of the two hour transfer and for some, the TTC/GO discounted co-fare. This would affect measured ridership to the extent that these customers may ride less often than the monthly average of 71 rides per adult monthly pass. [p 25]

Josie La Vita, the Executive Director of Financial Planning for the City of Toronto, replaced Wright on an acting basis pending recruitment of a new CFO, a process expected to take 12-24 months.

The CEO no longer reports financial data on operations or capital projects, and the absence of a CFO’s report leaves a major gap in information available to the TTC Board and Council on the system’s actual performance.

Moreover, riding counts (i.e. vehicle occupancy) are only rarely reported at a route level, and a “crowding report” has not recently seen the light of day. When crowding data are released, they are averaged and this gives no indication of the effects of bunching and gapping on individual vehicle loads. Performance metrics that do appear in the CEO’s Report do not fully describe the service quality actually experienced by riders particularly on surface routes.

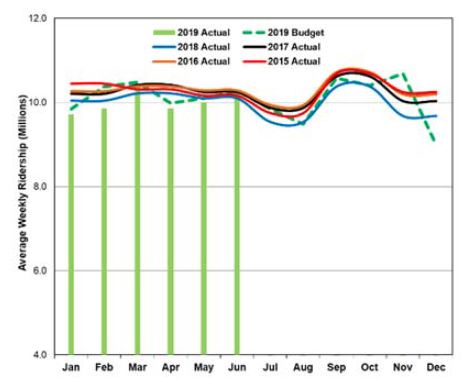
Ridership for 2019 to the end of June is reported as 267.8 million as against a target of 271.9m and a 2018 figure of 270.3m (down 1.5% and 0.9% respectively). For the month of June itself, ridership is on target. As the chart below shows, the shortfall in 2019 came primarily in the winter months which were unusually cold. June’s ridership was boosted by the Toronto Raptors Championship Parade without which the number would have been down 0.6% compared to 2018.

Weekend ridership is down, and this is thought to be due to various factors including the number of subway shutdowns. These are not going to end any time soon with the ongoing signalling projects and other infrastructure upgrades, and at some point the TTC cannot treat their effects as unexpected. A follow-on problem for the TTC is the perception by riders that “the subway is always closed” and this can affect ridership as much as the actual shutdowns.

Presto fare card usage continues to increase and by June 2019 the adoption rate reached about 80%. Presto ridership for the first half of 2019 was 214.2 million out of the total reported ridership of 267.8m.

Vehicle Reliability

The fleet benefits from improved preventative maintenance and from the retirement of older vehicles. Before the onset of hot weather, there was a concerted effort to get air conditioning systems in good order, and AC failures were rare even with the particularly hot weather in 2019. (Personally, I never encountered a “hot car” on the subway, a first for several years running.)

On the streetcar fleet, the decline in the proportion of service provided by the nearly 40-year old CLRVs and the disappearance of their ALRV cousins (of which a few are still officially active but never seen in revenue service) contributes to a reduction of in service failures. The Flexity fleet has its ups and downs for reliability, but even running below its target, these cars are much more reliable than those they replace.

On the bus fleet, the retirement of old buses and the recent purchases of hundreds of new vehicles has substantially lowered the average age of a bus and increased the proportion of buses that are “spare” relative to service needs. The fleet is over 2,000 vehicles, but the peak requirement in June was 1,641 including buses used on streetcar lines. This generous spare ratio has benefits in service reliability but also a cost in both capital and in garaging.

Continue reading

Streetcar Network Changes Coming in September 2019

Several streetcar routes will be affected by construction, schedule changes and the continuing shift from CLRVs to the low-floor Flexitys effective September 1, 2019. I will publish the detailed service plans with my overview of all schedule changes taking effect on that date, but here is a preview of the route changes.

Kingston Road & Queen Construction

Two projects will block streetcar service from The Beach from September 1 until mid-November:

  • Watermain replacement
  • Special trackwork replacement at Kingston Road including Woodbine Loop

501 Queen Service

The 501 Queen route will be operated with several overlapping services:

  • Regular 501A Queen cars will operate between Humber Loop and Russell Carhouse.
  • Buses on 501R will operate between River Street and Neville Loop diverting via Woodbine, Lake Shore and Coxwell.
  • Service to Long Branch on 501L will be provided by low-floor cars running from Humber to Long Branch on ten-minute headways at all times.
  • Late evening service will run through from Long Branch to Russell Carhouse.

Tripper services will operate including the restoration of 508 Lake Shore:

  • Bus trippers on 501 Queen will operate westbound from Coxwell rather than from Kingston Road. In the PM peak, eastbound trippers will run through to Neville using the same diversion as the 501R.
  • Streetcar trippers will operate on 508 Lake Shore with five trippers in each peak period.
    • In the AM peak cars will follow the Queen route from Long Branch to Roncesvalles, then run east to Parliament via King Street. They will return to Roncesvalles Carhouse via Parliament and Carlton/College, a route used by Long Branch trippers years ago to provide supplementary westbound service on Carlton to the University of Toronto. Cars will leave Long Branch Loop between 6:40 and 8:10 am.
    • In the PM peak, the trippers will run east from Roncesvalles to Broadview via King, then loop via Broadview, Dundas and Parliament running west from King and Parliament to Long Branch. Cars will leave Church Street westbound between 4:20 and 5:40 pm.

Overnight service on 301 Queen will terminate at Russell Carhouse, and it will continue to operate on the recently-established 15 minute headway. A 301B bus shuttle will operate from Russell Carhouse east to Neville diverting around the construction zone.

502/503 Downtowner/Kingston Road

For the duration of this project, the 502 and 503 services will be consolidated as 503 Kingston Road, and this route will operate from Bingham Loop to York Street. There will be no 502 bus service to McCaul Loop.

Service will divert around the construction site via Dundas and Coxwell both ways.

The downtown loop will be changed from the usual 503 arrangement. Buses will not operate on Wellington, but will continue on King to York Street. They will then turn north on York to Richmond, west to University and south to King Street. The layover point will be on York Street north of King.

22/322 Coxwell

During weekday daytime, the 22B Coxwell service will use Coxwell-Queen Loop rather than the longer route via Eastern Avenue which will be blocked by construction.

Evening and weekend service on the 22A and 322 services to Victoria Park will divert both ways via Dundas Street but will loop south to Queen via Coxwell-Queen Loop.

512 St. Clair

With the addition of low-floor service to Long Branch operating from Roncesvalles Carhouse, the 512 St. Clair route will move back to Leslie Barns. The carhouse routing will be via Queen, King and Bathurst, and cars will operate with pantographs up over these trips. This will mark the first scheduled pantograph operation over portions of these streets.

The operator relief point will be moved east from Lansdowne to St. Clair Station.

Carhouse Allocations

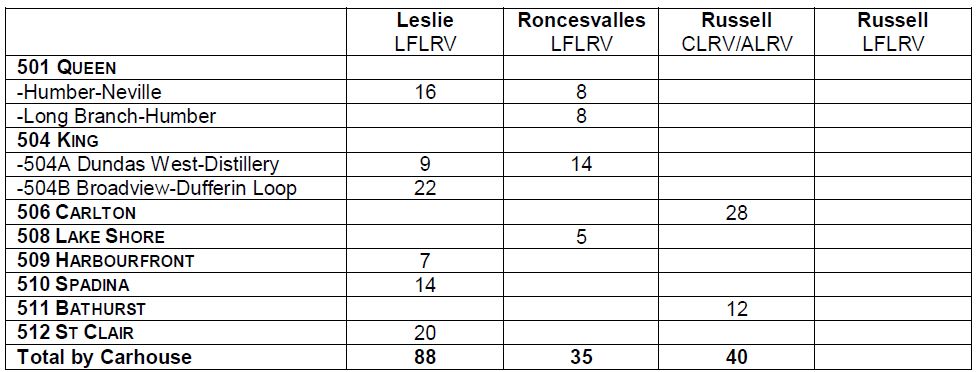
The routes and vehicles will be allocated to carhouses as shown below. Note that these are the scheduled service numbers, not the total fleet including spares.

Current plans are to begin conversion of 506 Carlton to Flexity operation later in the fall, but the details of this have not yet been published.

Bombardier Layoffs Should Be No Surprise To Politicians

Today’s news of Bombardier lay off plans for half of its Thunder Bay workforce came as political shock, but anyone who has been paying attention to both their empty order book and cutbacks in fleet expansion plans in Toronto should not be surprised.

Bombardier’s industry credibility is less than sterling, but much depends on which product lines and manufacturing plants are involved. A high regard for trams produced in Europe does not translate directly across the patchwork quilt of plants and products Bombardier built into a conglomerate over decades. Back when the Flexity was sold to Toronto, it was touted as a relative of a new 100% low floor design for Berlin, and if Toronto had received Berlin-quality vehicles, a great deal of the anguish about our new streetcar fleet might have been avoided.

It is no secret that Toronto needs more than the 204 new cars it will have by year-end, but the urgent problems of streetcar fleet capacity have been ignored by politicians besotted with new rapid transit projects. The issue predates the Ford government’s moves to take over some or all of the TTC, although that brings further complications. (There are parallel issues with bus fleet capacity planning, bus as they don’t involve Bombardier, I will not get into them here.)

Getting a new streetcar is not simply a case of sending an email to Thunder Bay and saying “send us 60 or 100 more”.

Thunder Bay is more an assembly plant than a point of manufacture for many parts of these cars. Expensive subsystems, such as electronics, are built in Asia, and a significant chunk of the vehicles can never be “Canadian content” because there is no domestic industry for some components. Before any new car order can start down the production line, Bombardier must load up its supply chain.

But we cannot even get to the point of ordering vehicles until funding is in place.

Toronto has a desperate shortfall in its capital budget and funding plans, and anything related to more streetcars is no more than a notional entry if funding were available. It never is because this must compete with a long list of competing projects, not all of which are even in the transit funding envelope. There is a further problem because moving beyond the 204-car order will trigger several other expensive TTC projects including a proposed major change in the use of Hillcrest Shops, and it is not clear just where the TTC would put a much expanded streetcar fleet. (Again there are parallels with bus network shortages, compounded by plans to move to a zero-emission fleet.)

At Queen’s Park, the idea that the streetcar-hating Doug Ford would fund a bailout of Bombardier by way of an order for more streetcars is not credible. If any money flows for rail cars, this would go to more GO passenger cars, or, less likely, new subway cars. GO cars would be a stop-gap, and in any event, direct purchases for GO run counter to Metrolinx plans to push equipment choice and acquisition down to a future network operator for the GO Regional Express Rail (RER) network. There is no guarantee this work would go to Bombardier. Although the Ontario line’s technology is still a mystery, it will definitely not be a conventional subway car. This brings us to the Skytrain technology best known in BC (a Bombardier product, but not from Thunder Bay), or to something comparable from another vendor.

In Ottawa, the federal government has its Public Transit Infrastructure Fund, but Toronto’s allocation is already fully spoken-for for Doug Ford’s transit scheme. There is no money sitting on the table to fund a streetcar purchase. The haggling between the two governments about which of them is holding up spending ignores the fact that none of the subway plans will trigger large scale car orders in the near future.

Even when this is sorted out, the pace of transit spending for the Toronto share is well above the levels in past budget forecasts.

Until the 2019 budget cycle, the TTC had planned to begin replacing its “T1” subway car fleet (the trains that serve Line 2 BD). Here is the procurement plan from the 2018 budget:

In 2019, the TTC changed its T1 fleet plan from replacement to renovation. This pushes any manufacture of new trains further into the future with the Scarborough extension and added trains for the Yonge line in the mid-to-late 2020s. When the TTC Board approved this change, there was no hand-wringing about the potential effect on Thunder Bay’s workload.

Even if the TTC held to its original plan, significant spending on new subway cars would not get underway until 2022.

In all of this, we heard nothing of the Kingston Plant which churns out a car now and then. An obvious question is whether its capacity would be needed if Thunder Bay is idled.

The fundamental problem for Thunder Bay is that Toronto, by itself and with orders from GO Transit, cannot generate enough work to keep the production lines filled.

New Car Reliability

In a small bit of good news, reliability of the Flexity fleet continues to improve. This was reported verbally at the June TTC Board meeting, and the stats are in the July CEO’s report. After the meeting, I chatted with TTC staff about these results and whether this was a one-day-wonder or an improvement that was sustained beyond May 2019. The answer was mixed in that they expect the MDBF value to drop but still be above 20k. With the number of outstanding fixes to be made to the fleet, “reliability” is a moving target. One change is that some conditions, previously considered as faults requiring a car to be pulled out of service, are now treated as fixable at a later time. This reduces the number of faults charged against the MDBF metric.

After years of bumbling along with minimal capacity increases on the surface system, Toronto has finally discovered that its fleet is too small, and there is a desperate backlog to address both capacity and service quality. The problem was obvious to riders for years, but the King Street Pilot drove home what could be done if only we had the will to make transit more attractive.

TTC Updates Flexity/CLRV Replacement Schedule

Over past months there has been some inconsistency in TTC statements about the fate of the “legacy” CLRV and ALRV fleets with conflicting information that

  • some legacy cars would survive into early 2020,
  • all of these cars would be retired by the end of 2019,
  • all of the buses now operating on streetcar routes would be available for bus service improvements in 2020.

It is self-evident that these statements cannot all be true.

The situation is now clarified in two reports on the TTC Board’s Agenda for May 8, 2019.

The CEO’s Report includes the following:

On streetcar services, we’ll address crowding through the continued rollout of new high-capacity, low-floor streetcars. Low-floor vehicles are expected to be on all streetcar routes by early 2020.

Supplementary bus service may be used on some routes during the busiest times.

With the continued delivery of new low-floor streetcars, we are advancing their deployment on more routes.

Currently, the 504 King, 509 Harbourfront, 510 Spadina and 512 St Clair are fully served with low-floor streetcars. We began deploying these streetcars on the 501 Queen in January 2019. We expect that all service on Queen, between Humber Loop and Neville Park Loop will be operated by low-floor streetcars by early summer.

Subsequent routes for streetcar deployment will be: 511 Bathurst (summer 2019), 501 Queen (Long Branch Loop to Humber Loop, fall 2019), 506 Carlton (late 2019), and 505 Dundas (spring 2020). Low-floor streetcar service on Kingston Road will be introduced in 2020 following a review of streetcar services as part of our Five-Year Service Plan. [pp 11-12]

The CEO’s Report now shows the decommissioning plan for all legacy cars in 2019 as “Projected” [p 39].

The 2019-2023 Accessibility Plan includes:

By the end of 2019, the remainder of the order of low-floor streetcars is expected to be received and the TTC plans to retire all high floor streetcars from regular service. [p 27]

The Five-Year Service Plan mentioned above will not be out until December 2019, but with the Capital Investment Plan now showing spending on a further order of streetcars in the mid-2020s, there will be an extended period where expansion of streetcar capacity will be limited to whatever can be provided with supplementary bus service. From King Street, we know that there is a latent demand for better service on the streetcar network, but actually addressing that will be challenging in the current climate.

Crowding is a problem on all parts of the system, but the political focus is on new subway lines that will not address most of these problems, and certainly not in the short-to-medium term. The CEO’s Report now includes a table showing crowding levels, although on a system-wide basis, not for individual routes.

These numbers should be understood in the context of “periods” as defined in TTC schedules. There are five periods through the day:

  • Weekdays: AM Peak / Midday / PM Peak / Early Evening / Late Evening
  • Weekend: Early Morning / Late Morning / Afternoon / Early Evening / Late Evening

The transition points between these periods vary from route to route depending on local demand patterns.

In the chart below, the combination of routes and periods shows that in the first quarter of 2019, 41 bus routes were overcrowded during 82 periods, but this means the combination of one route and one period. With 82 representing only 4.5% of the total, this means that there are over 1,800 possibilities for the bus fleet.

The methodology of counting weekend days individually yields 15 periods overall for most routes. (Some routes do not operate in the Early AM period on the Sunday schedules.) The reason for this is that there is a common schedule for all weekdays, but separate schedules for each of the weekend days. However, this methodology consolidates the majority of the service (weekdays) into only one third of the period count undervaluing the number of riders affected by weekday problems. Moreover, crowding that varies by day-of-week could be masked by averaging over a five-day period.
There also appears to be a mathematical problem for the subway where 7 periods are claimed to be 13.5% of the total. This implies that there are over 50 subway “periods”, but with only 3 lines and 14 periods per line (no early Sunday service), this is impossible (it is unclear where the SRT fits in here). This chart needs work to improve its content.

Reliability of the new Flexity fleet bounced back from a big dip in January 2019, but the mean distance between failures of 13,223 km is still below last year’s performance and less than half of the contracted target. This does not bode well for any move to extend the existing contract with Bombardier.

CLRV reliability continues to track at under 4,000 km MDBF, and the TTC no longer publishes stats for the ALRVs as they have been out of service over the winter. The May schedule plans show a return of five ALRVs to 501 Queen, but this is tentative and the affected runs might simply show up with CLRVs or Flexitys. The CEO’s report notes:

As this legacy fleet is scheduled to be decommissioned by end of this year, maintenance staff will continue to ensure the vehicles are safe to operate in service. However, technical efforts moving forward are being shifted to the new LFLRV fleet and to providing Bombardier with additional assistance. [p 40]

TTC 2019 Fleet and Capacity Plans Part III: The TTC Responds

In the first two installments of this series, I reviewed plans for the subway system and the surface bus and streetcar networks. These reviews triggered many questions which I sent off to the TTC.

We have all been a little pre-occupied with other matters recently, and it took a while for the TTC to reply. Thanks to Stuart Green and the staff at TTC who pulled this together.

Each question is formatted with two or three sections:

  • My original question
  • The TTC’s reply
  • My observations on the reply, if any

The text has been lightly edited for formatting purposes.

Apologies to readers seeing this post with no background. It is based on information in two previous articles as well as a general review of the TTC’s Capital Budget detailed briefing books, known as the “Blue Books”. This article covers a variety of issues some of more interest to general readers than others. If you need clarification, please leave a comment.

Continue reading

TTC 2019 Fleet and Capacity Plans Part II: Streetcars and Buses

Streetcars

There are several related projects in the 2019-2028 Capital Budget and in the 2019-2033 Capital Investment Plan. These include:

  • Completion of the 204 car Flexity order now in progress
  • Purchase of 100 additional cars for growth and expansion
  • Renovation of Russell Carhouse for maintenance of new streetcars
  • Major renovation of Harvey Shops for maintenance of new streetcars, and as the operating carhouse for (at least) 512 St. Clair

Allocation of the New Flexity Streetcar Fleet

As I write this on March 20, 2019, the TTC has received cars 4400-4535 from the Thunder Bay plant and 4572-4573 from Kingston. Of these, prototype 4401 is at Bombardier for production refits, and a pool of four to six cars will be out for major repairs for the next few years.

CEO Rick Leary has stated on a few occasions that the buses now on streetcar routes will come free for service on the bus network by year end when all new cars have arrived, and that all of the legacy CLRV/ALRV (standard sized and two-section articulated cars respectively) will also be retired this year. This directly contradicts his own Capital Investment Plan which shows that buses will still be required into the mid-2020s when, in theory, a further order of 100 streetcars would arrive.

However, even assuming that Bombardier does deliver the last of its order up to car 4603, there will not be enough new cars to cover service on all of the lines. The table below compares service as it existed back in 2006 before the new cars were ordered, the TTC’s plans for Flexity implementation in 2013, the current schedule requirements, and the number of streetcars needed if all routes return to rail operation.

The numbers above are divided into six sets:

  • The 2006 AM peak service requirement for all streetcar routes assuming that there are no construction projects underway. This is a blend of sources to avoid diversions and substitutions.
  • The actual service in March 2019 (current).
  • The streetcar service operated a few years ago on routes that now have full or partial bus operation.
  • A hypothetical March 2019 service assuming that the five routes now with buses (511 Bathurst, etc) were operated using streetcars.
  • The TTC’s June 2013 deployment plan for the new cars.
  • A hypothetical March 2019 service assuming current Flexity service for routes that have already converted such as King, and the 2013 deployment numbers for routes that have not.

For the purpose of this discussion, the ALRV fleet is assumed to have been retired even though, officially, schedules still call for five of them to run on 501 Queen. In practice these, and some CLRV runs, are operating with Flexitys.

The total fleet requirement including spares at 20% would be 216 cars, and this is 12 more than the TTC will actually have without allowing for a half-dozen cars undergoing major repairs. This means that it is impossible to operate the streetcar system without either trimming service or leaving buses on some routes. When there are construction projects that block streetcar service (such as the work by Toronto Water now underway on Dundas), there would be enough cars operate the rest of the network. Otherwise, the most likely candidates for buses are the perennial targets, the Kingston Road services 502/503.

Some routes – King, Spadina and St. Clair – have more service today than the 2013 deployment plan provided, but this means that there are not enough cars to handle the rest of the network as originally planned. Service improvements on the streetcar system are limited to the added capacity that Flexitys will provide on routes still using old cars (e.g. Queen), but there is no headroom from 2020 onward.

Expanding the Fleet

In the 2018 Capital Budget, the TTC planned to acquire 60 more streetcars in 2019-20 for ridership growth, and 15 in 2020-21 for new Waterfront service. In 2019, this has changed to a larger order in the mid-2020s. However, the budget is inconsistent in its presentation of needs and timing.

The chart below is adapted from the fleet plan as it appears in the budget. (The copy I have is in black and white muddying some details depending on colour.) This shows a proposed purchase of 95 cars in 2025-28. It is already out of date because the CLRV and ALRV fleets will be retired sooner than planned. This creates a shortage that prevents full return to streetcar service at the end of 2019 when the Flexity deliveries are supposed to be complete.

Projections out to 2043 show a very substantial increase in the streetcar fleet to almost double the planned fleet in the early 2020s. That’s a lot more streetcar service than we have today. However good this might look, it does not address the challenge that there are not enough cars for the lines and service levels today, and this will not change in the near future.

A few pages later in the budget is a project to purchase 60 new cars which clearly shows the need for 60 cars starting in 2020, with even more in the future. Of particular note is the text about the effect of deferral on service. This project description is obviously out of date, but that is a common problem with the budget.

The actual spending has been moved to 2024-27. It goes without saying that whatever the date, this is an unfunded project.

Adding to the inconsistency is the statement in the 15 year Capital Investment Plan that the TTC would purchase “approximately 100 additional streetcars from 2025 to 2028 to meet demand, at a cost of $510 million”. [p. 54]

A further problem lies in the planned renovation of Russell Carhouse to handle Flexity maintenance similar to the work now underway at Roncesvalles. This will take that site out of operation for two years. Without Russell’s capacity, there would not be enough room to accommodate the extra 60 streetcars if they were procured as originally planned.

The TTC is also considering major changes at Harvey Shops which, as currently configured, can only be used for a small number of Flexitys. The scheme is to revise the layout of tracks and service areas, and to make this an operating site for, at least, the fleet needed on 512 St. Clair. This would very substantially reduce the dead head mileage for 512 St. Clair cars that shifted to Roncesvalles Division from the carhouse at Wychwood, only a short distance north of Hillcrest, in 1978. However, this capacity would not be available until 2028, and the Fleet Plan shown above does not include it. That site would also substantially increase storage capacity on the streetcar system because, in another project, the TTC proposes shifting bus maintenance operations to a new as yet unknown location. This is separate from the construction of another bus garage in the 2020s.

All of this assumes that money will be found to pay for the larger fleet and facility changes needed to accommodate it. In the chart below, all figures are in billions of dollars including inflation. Note that the $370 million for the current 204-car purchase is the remaining money to be spent in years that are part of the Capital Investment Plan, not the total project cost.

The TTC clearly has plans to improve and expand the streetcar system, but there is a deadly combination of constrained capacity growth and rising demand which will not be addressed in the short-to-medium term. That drives potential riders away from transit and adds traffic that streets cannot absorb more demand.

Buses

For many years, growth in bus service has been limited because the TTC has no place to put more buses even if they bought them. This allowed TTC management to avoid the basic issue of how much service was really needed, and budget hawks on Council to avoid increasing TTC subsidies to pay for this.

The chart below is adapted from the fleet plan in the capital budget. The first column shows the fleet makeup before 2014 and then shows the procurements and retirements over the period to 2034.

  • The “Net” column is a check on the arithmetic to ensure that the numbers actually net out. There is an error highlighted in red where the TTC claims it will retire more buses than it actually owns. This has only a small effect on the future fleet size (five out of two thousand buses).
  • There are 200 hybrids and 60 electric buses in the 2019 budget, followed by a pause for one year in 2020 when there will be no purchases. This is partly a result of timing pressure to spend federal PTIF dollars within the required window, and partly to provide an evaluation process for the electric buses.
  • Electric bus purchases will begin in earnest in 2021 with the last of the existing diesel and hybrid fleet being retired by 2033.

The projected service requirements have changed since the 2018 version of the plan, and both versions are shown in the chart. Four planned major events will reduce bus requirements:

  • The Eglinton Crosstown LRT opens in 2021 replacing frequent bus services on several routes.
  • The Finch LRT opens in 2023 replacing bus service west of Keele Street.
  • The Scarborough Subway Extension opens in 2026 shifting the termini of many routes to STC station.
  • The planned expansion of the streetcar fleet in the mid 2020s eliminates the need for buses to supplement/replace streetcar services.

The use of articulated 18m buses will increase by 68 vehicles in 2021 if this plan holds. The next round of artic purchase in 2025-26 will replace the 153 diesel artics now in the fleet, but there are no net additions.

With the shift of the bus fleet to electric operation, the TTC plans to convert its garages at a rate of two per year. However, they have not produced a plan that aligns this conversion with the rate at which electric vehicles will replace diesels and hybrids.

Garage space continues to be an issue. The current capacity across seven garages is 1,631 buses compared to a total fleet of 2,012, a shortfall of 381. Even when McNicoll Garage opens in 2020 adding capacity for 250 buses, there will still be a shortfall with system capacity of only 1,881. A ninth garage to add a further 250 spaces is not planned to open until 2031. That garage, like many projects, sits in the “out years” of the capital plans so that it does not contribute to the shortfall in available funding over the 10-year span of the budget.

This puts the TTC and its would-be customers in a long-standing box when looking at service improvements. For another decade, Toronto will be told that there is no room for more buses beyond the current fleet plans. The planned growth in peak service from 2026 onward is under one per cent per year.

TTC management plans to bring forward a service plan later in 2019 which will examine future demand. A vital part of such a report will be to look not just at minimal ridership and fleet growth, but to consider what happens if service improves at a substantial rate. Oddly, there is provision for this in the streetcar fleet plan, but not in the bus plan.

The 15-year Capital Improvement Plan includes construction of a collision centre and heavy overhaul facility for the bus fleet. This would release space now used at Hillcrest allowing it to be repurposed as a new streetcar shops and depot. The engine shops now at Hillcrest would become obsolete with the migration to an all-electric bus fleet.