The City of Toronto has released its detailed mobility plan for the coming FIFA World Cup matches in June-July.
The document is over 100 pages long, although some of that is background on the city’s existing transportation infrastructure. In this article, I will primarily review the transit component and leave other topics to interested readers.
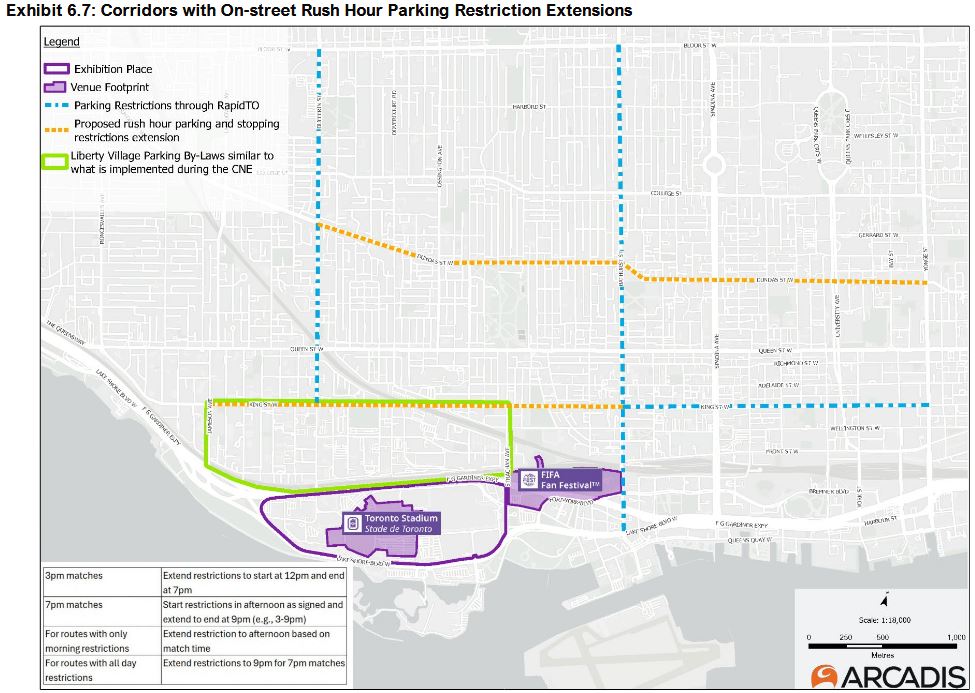
The World Cup matches will occur on June 12, 17, 20, 23, 26 and July 2. The June 12 and 26 games kick off at 3:00pm, June 20 at 4:00pm and the other at 7:00pm. From 5 hours before to 3 hours after each game there will be extensive constraints on the area around Exhibition Place, and transit will be the primary mode of access.
Road Restrictions
Parking on some arterials that now only exists during peak periods will be extended to improve road capacity.
Transit Access
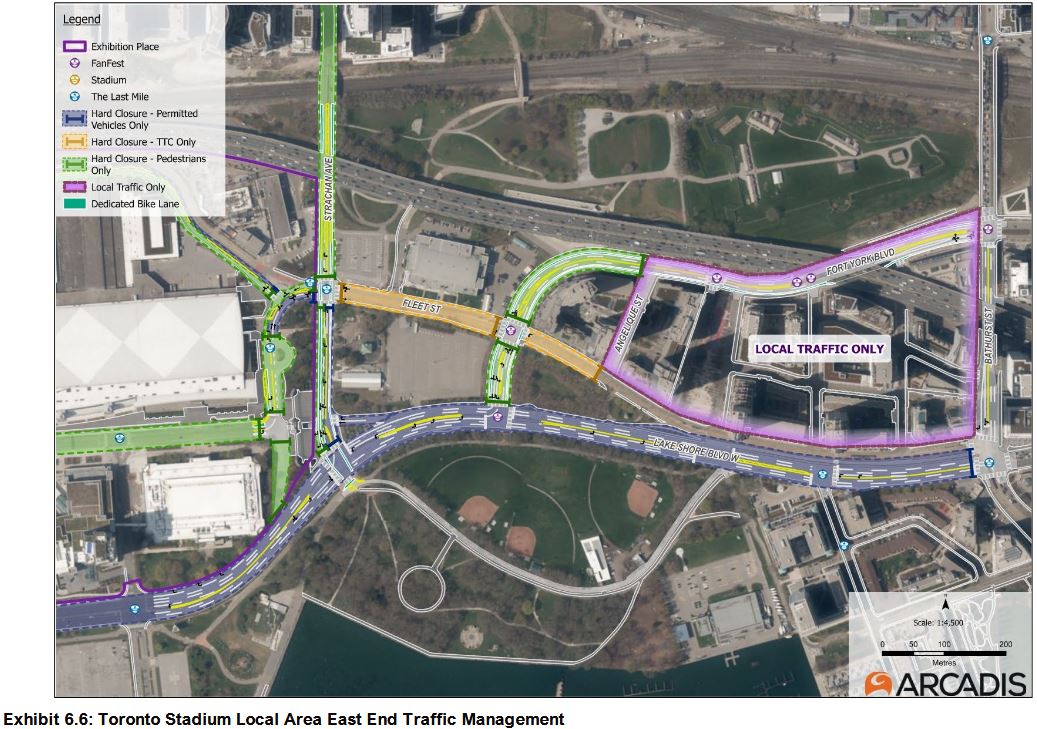
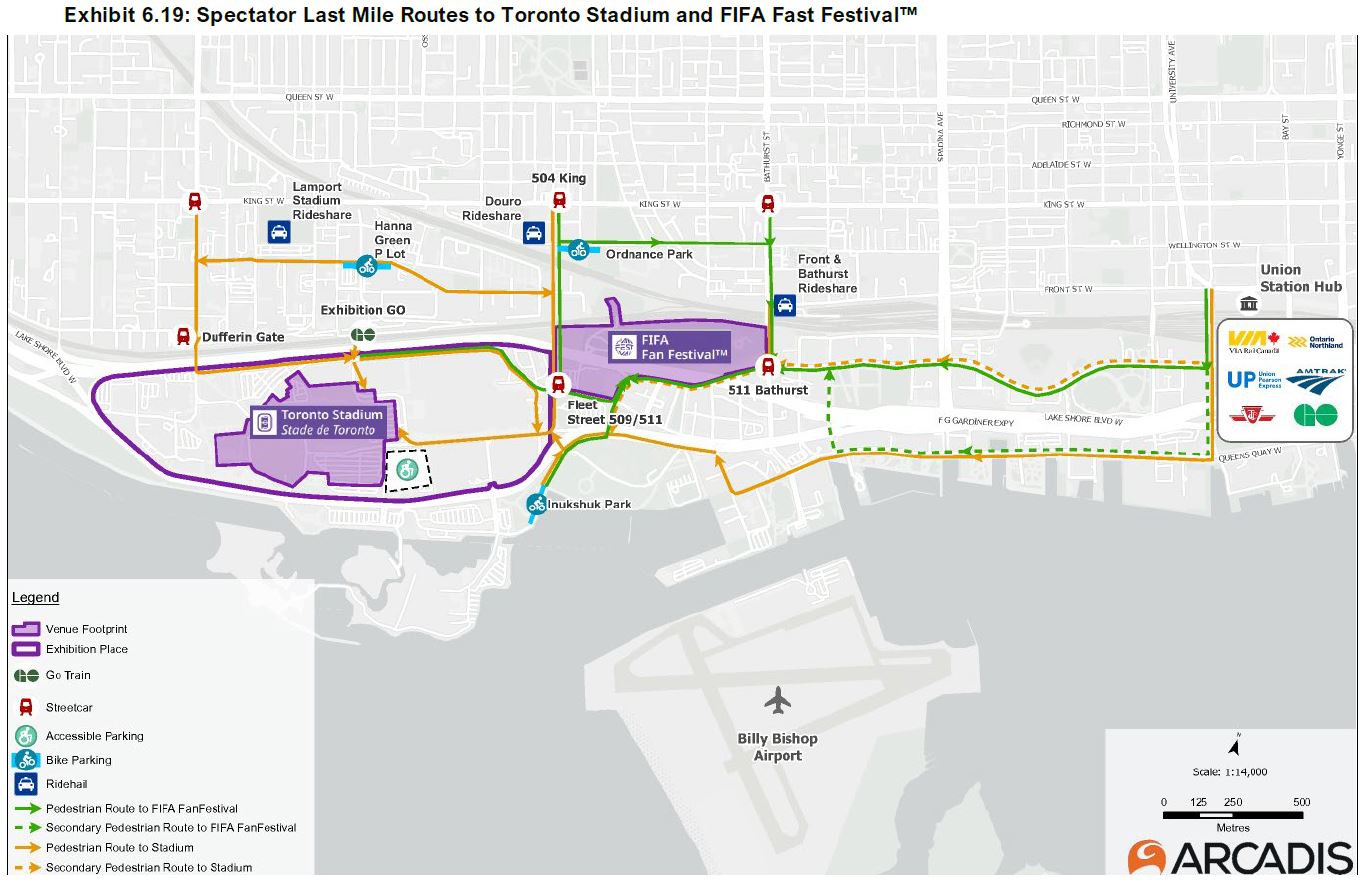
The area east of Exhibition Place will serve as a transit hub on Fleet Street plus the Fan Fest area at Fort York and The Bentway (under the Gardiner Expressway). The primary access for 509 Harbourfront and 511 Bathurst streetcars will be on Fleet between Strachan and Fort York Boulevard (orange in the map below). Exhibition Loop will be used only by riders requiring deployment of an access ramp. Transit stops at Bathurst & Fleet will be removed from service.
The projected mode shares both to the stadium and to the Fan Fest area are:
Transit (TTC+GO): 70%
Active Transportation: 13%
Taxi/Rideshare: 10%
Auto (self driven): 7%
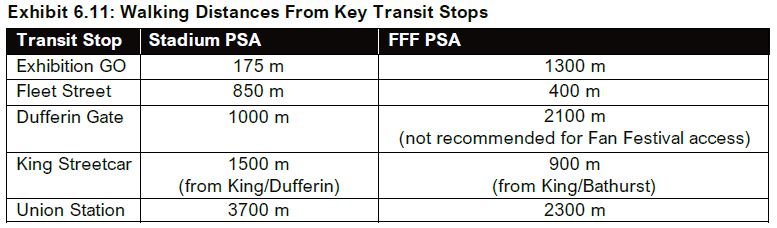
The GO Transit share is expected to be lower for the FanFest area because it is further from Exhibition GO station.
The plan is inconsistent about the number of attendees to be served. This will affect the total transit demand and the need for extra service on game days.
Stadium
Fan Fest Area
Capacity
45,000
20,000
Planned attendance
36,000
25,000
Transit service is expected to accommodate arrivals and departures with the following profiles:
Arrivals
3 hours before: 20%
2 hours before: 50%
1 hour before: 30%
Departures
1 hour after: 70%
2 hours after: 25%
3 hours after: 5%
With an expanded stadium, the Fan Fest and limitations on parking, transit will carry far more people than it does today especially during the after event surge.
TTC service will be provided on various routes taking advantage of reserved lanes.
29/929 Dufferin bus service to Dufferin Loop
509 Harbourfront streetcar service from Union Station to Exhibition Loop
511 Bathurst express streetcar service from Bathurst Station to Exhibition Loop. Buses will run in parallel for local trips.
504 King will have extra service with riders expected to walk south to the stadium or Fan Fest. 504 cars will not use Dufferin Loop to maximize capacity for the 29/929 Dufferin bus.
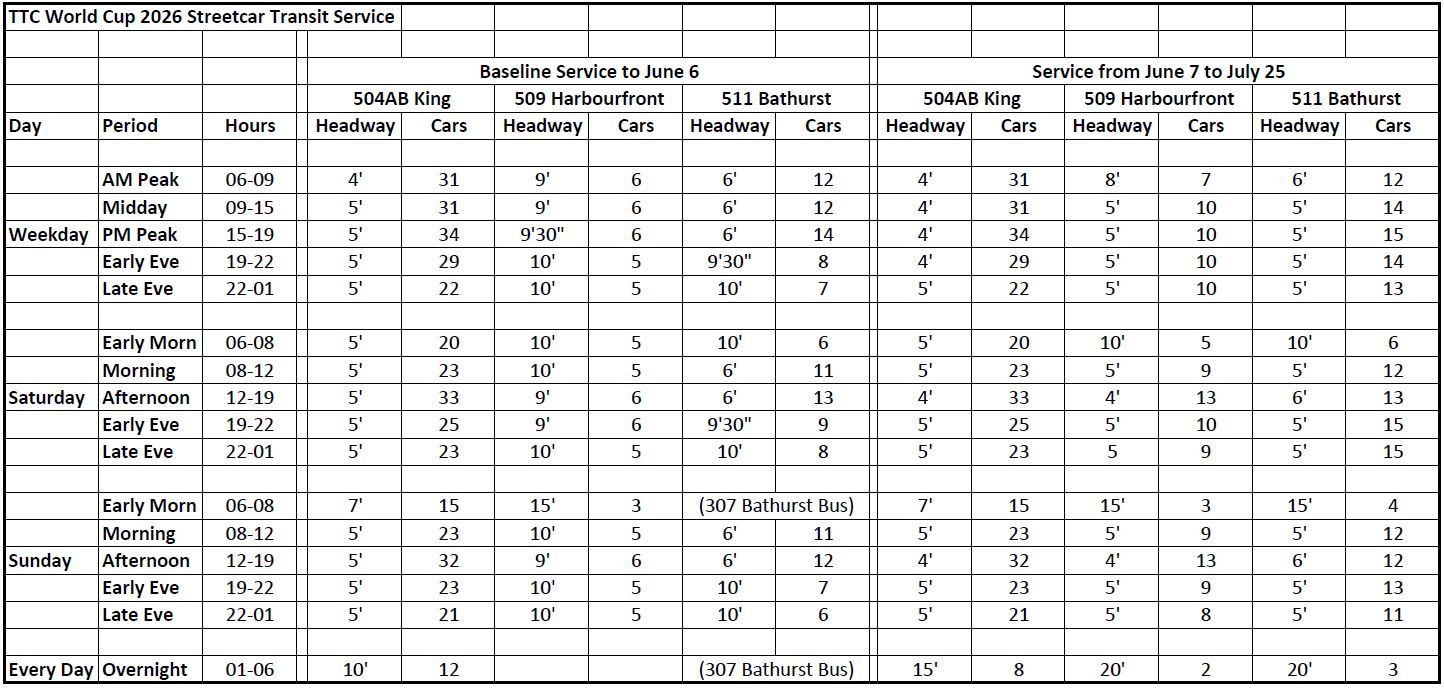
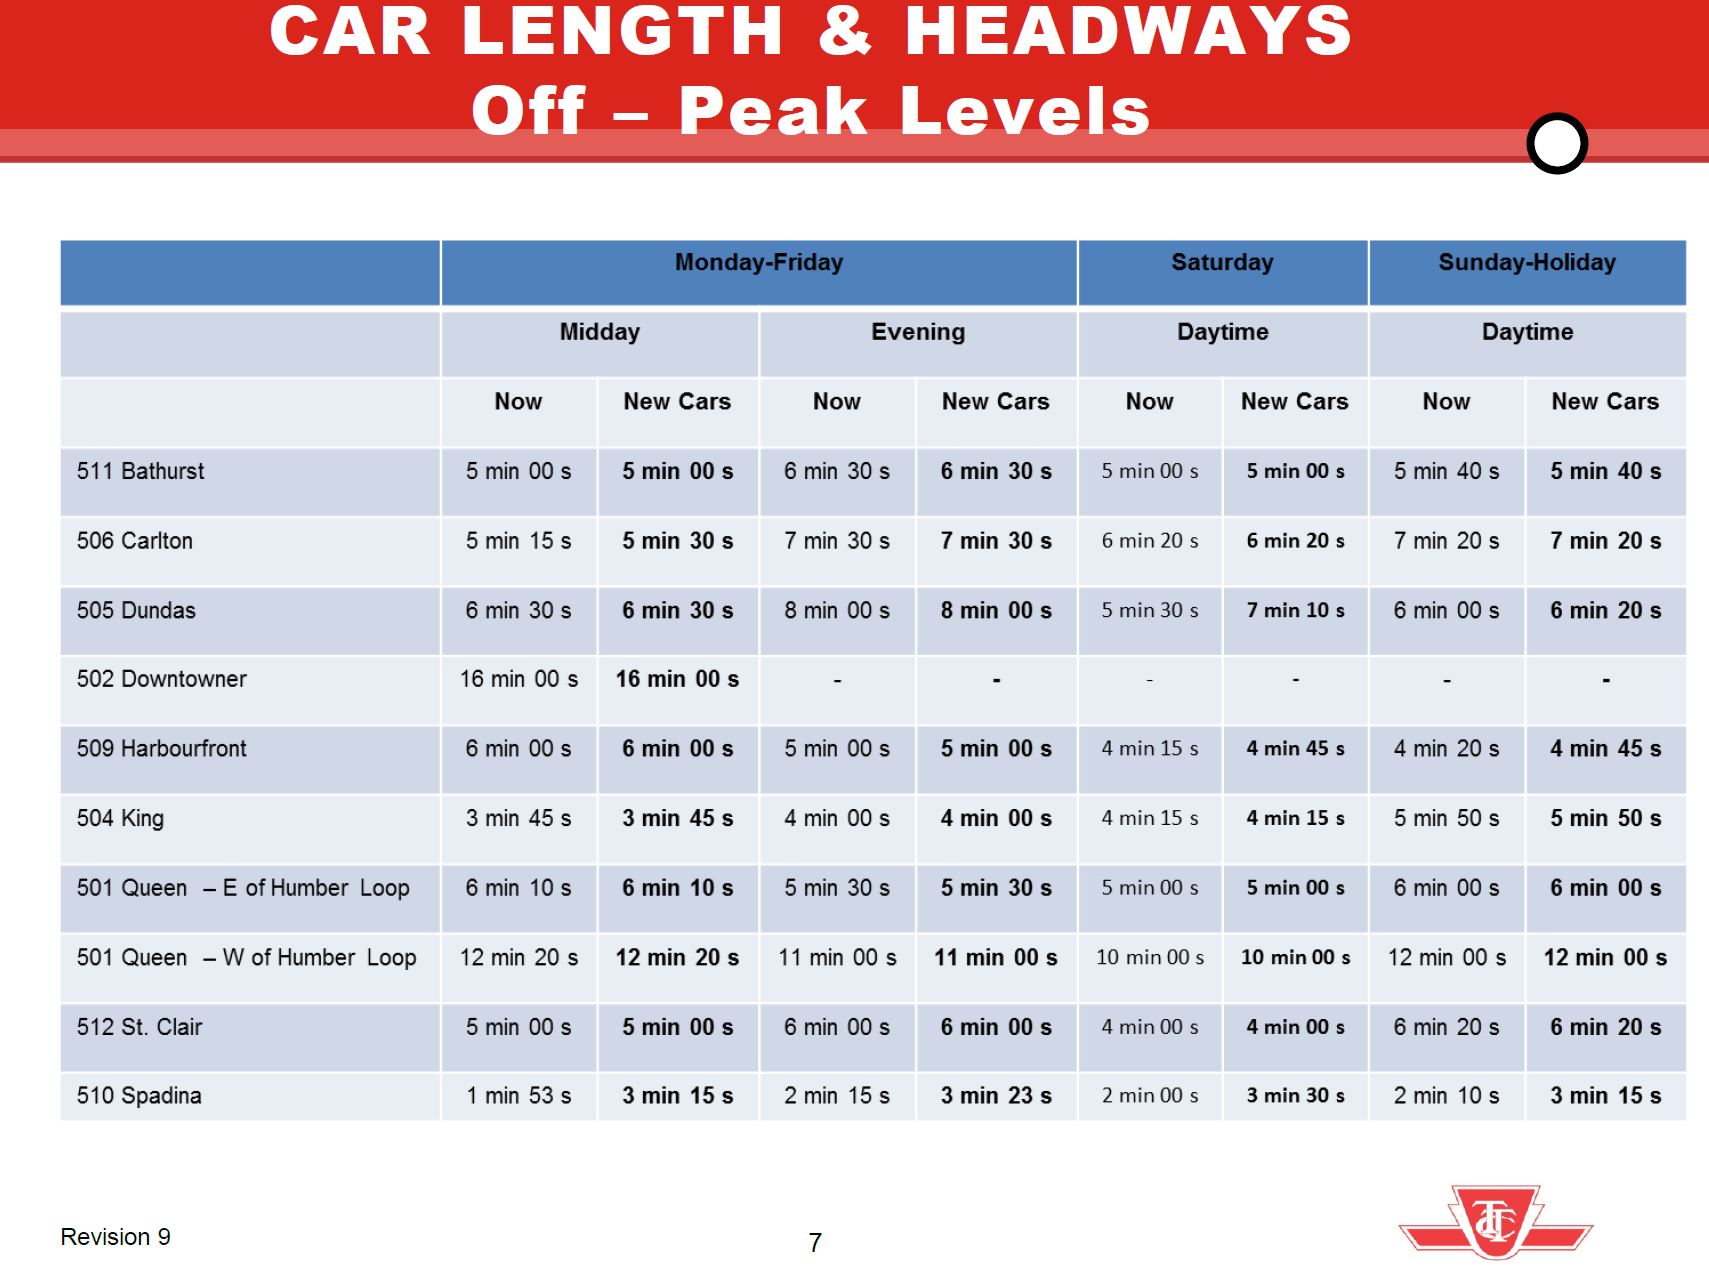
The scheduled streetcar services will be improved beyond what is normally provided. Additional service will operate on game days. The values below are from the Mobility Plan and have not yet been confirmed by the TTC.
Adapted from Exhibit 6.8 at p. 60 of the Mobility Plan
Specific service levels for 29/929 Dufferin are not shown beyond saying that there will be “enhanced” service plus match day express shuttles.
GO Transit will operate a 15 minute service on the Lake Shore corridor with extra trains possibly down to a 10 minute headway before and after matches. Their service is constrained by infrastructure including train spacing on the corridor and the combined service through Union Station. GO passengers arriving from other corridors face either a transfer to/from Lake Shore trains, a long walk from Union to Exhibition Place, or the limited capacity of the Harbourfront streetcar link notably the small loop and loading area at Union.
Taxis, Ride Share and Cycling
Access by taxis, ride sharing and cycling will, like all other traffic, not be allowed within the stadium or Fan Fest restricted zones. Three taxi/ride share drop off and pick up points will be created at Lamport Stadium, south of King at Strachan & Douro, and at Front & Bathurst.
Bike parking, including Bike Share terminals, will be at the Hanna & Liberty Green P lot, Ordnance Park east of Strachan, and at Inukshuk Park on the waterfront.
One challenge for cyclists is that there are areas with potential conflicts between large volumes of pedestrians and cyclists. “Walk your bike” will be the expected behaviour.
In the map below, a streetcar symbol is shown at Dufferin Gate, but the 504 streetcars will not actually go there, only the 29/929 Dufferin bus services.
Fare Payment
Fare payment will be via the PRESTO system at the standard rates including the GO/TTC integration. However, a limited time regional pass might be available.
A proposed new Regional Tourism Transit Pass pilot, subject to successful technology testing in early 2026, will provide visitors with an integrated and convenient means of payment across multiple transit systems while travelling throughout the GTHA. The PRESTO-enabled pass will offer unlimited travel on GO Transit, UP Express, and the TTC for 3-or 5-day periods. Modeled on established programs in global cities such as Paris and London, the initiative is intended to enhance the visitor experience, reduce transportation barriers, and support broader regional exploration. [p. 63]
The Rest of Downtown
Not mentioned in detail in the plan will be the effect of added travel demand and road closures both on traffic conditions and transit service in the central city. Past experience has shown that traffic control during events and in response to construction tends to focus on the immediate area, but locations further afield can be badly affected.
Not only does this snarl traffic, but transit service passing through affected areas deteriorates or vanishes affecting riders far from the event. Personally, I will completely avoid affected areas on game days, but many people do not have this flexibility.
Toronto talks a good line about transit priority, but does not always deploy the resources needed to provide it and to enforce restrictions on motorists’ behaviour. The FIFA games will be a major test in telling motorists that they are not in command of streets.
The TTC’s Strategic Planning Committee will meet on March 31, 2026 at 9:30am in the boardroom at TTC headquarters, 1900 Yonge Street. There are three items on the agenda. Two of them deal with financial plans, and I will turn to them in a separate article. The third is an updated Ridership Growth Strategy, although it is really a rehash of current plans with little attention to actually achieving growth.
Previous iterations of the RGS, especially the original in 2003, were built on the premise of showing what actions to gain riders might be possible and at what cost. This is repeated in the current report, but with no new initiatives beyond those already in the TTC’s Five Year Plan.
The report begins by noting that ridership growth has stagnated and sits at a level well below pre-pandemic figures. Travel declined generally in Toronto from 2024 to 2025, and the change (-3.1%) lies in the middle of the range of declines seen by TTC in various periods. The report notes:
The shift in ridership and customer boarding patterns suggests that the surface network is serving fewer long-distance bus riders, discretionary trips, and shift workers at manufacturing and warehousing areas, as well as work commutes to businesses in the educational services, administrative and support, real estate and rental and leasing, and retail trade sectors.
Overall, the decline in surface boardings is system-wide and not tied to particular corridors, though outer parts of the city are most affected with boarding losses strongest in suburban and outer urban areas.
[…] the most significant opportunity for ridership growth comes not from creating new travel where it no longer exists, but from ensuring the TTC is the most attractive, reliable and competitive option for the trips people are still making. [Report at pp 1-2]
Comparison to 2019
Ridership
80% to 83%
Revenue
92%
Expenses
137%
Cost Recovery
Down from 65-70% to 46%
Ridership decline since February 2025
Midday and evening
4% to 6%
Peak periods
1%
Weekends
4% to 7%
Toronto Travel by All Modes
Q4 2024
6.6 million trips
Q4 2025
6.4 million trips
The decline in offpeak travel is troubling because this segment showed stronger growth while the peak period recovery was hampered by changes in work and commuter patterns.
The perception of transit as an option is declining, but this is a refreshing, if not welcome, view of customer satisfaction stats. In past reports, TTC tended to pump every increase in values, no matter how small, without considering the overall trend as context.
Customer satisfaction declined in 2025 and is lower among priority groups: Gen Z, shift workers, women and customers with low income. Customers generally feel safe on the TTC, with 89% of customers reporting they feel safe on vehicles and 77% at stops, though there is room to improve. [p. 3]
The TTC recognizes the need to be more attractive to existing and would-be riders, but the challenge is how this could be achieved.
By improving speed, safety, affordability and making the experience seamless, the TTC can divert trips from other modes, most notably private vehicles and rideshare, and increase its overall mode share while retaining our existing customers. In a constrained travel market, growth depends on being the better choice: making transit the mode people prefer when they do need to travel and capturing a larger share of trips across all segments. [pp 3-4]
“Affordable, Fast, Safe and Seamless” are the plan’s four focus areas. Unfortunately, the detailed descriptions leave key questions unanswered.
What is “affordable”? The report notes that riders care more about speed than “minor” fare changes, but what are the implications for fare and revenue growth? Are fares frozen forever or will they start to rise to cover part of transit’s growing cost?
“Speed is not a luxury feature, it is a core performance requirement. Makes Transit Competitive with Driving. Travel time is the top factor in mode choice.” These statements imply an attempt to compete with auto speeds using transit, but this is simply not possible especially when access and waiting times, not just in-vehicle travel, are considered.
The Safety bullet concentrates on perceived and actual safety and security for passengers, a factor that depends not just on the TTC but a wider group of social agencies and policies to address a variety of economic and mental health issues.
The Seamless bullet talks about access to trip planning information, a positive experience on vehicles and in stations, and “confidence that they can predict and complete their trip”. This is not just a question of a better website or new ways to access information, but that transit operations reliably provide the advertised service. The Plan is utterly silent on the need for better service management and standards.
Long range strategic planning is not a common sight at the TTC. Yes, we see maps, we see service plans, we even have some nominally “bold” projects like RapidTO’s red lanes. But what we do not see is a focused debate about where Toronto and its transit system should be going, and how we will get there.
Pre-pandemic, the system was bulging with riders. Among other things, this launched the Bloor-Yonge station expansion project and deferred the Richmond Hill subway extension until we could be sure of having capacity to handle new riders from York Region.
Things changed in the early 20s with widespread ridership loss, especially downtown commuters. GO Transit was hit hard by this thanks to their long-standing commuter driven business model. On the TTC, although commuter traffic remains below 2019 levels, weekend demand has built higher. Demand does exist, although not always on the old model, but provided that there is service to handle the rides.
Since 2020, the overwhelming question has been where the money will come from to keep service running. A mixture of provincial and federal contributions got us through the worst of those years, and some special provincial subsidies still flow. The dollar value of the City’s share roughly doubled from 2019 (actual) to 2026 (budget) with the City now paying 49% of total operating costs (including WheelTrans). The Provincial share in 2026 is about 9% of the total of which about 3% is from gas tax and the rest from special subsidies which will soon end unless they are renegotiated.
Fare freezes under both the Tory and Chow administrations coupled with lost ridership limited revenue growth. Because fares now make up a much lower proportion of total revenue, a large fare increase would be required to restore the historic fares:subsidy ratio if that were the target.
The Capital Budget has an even worse situation with a long list of unfunded projects and no clear indication how much the Provincial or Federal governments have any appetite to fund them. In the short to medium term, the substantial Provincial spending will go to works in progress including Toronto subways and GO expansion.
With all of the focus on just finding money to keep the lights on, there has been little attention to service beyond preserving as much as can be afforded. TTC claims of service recovery use a metric, service hours, that appears to show recovery to 2019 levels, but does not allow for the effects of congestion. Actual service frequencies are down on many lines.
Back in 2018, the Ridership Growth Strategy proposed a tiered set of changes to drive growth at 1%, 2% or 5% annually. This was not pursued in any detail, and the pandemic overtook any thoughts of aggressive growth. The RGS was replaced by the Five Year Service Plan which, in its current version, covers years 2024-2028. It aims at modest growth, and yet even those goals are not fully funded.
What is needed to drive growth beyond business as usual levels? Is there a latent, unserved market for travel because transit is too inconvenient or simply not serving trips people need to make? Where is this market? Does the current network serve it well? Some growth can be achieved by making transit easier to use by existing riders, but what is needed for net new travel made by choice, not necessity?
Within this gloomy setting, the question of “where are we going” can turn into debates about funding without much thought to what might be possible, or what will be needed to encourage annual growth well above a few percent.
TTC’s Strategic Planning Committee meets on March 31. This will be their last chance to launch any discussion and study that can affect the 2027 budget cycle, and provide the basis for any post-election discussion of transit policy for 2028 and beyond.
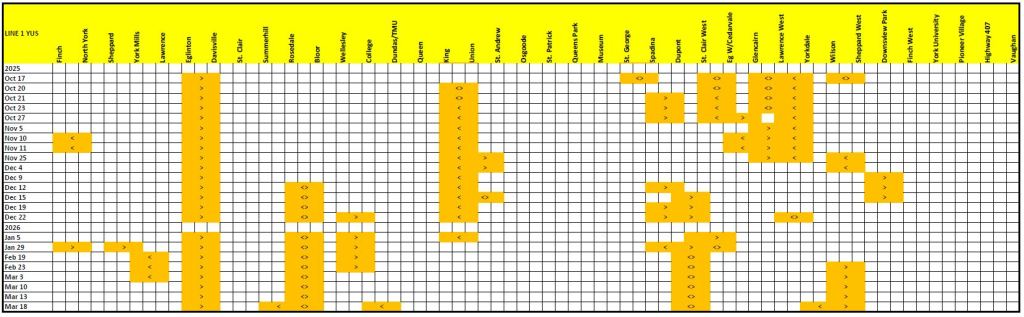
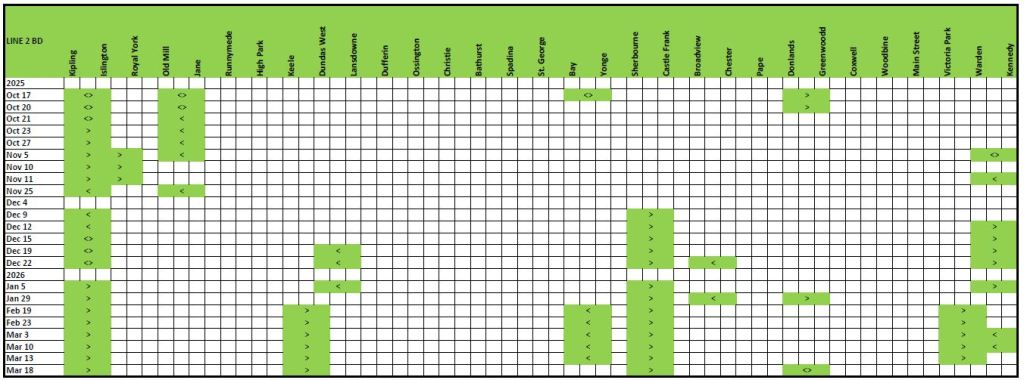
This post continues previous reviews of the map and lists of reduced speed zones (RSZ) on the TTC subway with snapshots of the status of Lines 1 and 2 from mid-October 2025 to mid-March 2026.
The charts below are adapted from maps that are updated regularly on the TTC’s Reduced Speed Zone page.
The total number of zones sits persistently at about a dozen. Although some disappear fairly quickly, others replace them. Some are long-standing zones that are more challenging to repair in winter weather.
In the coloured boxes, the arrows indicate the affected direction of travel with “<>” meaning both ways.
The TTC is working hard, I understand, to get the system in the best shape possible for the World Cup events from mid June to early July. Whether they will achieve this remains to be seen.
One issue is the timing of the usual Spring system inspection of rail condition and track geometry. Will the results of this inform current slow orders, or will this be carefully “parked” so that new slow orders do not appear until after the big event?
The current orders have target repair dates in March and April, with 4 of 14 showing “TBA” I will return to this topic in early June.
Updated March 20, 2026: Following the “more” break are comparisons of the detailed explanation of RSZs in effect at the start of this period (Oct 17) and end (Mar 18).
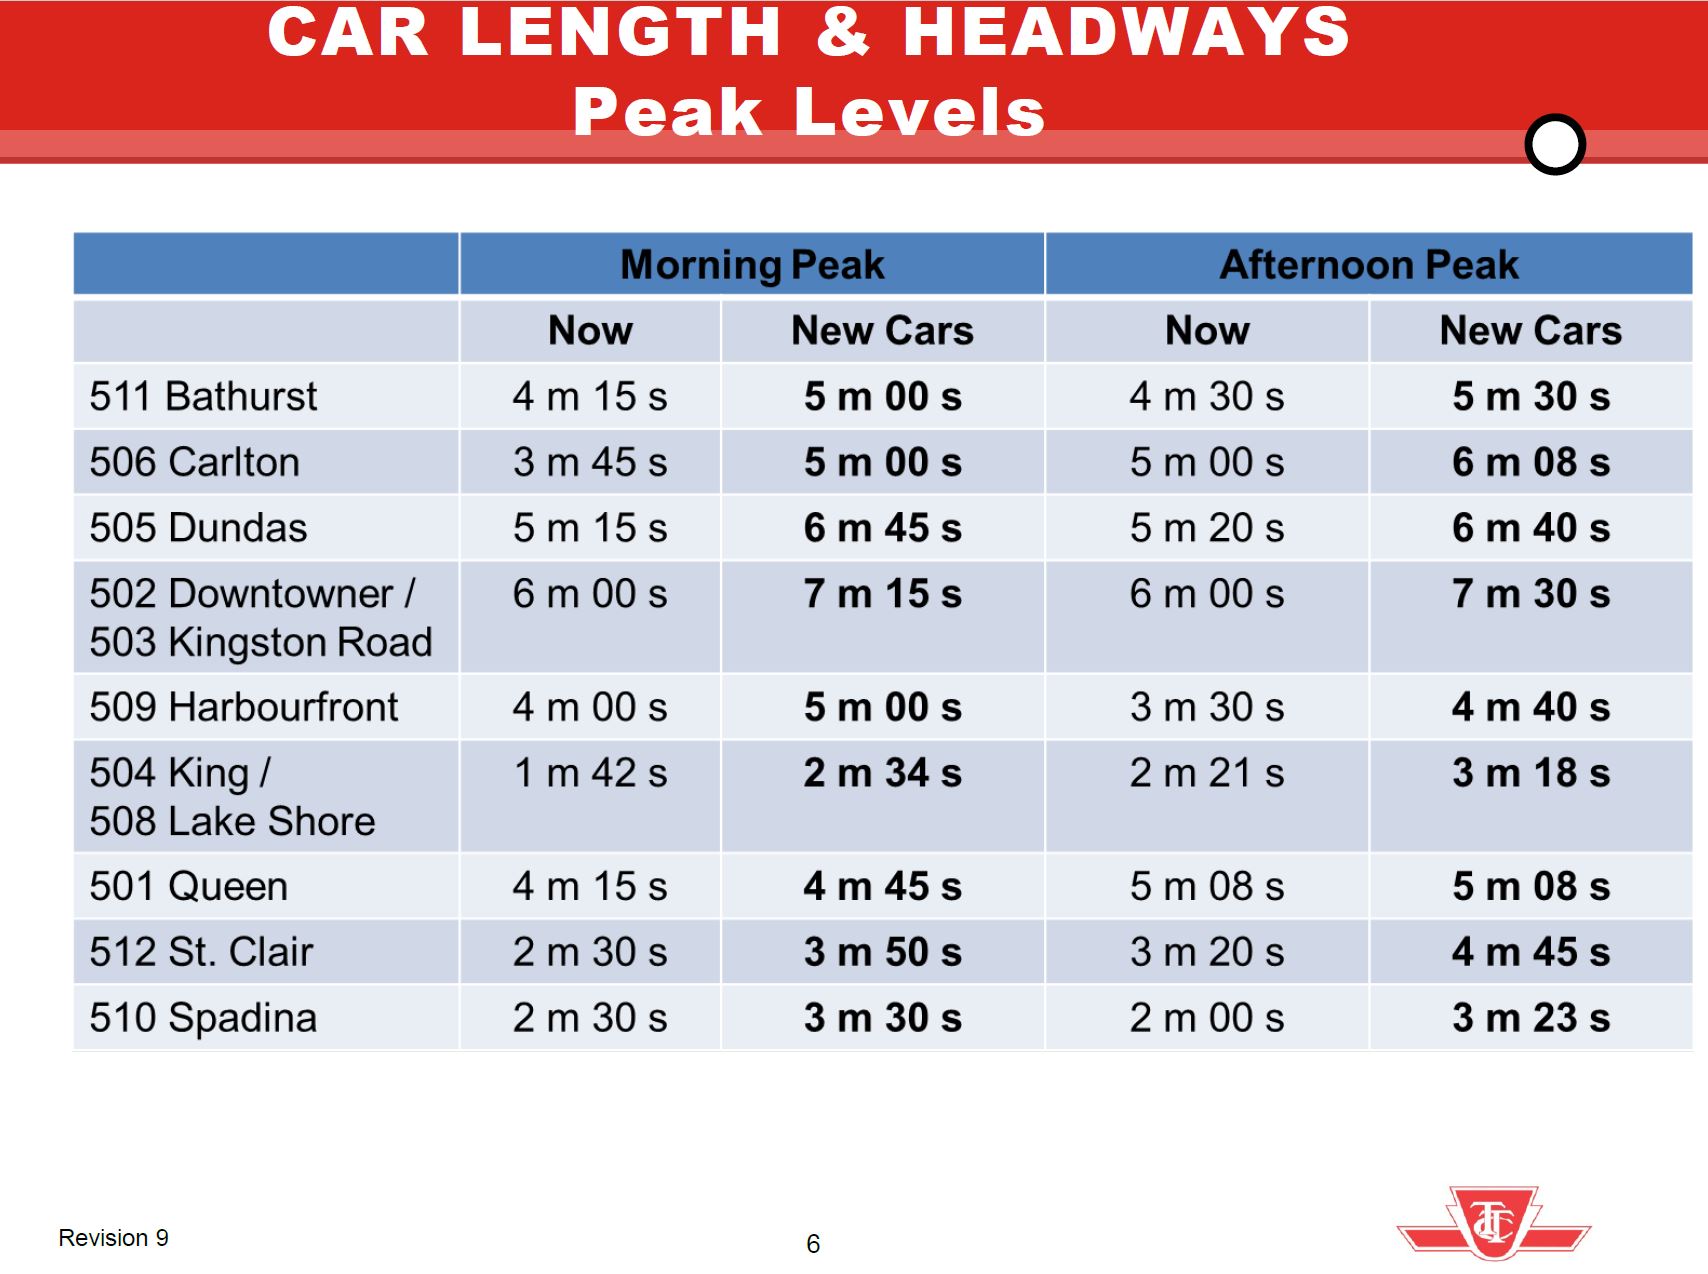
Readers with long memories might recall the early days of plans for a new streetcar order including discussions about how large a vehicle should be purchased. A major concern at the time was the possibility that the TTC would change schedules and run less frequent service with the larger cars just as they had when the articulated version of the CLRV (the previous generation of cars) arrived in the late 1980s.
That concern was softened by a TTC claim that service would actually improve. Peak periods would see slightly less frequent service, but a net increase in capacity, while off-peak periods would see little change in frequency effectively doubling the capacity of service. At the time, crowding was a big issue and this persisted right up to the pandemic in 2020, by which time all of the old cars had been retired. The management proposal was approved in July 2013.
As the CLRV/ALRV fleet aged, there were problems with reliability of older cars and the need to operate buses on some lines thanks to a shortage of working vehicles. Some repairs were done at considerable cost, but these were more cosmetic than a true life extension.
Moving forward to 2026, there has been a lot of talk of restoring pre-pandemic service levels. TTC fudges the numbers on this in many cases citing vehicle hours operated, not actual service frequencies which have been degraded by longer travel times.
(For example, if a round trip, including terminal layovers, takes two hours or 120 minutes, then 20 cars will provide a 6-minute service. If the round trip gets longer but no cars are added, the service is less frequent, but the number of vehicle hours stays the same. From a rider’s point of view, service is worse, but from a budget outlook, there is no change. This is at the heart of the discrepancy between TTC service claims and rider experience.)
After years of changing service levels and demand, the TTC’s Five Year Plan foresees a return to six minute headways, at most, as a new standard for daytime service. This has been rolled out on some routes over the past year, but not all.
Already at 6 minutes or better: 504 King, 510 Spadina
Improved to 6 minutes: 512 St. Clair (Sept/25), 511 Bathurst (Nov/25), 505 Dundas (Nov/25)
Pending, but with no committed date: 501 Queen, 503 Kingston Road, 506 Carlton, 507 Long Branch.
The Five Year Plan (at p. 4) includes provision for extra spending in 2027 and 2028, but this is not tied to specific routes. There is nothing in the Plan for 2026.
A related issue is the size of the streetcar fleet. Leading up to 2020, the issue was how many cars were actually available, and some service cuts flowed directly from this. With the recent delivery of 60 additional cars, fleet availability should not be an issue although service can still be limited by a lack of operators. The TTC currently schedules 163 cars at peak out of a fleet of 264. If services now operating with buses due to construction were also using streetcars (503 Kingston Road and the Broadview branch of 504 King), the peak requirement would rise to 178. Allowing for maintenance spares this would drive the total requirement to 214 leaving 42 surplus for service improvements (allowing for 8 spares).
February 2026 Schedule PM Peak
Full Streetcar Service
Possible Service
Peak Requirement
163
178
220
Spares at 20%
33
36
44
Total Requirement
196
214
264
Fleet
264
264
264
Surplus
68
50
0
The problem, of course, is that the TTC barely has budget headroom to operate existing services let alone increases.
In theory, some of the surplus cars will eventually operate the Waterfront East LRT extension, but that service is at least 8 years away even assuming Toronto finds the money to build it. In any event this will not require anywhere near all of the current surplus fleet. Another issue is that the “streetcar network” has not operated with 100% streetcar service for a few decades thanks to various construction projects and vehicle shortages.
There are parallel issues with the bus network, but they are complicated by issues of vehicle reliability and the need for a spare pool to cover the unreliable LRT service primarily on Line 6 Finch West. I will turn to the bus fleet in a separate article.
Back in 2013, the TTC proposed how it would operate with the new streetcar fleet. During peak periods, headways would widen particularly where existing service was very frequent. Notably on 501 Queen, there would only be a slight widening of the time between cars in the AM peak and no change in the PM peak. This reflected the fact that Queen was already running with the 75-foot long ALRVs and needed more capacity.
In the off peak, most routes would see no change in service level except for 510 Spadina due to its already frequent service of 50-foot CLRVs that could not be sustained at terminals with the larger new cars.
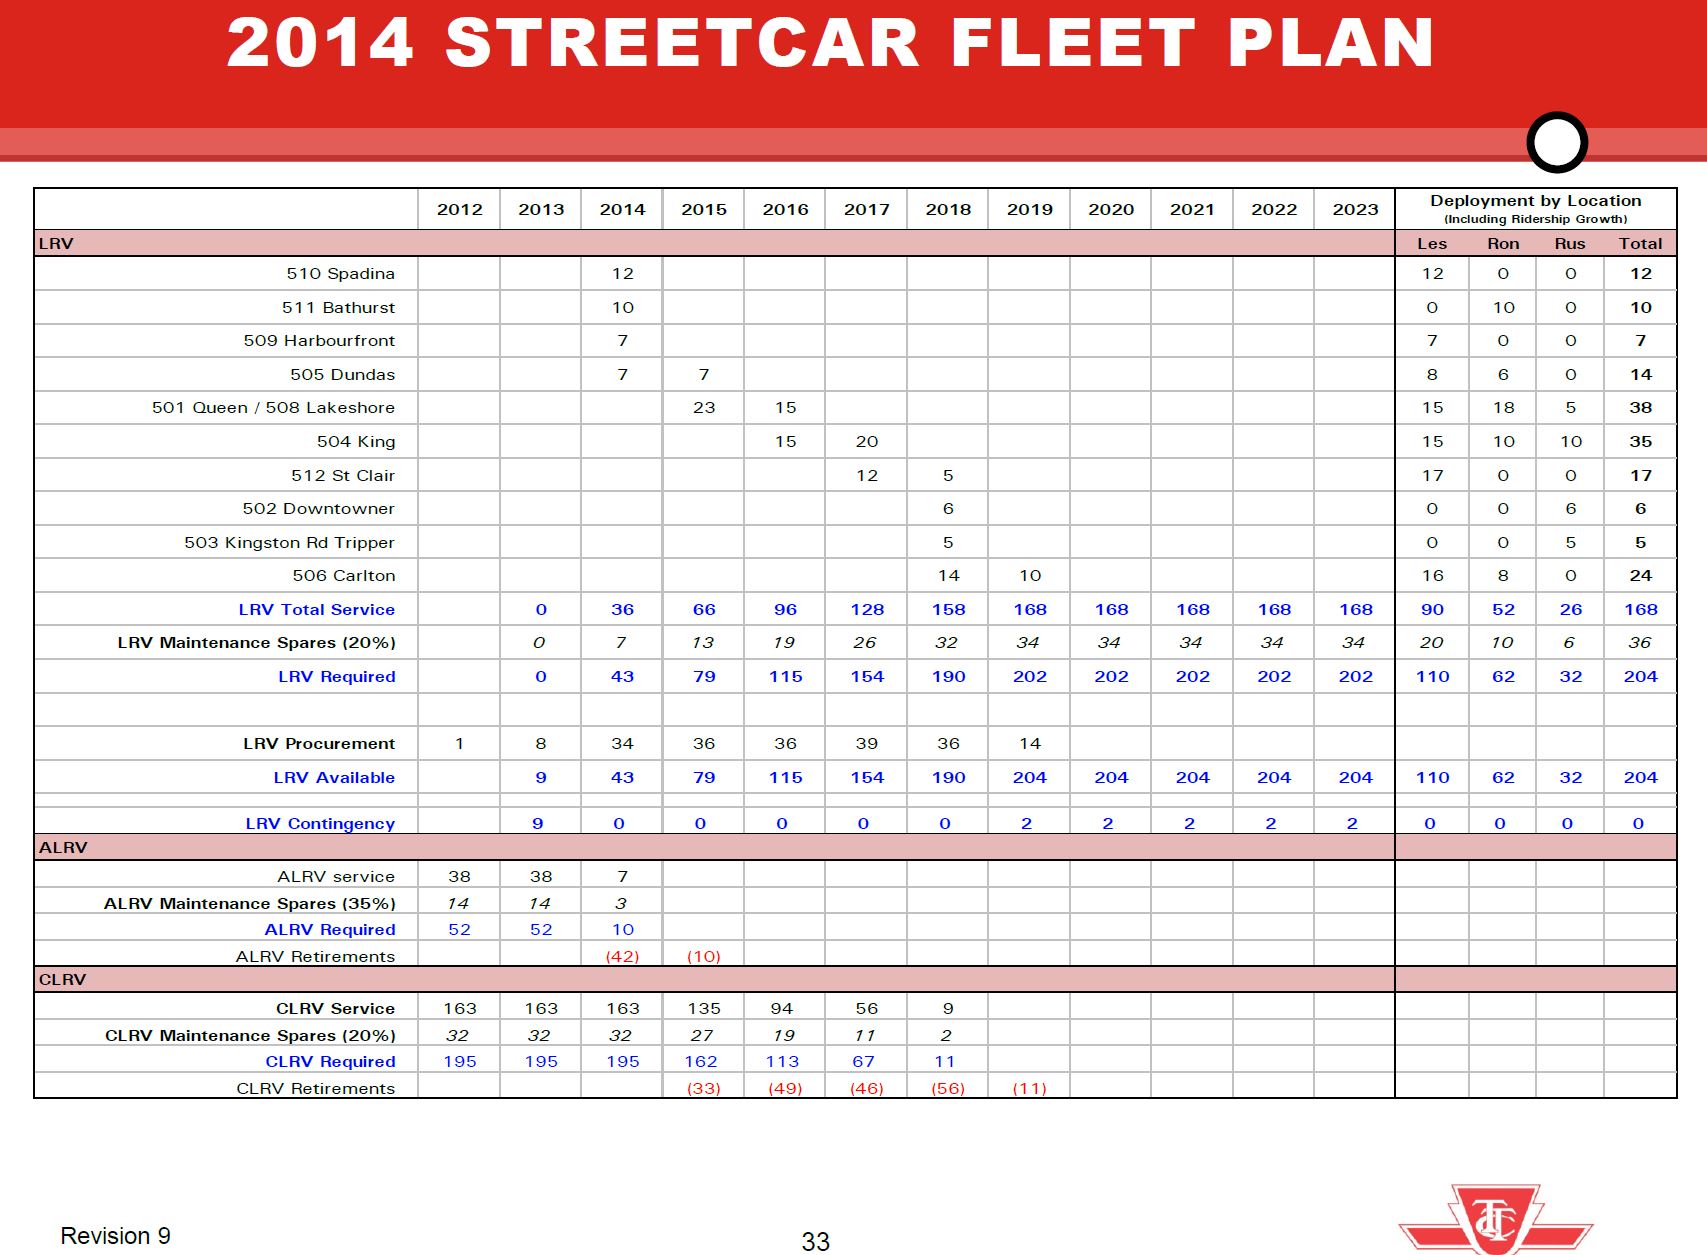
The overall fleet plan showed a buildup to a peak requirement of 168 cars plus 20% spares.
This plan gave a bright future for streetcar service and capacity growth, but things did not work out that way. Service today is generally lower than originally projected for the new fleet, and part of this reduction is due to slower operating speeds and greater provision for terminal recovery time even on routes with reserved lanes.
A related question is the effect that less frequent service has had on ridership. There is a post-pandemic slump on the streetcar system in part due to work-from-home for office jobs and remote learning for post-secondary students. However, even allowing for the pandemic era drop, the problem remains in attracting riders back to transit when streetcars are less frequent and slower, compounded by chronic problems with service reliability. Charts tracking streetcar ridership from 1976 to 2024, the last year published by TTC, are at the end of the article.
These routes are in the part of Toronto where transit riders should be easy to win, but a long decline in service frequency discourages those who have the option to use another mode including private autos, ride hailing or cycling. Service cuts during economic downturns do not magically get reversed as times improve, and ridership that might be wooed back to transit instead faces less reliable service and a political attitude that favours big spending on subway projects, not surface transit.
The remainder of this article looks at each route in detail to see how the actual service changed from the 2014 plan through the 2020s to today comparing:
The 2014 headways for AM Peak, Midday and PM Peak in the management proposal.
The proposed headways after routes converted to Flexity streetcars.
The actual scheduled service in January 2014, January 2020 (just before the pandemic) and February 2026. Driving times are shown separate from terminal recovery times to illustrate how each component has evolved.
Quite notable on many routes is the growth in both scheduled driving and terminal times. Although it is common in the mid-2020s to regard extended travel times and traffic delays as a recent, post-pandemic phenomenon, this pattern started earlier and is evident in 2014:2020 comparisons. Surplus time, it was argued, would prevent short turns, a claim that is demonstrably false as most riders know on a daily basis, but it slows service, wastes resources and forces wider headways.
The TTC’s Audit & Risk Management Committee will meet in the Boardroom at TTC Headquarters, 1900 Yonge Street, on Wednesday, March 11 at 9:30am. Two items on the agenda are of considerable interest:
The review of customer performance, metrics and real-time information covers at length the many problems with passenger information from the TTC including its website and various outlets for notices including social media and apps. This is an unusually candid review and long overdue.
Also included are charts showing the status of various recommendations from TTC and City audits, as well as from outside reviews. However, these are only summaries and there is no link back to source documents to cross-reference specific items, their severity and status.
Two confidential attachments address “The Subway Tunnel Maintenance and Rehabilitation Audit” as well as some findings from the UITP review.
Updated March 11 at 12:45pm:
Much of the meeting was conducted in camera. In the public session, a few concerns arose from the Committee:
There is a large and growing list of outstanding recommendations from both TTC Internal Audit and the City Auditor General, and the Committee was concerned about how, especially, high priority issues are tracked especially when they fall behind previously-promised due dates.
Although there was brief discussion of the issues of public facing information and performance metrics, the primary comments had the sense that finally problems are recognized, but without debate on specifics.
With respect to overtime, the Auditor will concentrate on exceptional cases where payments exceed expectations. Future reports will break down overtime by cause for clarity, e.g. planned work, weather related, special events, etc.
The TTC Board will meet on Tuesday, February 3, 2026 at 9:30am in North York Council Chamber. The agenda is rather thin, and there are several confidential issues that will trigger an in camera session. There is no formal item regarding Line 5 Eglinton, although one never knows what might come up in debate.
Of interest are the following items:
Updated February 2 at 10:10am: Slide decks for the invited presentations have been posted on the TTC site. Links to them are added below.
Narayan Donaldson on “Opportunities to improve Transit Signal Priority in Toronto”. According to the covering report “This presentation will discuss the strengths and weaknesses of the Transit Signal Priority (TSP) system used on Toronto’s streetcar, bus and LRT systems, compare it to a TSP system commonly used in the Netherlands, and suggest areas of improvement.”
Jonathan English on “Developing a Surface Transit Revitalization Plan” According to the covering report “This presentation will discuss steps that can be taken to improve speed and reliability of the streetcar network, as well as new LRT lines.”
After the meeting, I will write up the presentations in an update to this article.