Two new lines on Toronto’s transit map suddenly sprang back to life this week with announced funding for the Waterfront East route by the City, Province and Federal governments. Days later, both Mayor Chow and her competitor, Councillor Bradford, came out with competing support for the Eglinton East LRT, now rebranded by Chow as the Scarborough East Rapid Transit, or “SERT”. “LRT” has become a dirty word thanks to the botched implementation on Finch, and a less than steller launch on Eglinton.
I will leave discussion of the details of SERT for another post once there is a better sense of just what technology and infrastructure options are actually on the table.
It’s important to remember that whoever is Mayor after the 2026 elections, there’s a good chance they will not be in office to see SERT, whatever it might be, open for service.
Meanwhile, long-suffering Scarborough transit riders will have only buses to ferry them around. The same can be said for other parts of the city waiting for transit improvements, and large parts of Toronto will never see anything more than a few RapidTO red lanes.
This raises two fundamental issues about TTC service:
- How much service should there be on TTC routes, and
- How much can crowding and convenience issues be addressed with existing services?
TTC Service Standards set out crowding levels for various types of vehicle, service and periods of operation.
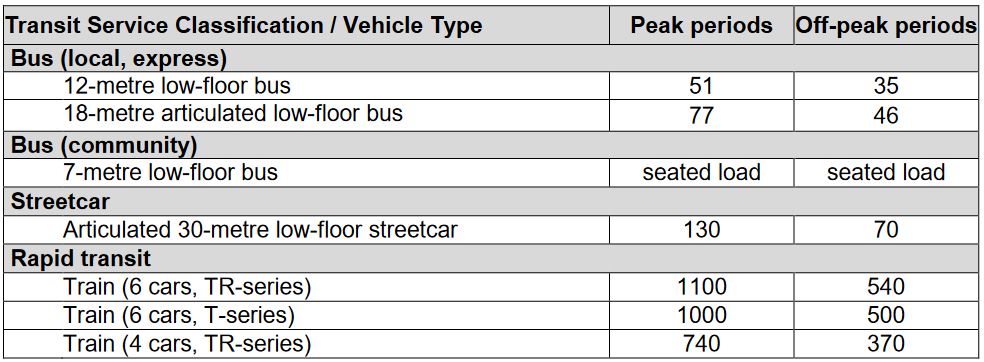
Although the TTC reports that overall ridership has not returned to 2019 levels, they also acknowledge that some routes are crowded beyond the standards. They do not list specifics of routes and time periods, and so it is hard to know the scope of the problem or the affected locations.
This situation is not corrected thanks to budget limitations. The TTC owns buses and streetcars, but they cannot afford to run all of them.
From a rider’s point of view there is more to service quality than the number of buses on the road. These vehicles should also show up reliably so that loads are evenly distributed between them, and wait times are predictable. TTC loves to blame all problems on traffic congestion, but a fundamental issue is that service does not run on even spacing, and little is done to improve this. One difficulty is the acceptance in standards of being off schedule up to 5 minutes, and this only applies leaving a terminus. This allows buses to run together on frequent routes and still be “on time” while giving poorer service than advertised.
Back in the early days of debates on a Scarborough LRT or subway replacement for the former Line 3 SRT, important research from UofT showed that in the off-peak period, the majority of trips in Scarborough stay in Scarborough. A transit network designed to get people downtown does not necessarily address local travel unless it happens to lie along well-used commuter routes. Such a network can also miss travel patterns to and from major suburban work and academic locations both inside Toronto and in the 905 beyond. Off-peak service is important, but it must be more than a line on the map representing a bus that will appear sometime, maybe.
Later in this article, I will detail service frequency on routes across Toronto. In some quarters it is common to say “Scarborough gets the dregs”, but in fact the problem of infrequent and irregular service extends well beyond Scarborough borders. If there is to be advocacy for better transit, this will be more productive with all affected neighbourhoods.
The view ahead to the 2027 budget is not hopeful. Increased spending on service falls in various categories:
- Inflationary and cost-of-living effects
- Service added to address growth
- Service hours added to address congestion
- Service added to promote growth
The budget focus is on the first three, and growth for its own sake gets little attention. The TTC might produce a ridership growth strategy, but it will not affect the 2027 budget.
There has been no discussion of the level of service possible with existing infrastructure and fleet, as opposed to changes that would require more vehicles and, possibly, more garage space. Any added service will, of course, require more operators to drive it and that drives up the budget and subsidy requirement.
TTC planning in recent years focused on making changes within existing financial resources, and the funding shortfall to improve service overall is never presented for public debate. Meanwhile, the politicians do not want to talk about anything that would increase operating costs and lead inevitably to proposals for new revenues including fares and subsidies.
Better service both in quantity and quality is key to the TTC’s growth. Drawing lines on maps keeps the announcement machinery turning and fuels endless social media debates, but it does nothing for service today.
Any politician or advocate claiming to serve their community needs to address service and how it can be improved to serve everyone now, not just in the decade to come.
Continue reading