This article updates previously published on the Dufferin bus and Bathurst streetcar routes to show how the travel times in affected areas changed with the gradual implementation of red lanes over past months.
In summary, there is a reduction in travel time during some periods, but not others, typically because congestion is not an issue all of the time. An important factor, one we saw some years back on King Street, is not just to lower travel times, but to reduce the variations that contribute to irregular headways.
With a reserved lane, periods that might not be badly congested all the time have extra protection against surges like special events or construction projects that remove some network capacity. This depends on enforcement, of course, and paint alone will not keep motorists out of transit lanes.
The balance of the article shows how travel times have evolved from 2024 to May 2026 as a reference point before the World Cup events stress the transit and road system.
Also shown here are the headways on the three services from terminals and along the route. This is a very serious problem, and, indeed, the Achilles’ Heel of the RapidTO scheme. It is not enough to reduce travel times by a few minutes if the service reliability is poor.
Riders are more sensitive to wait times than travel times, especially over shorter distances because the unreliability of a wait contributes substantially to total travel time. On a route like Dufferin with local and express service, the short travel time can be completely outweighed by the longer wait for a bus which is also likely to be crowded when it eventually arrives.
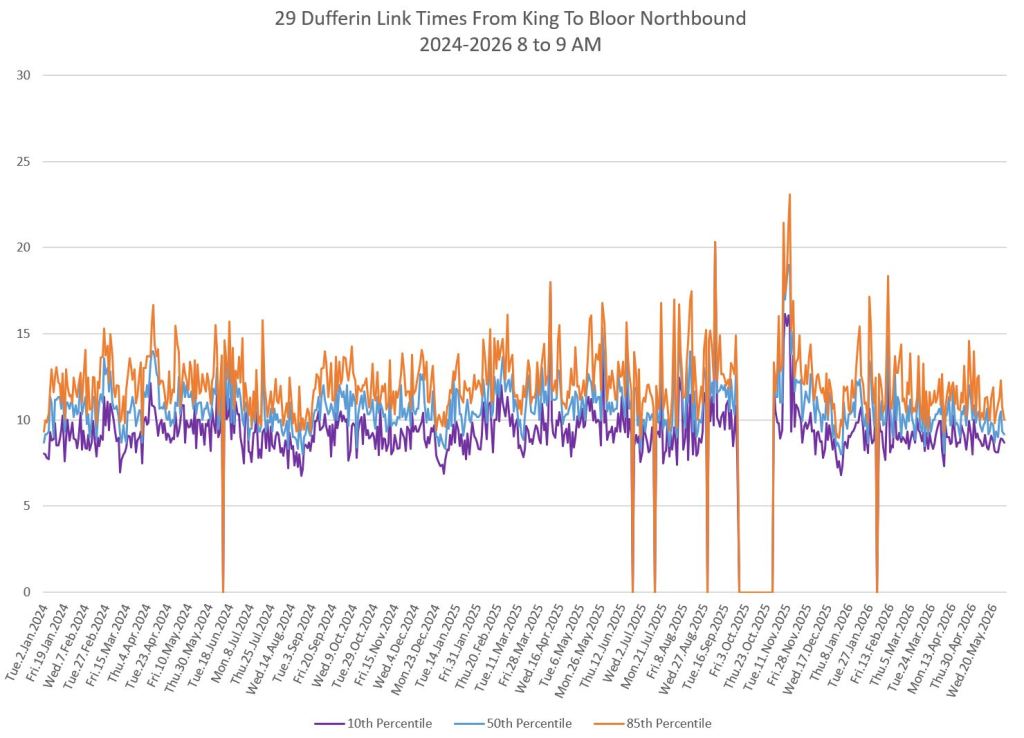
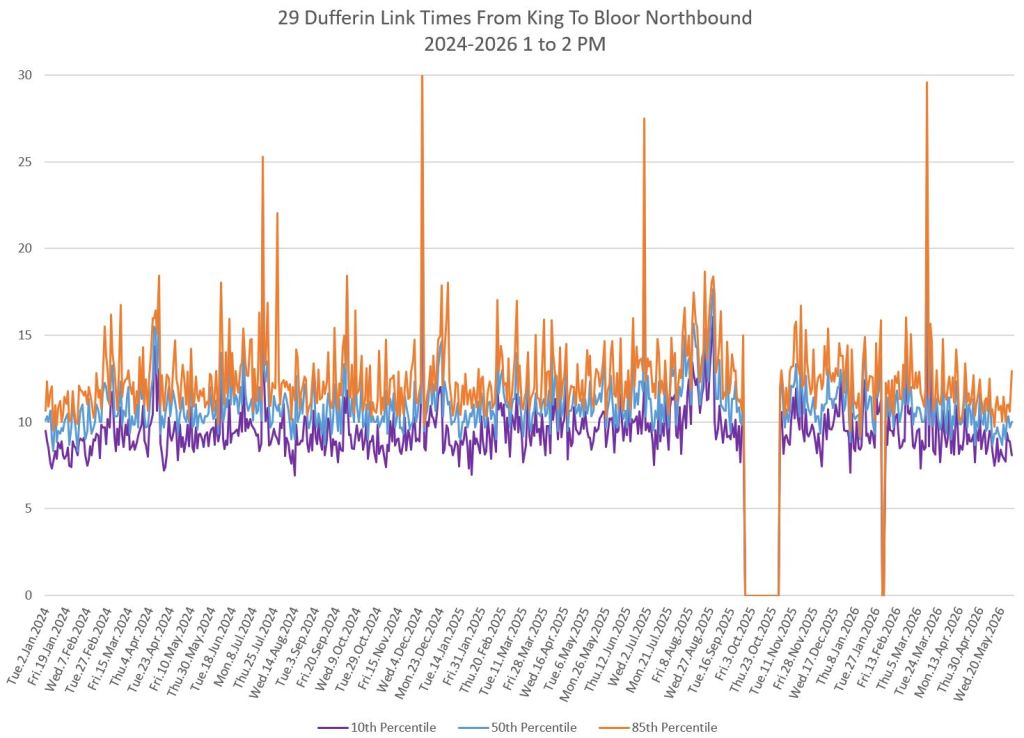
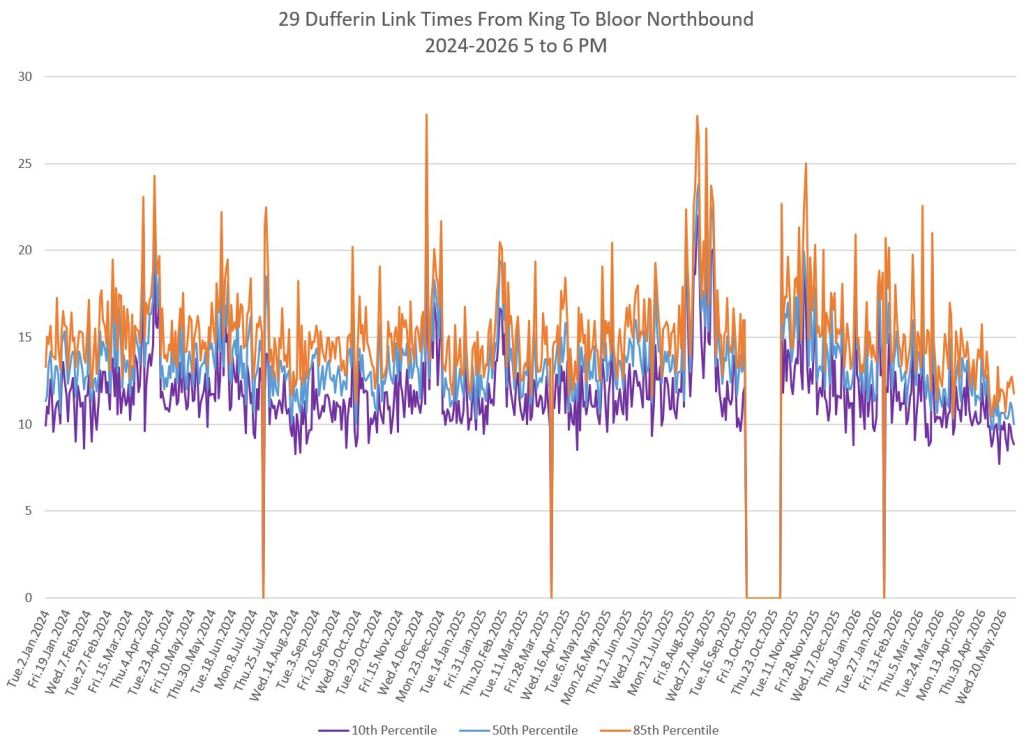
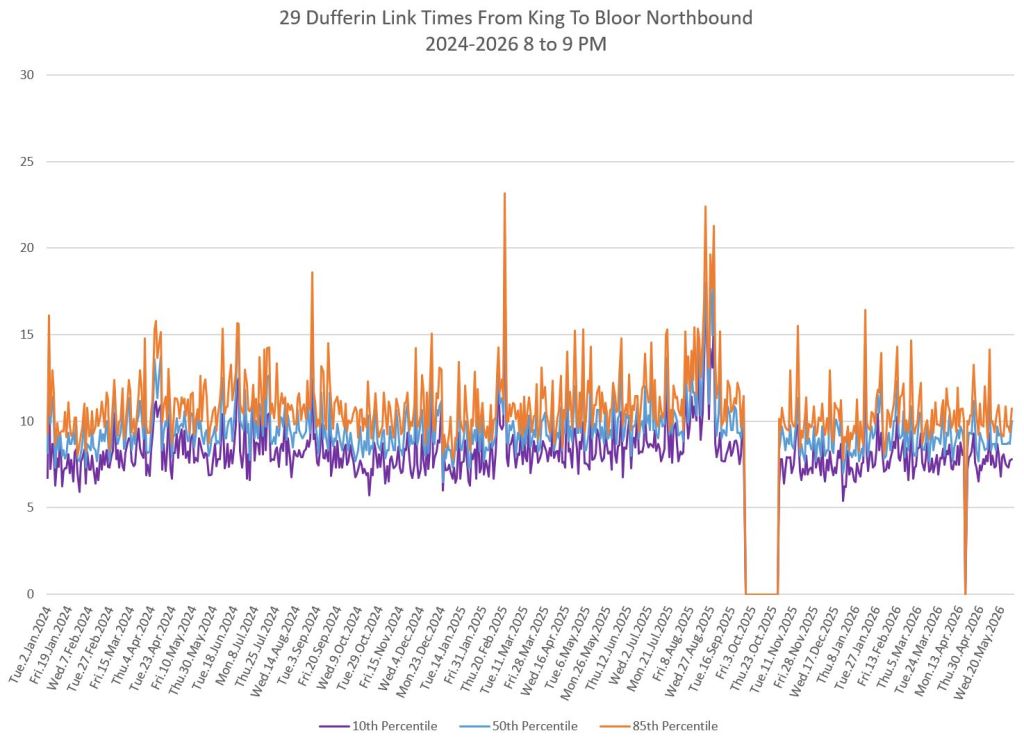
29 Dufferin Between King and Bloor
Improvements on 29 Dufferin local service is primarily seen northbound in the afternoon and PM peak periods.

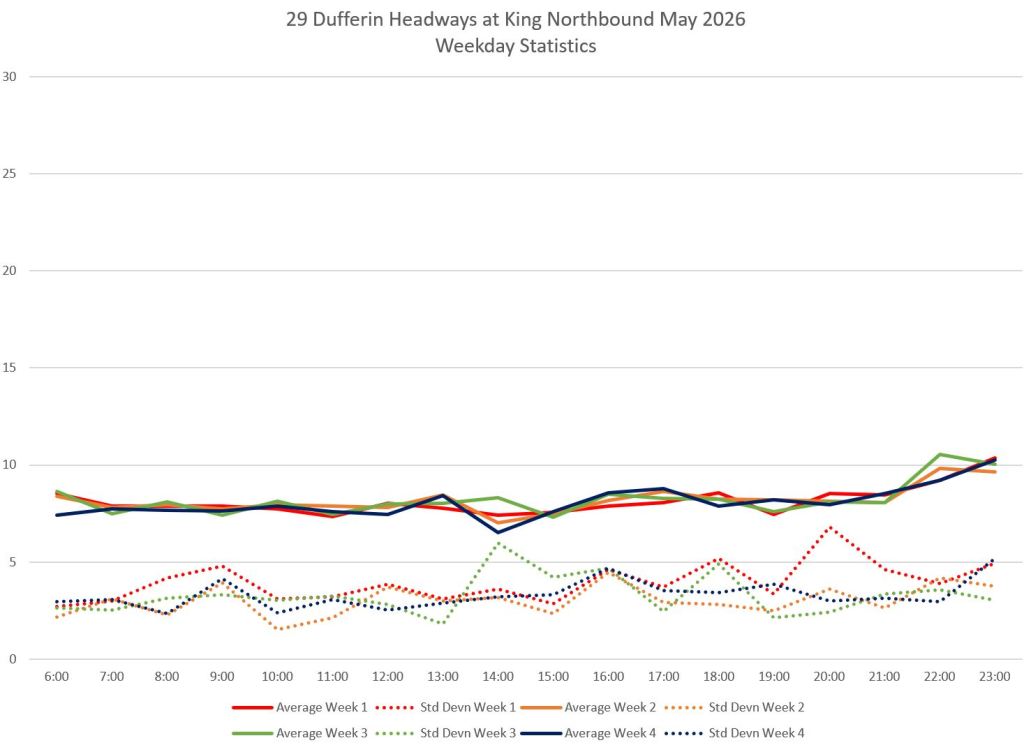
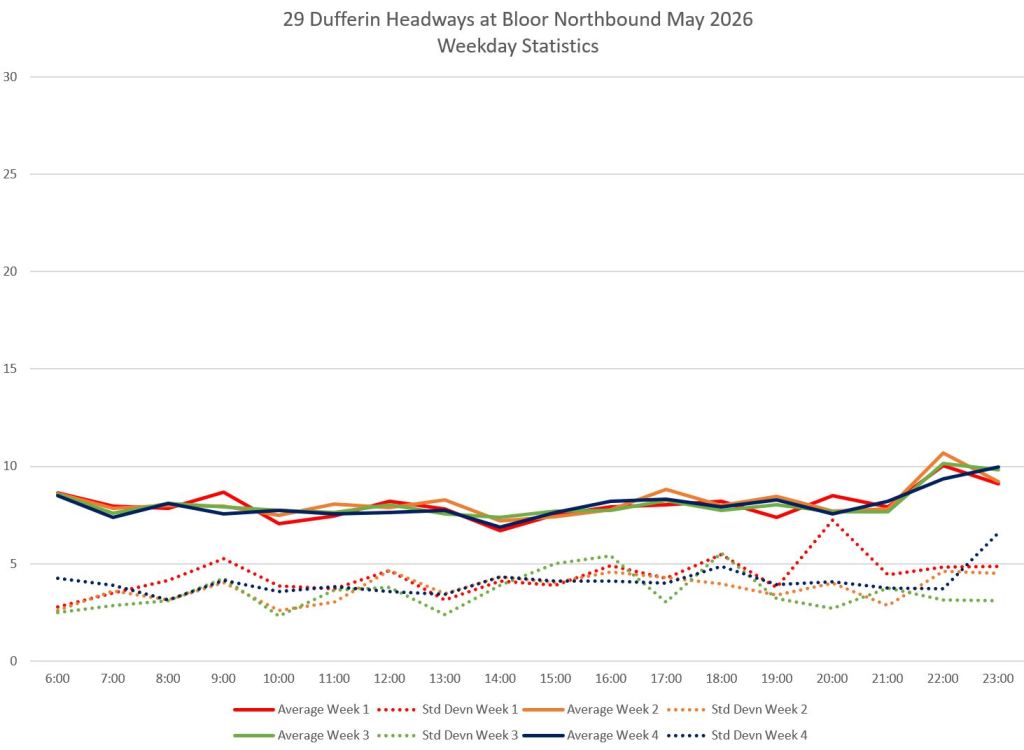
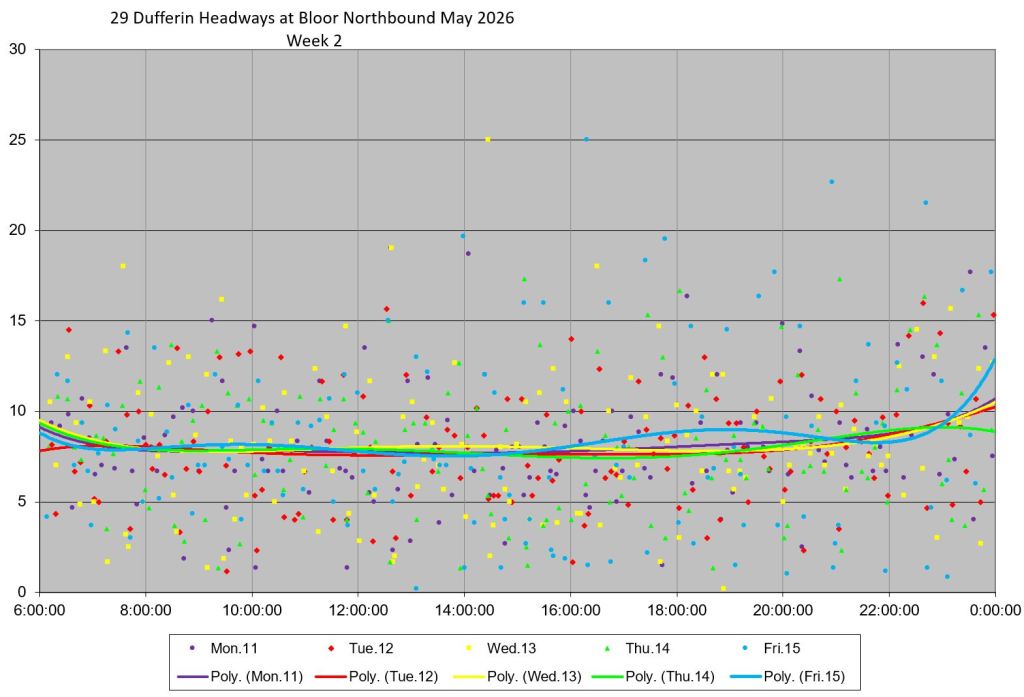
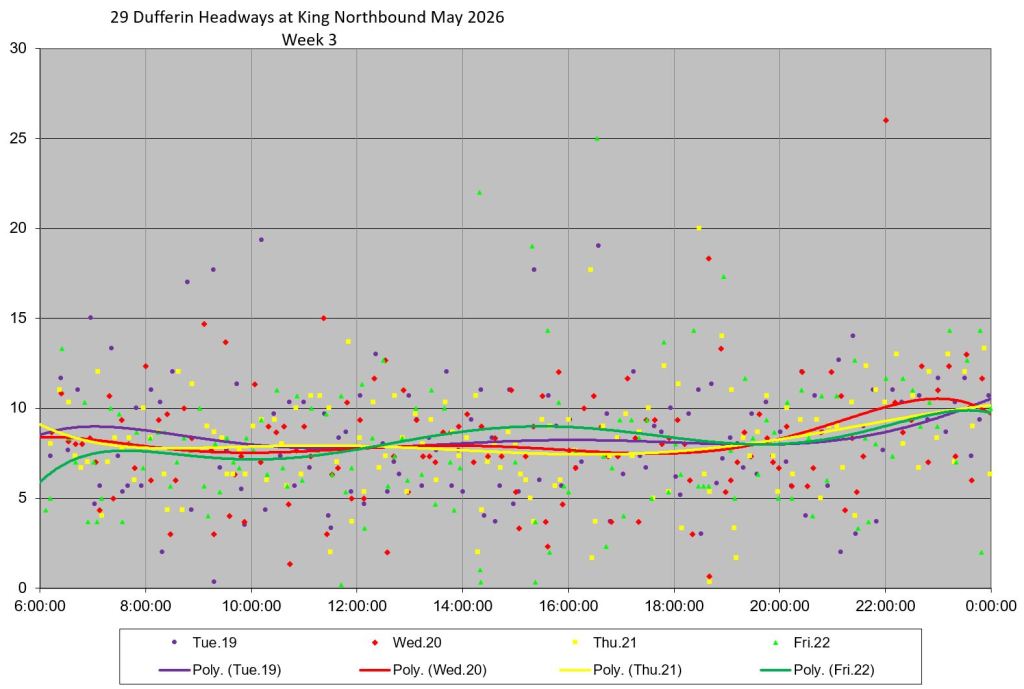
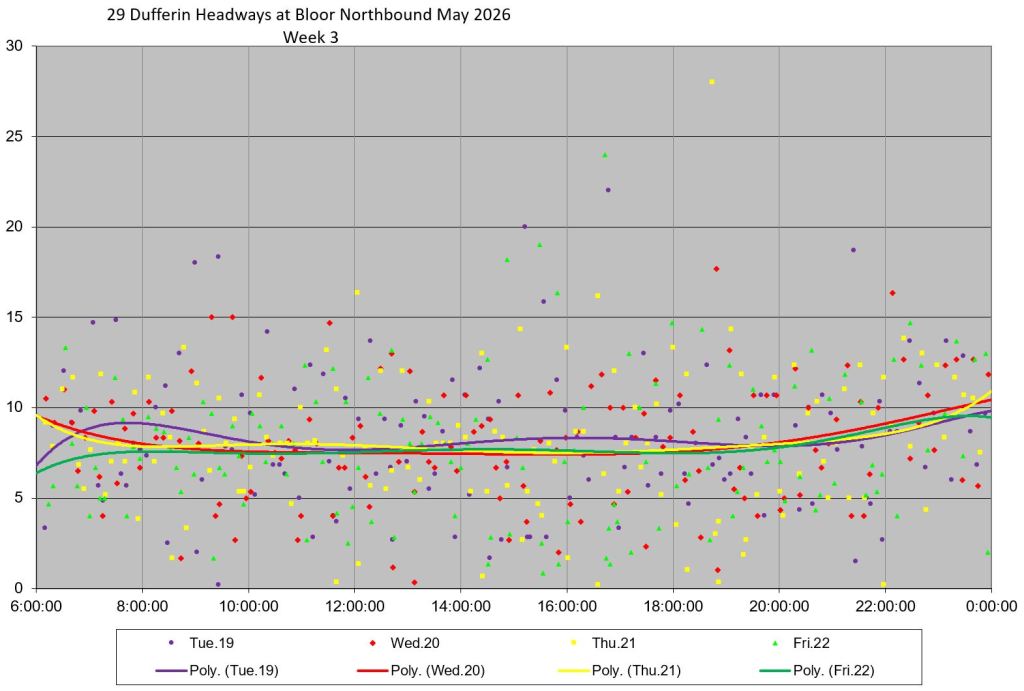
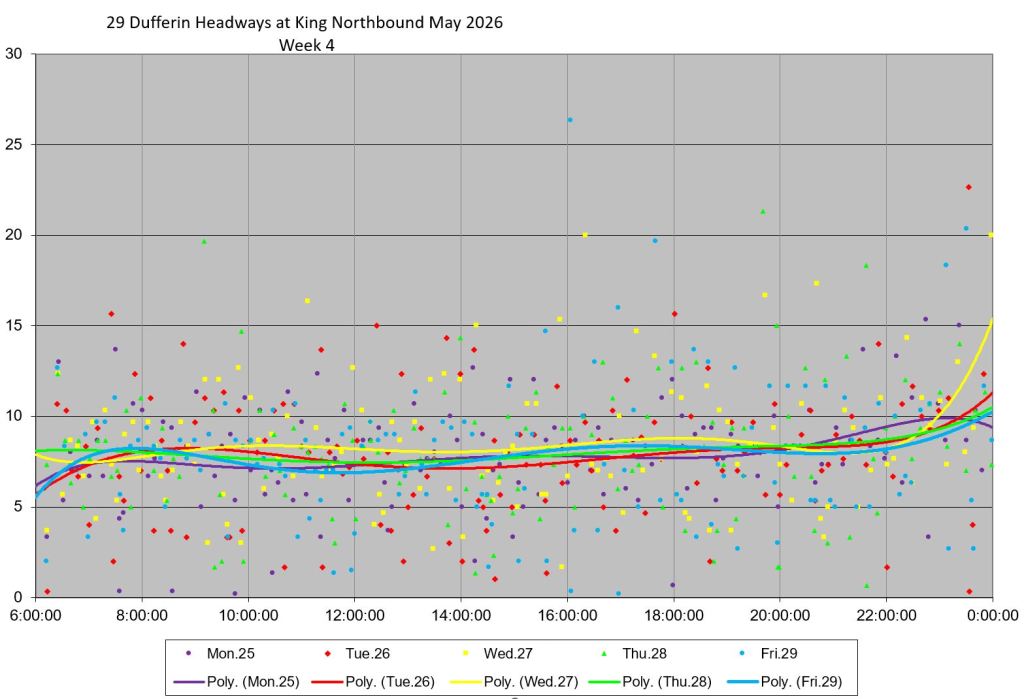
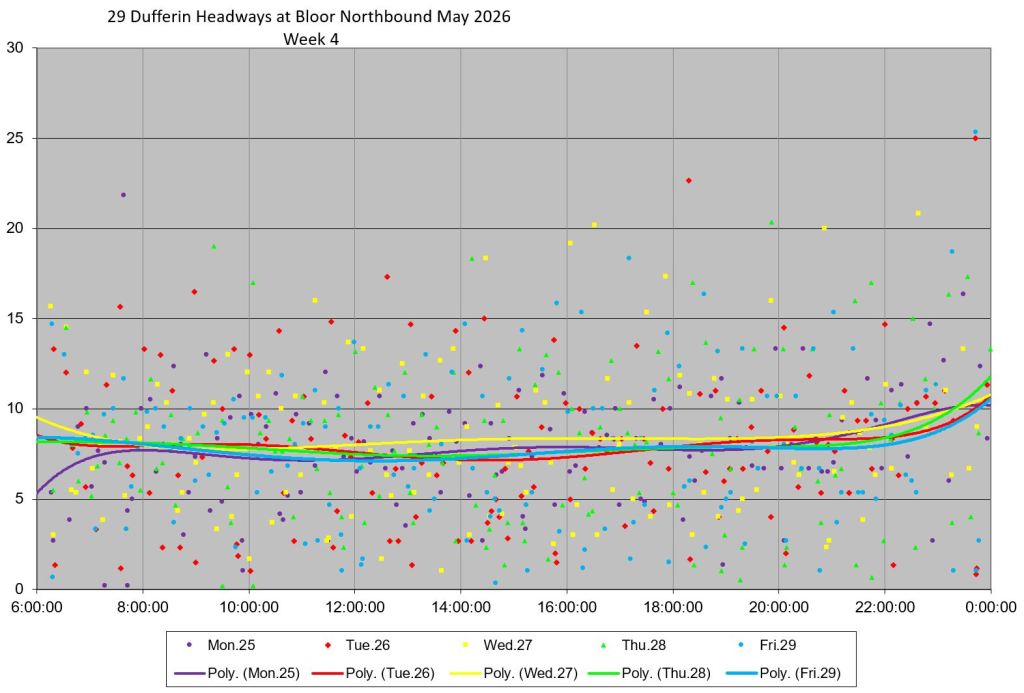
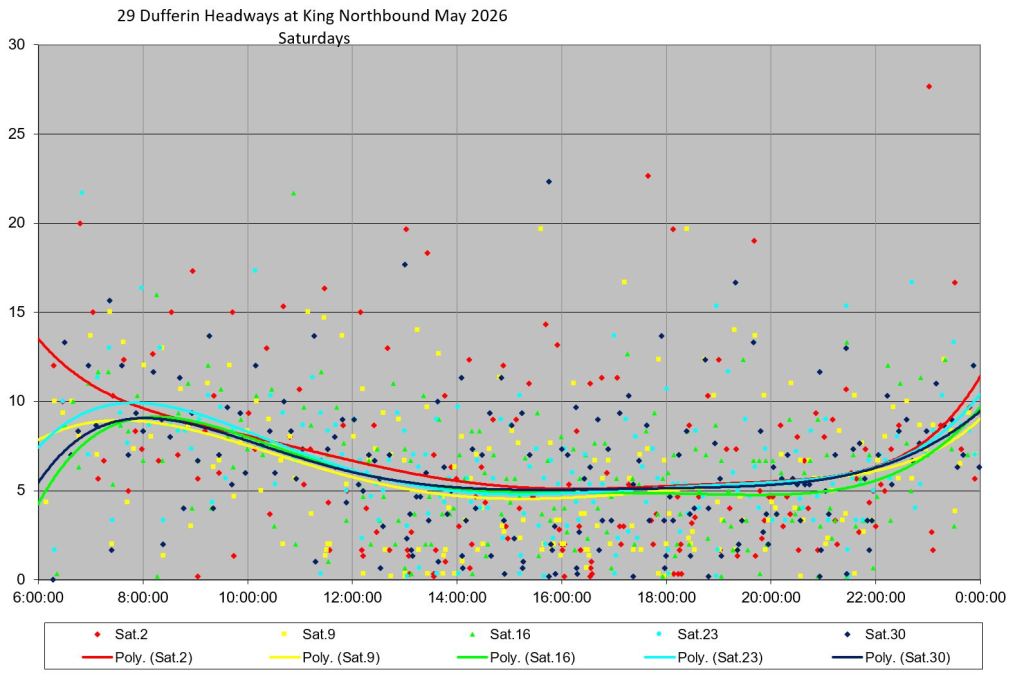
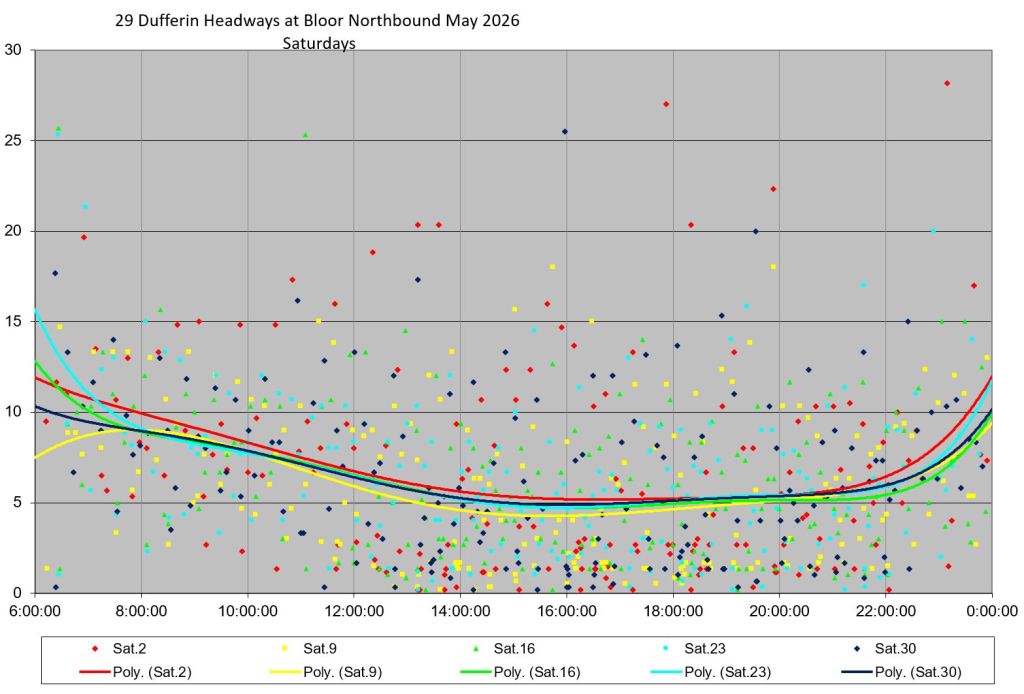
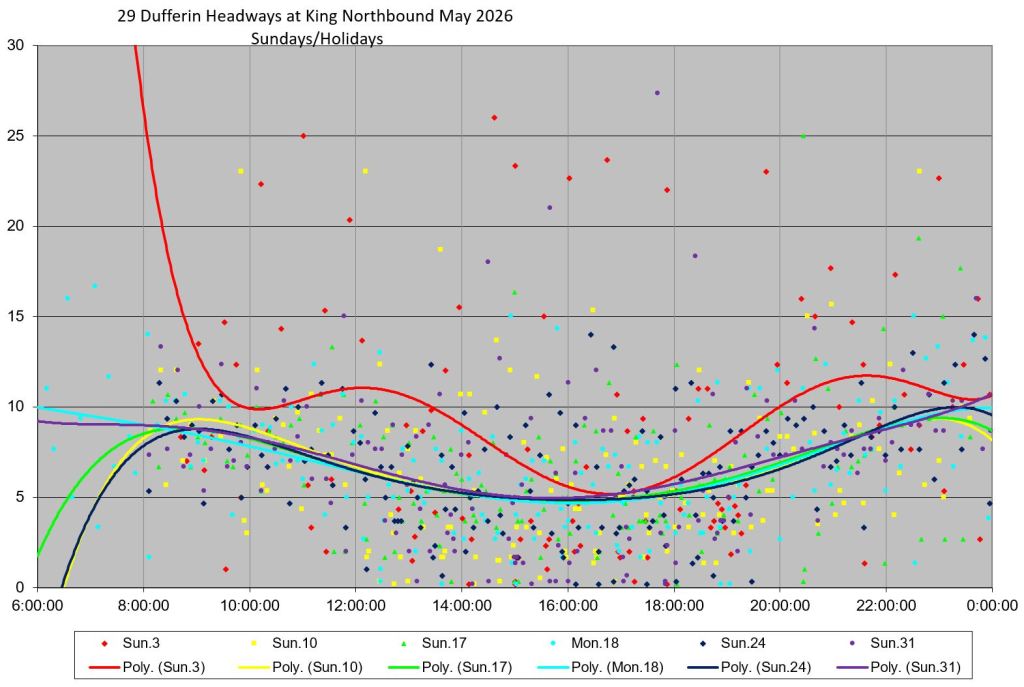
29 Headways Northbound at King and at Bloor
It’s all very well to have better travel times, but if buses are poorly spaced, those gaps and bunches are what riders see. Wait time is considered to be 1.8 times more onerous per the TTC’s own standards than in-vehicle travel time. Moreover, unevenly spaced service will have uneven loads, and riders on gap buses will experience crowding even if, in theory, the service is not full on average.
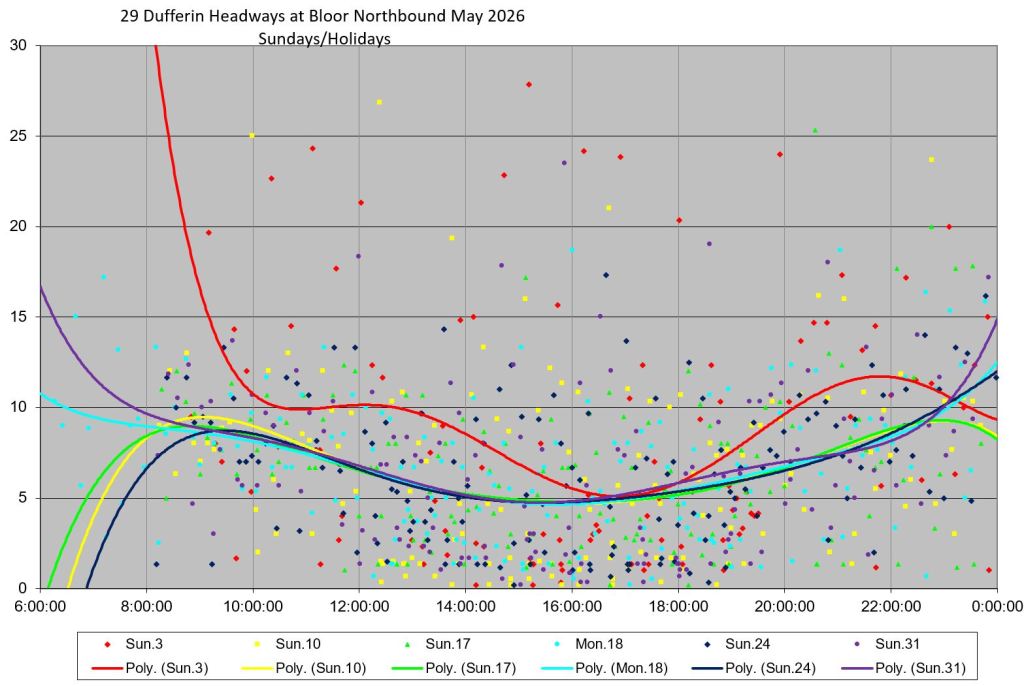
The charts below show headway stats and data for May 2026 northbound at King (near the southern terminus) and northbound at Bloor. The average headways lie roughly where they should at scheduled values (usually 8 minutes) but the standard deviations (measure of scatter in values) are quite high even at King, let along by the time the service reaches Bloor.
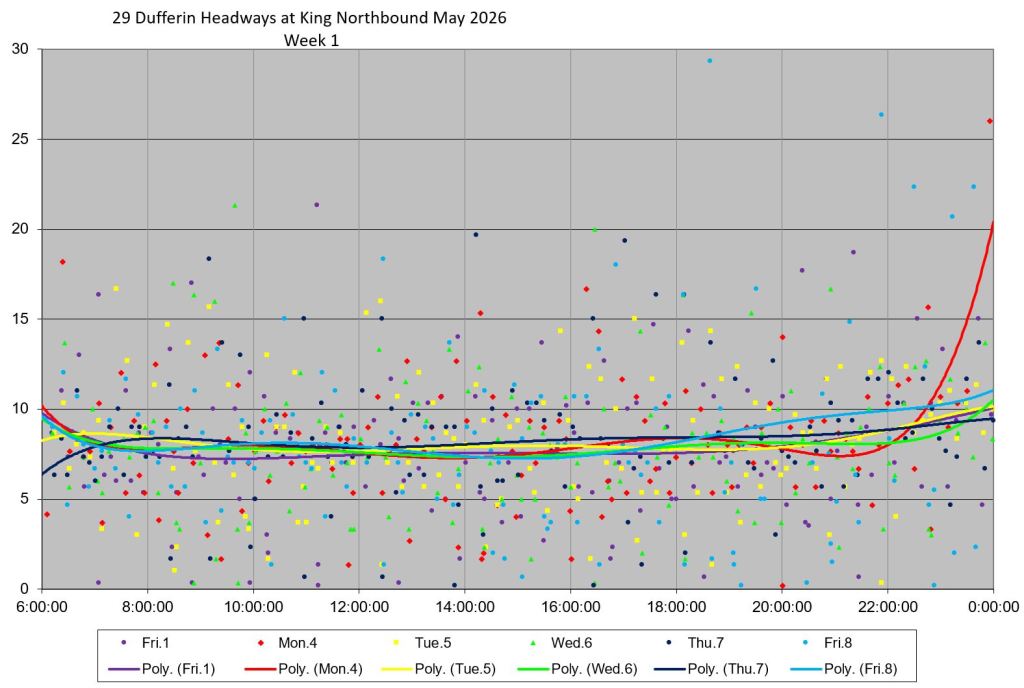
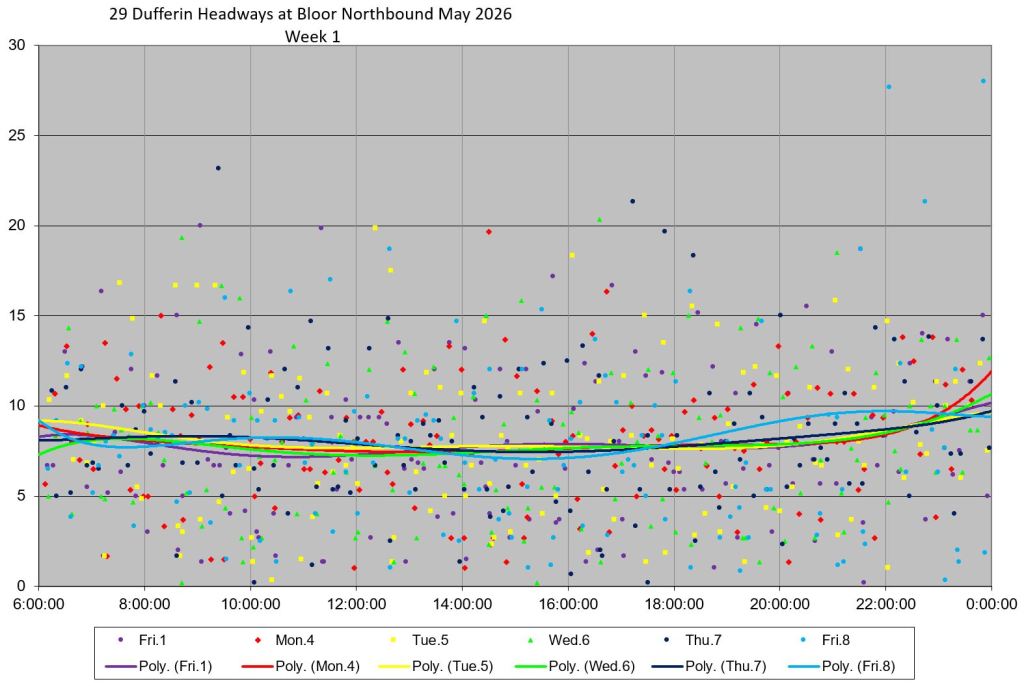
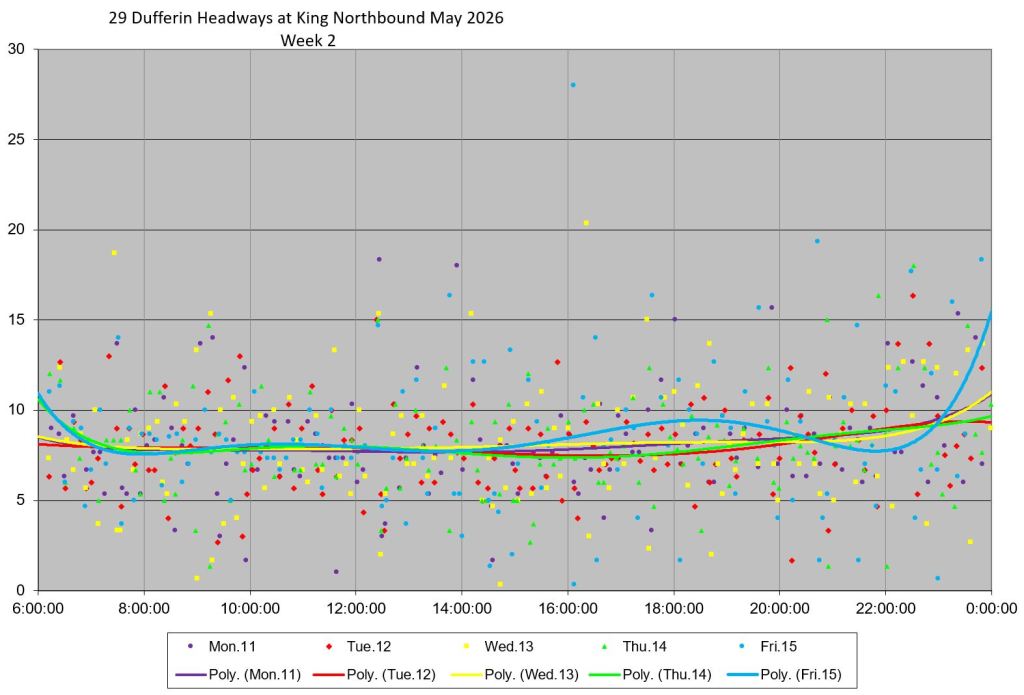
The charts below show individual weeks’ and weekend data at King and at Bloor northbound. Weekday service has headways scattered over a wide range, and weekends are even worse.
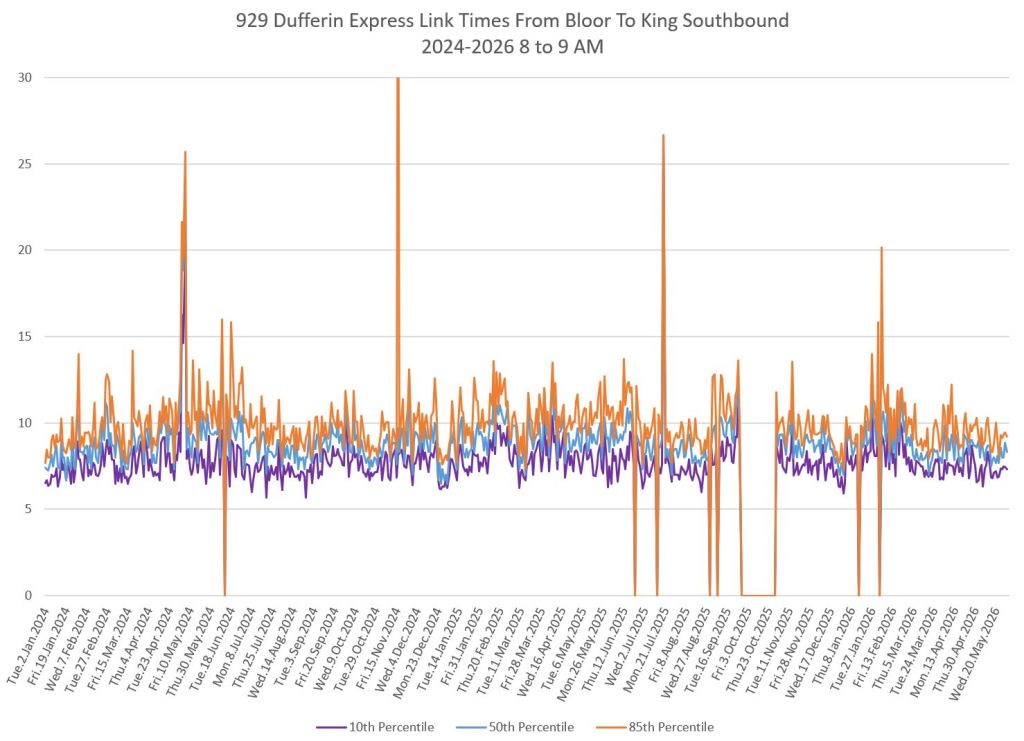
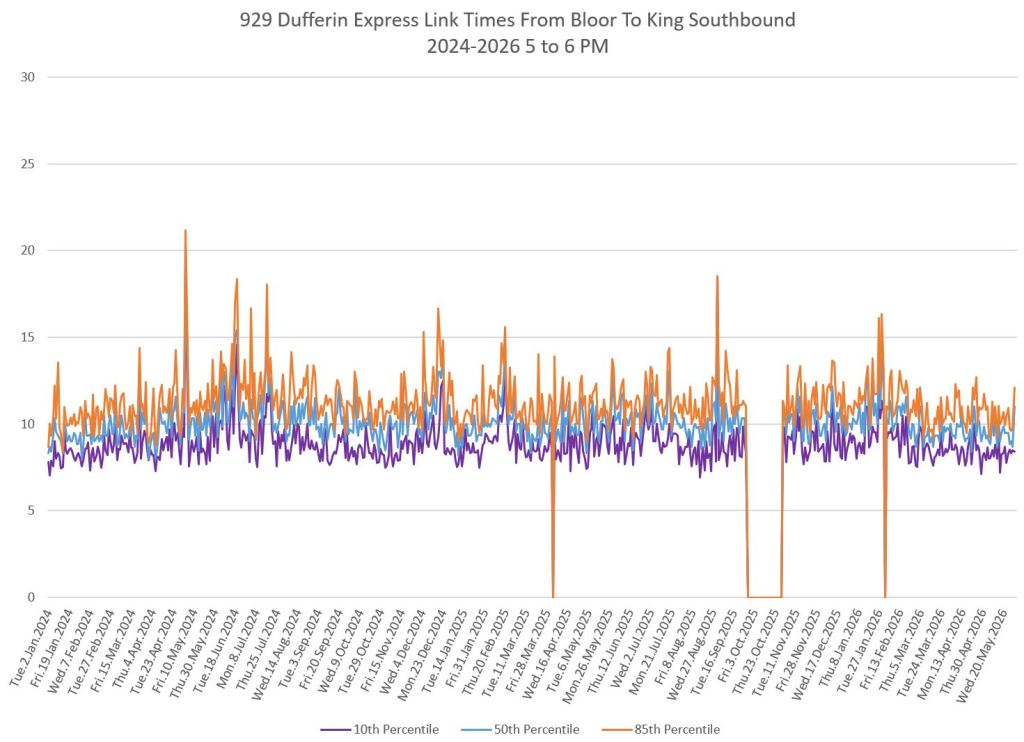
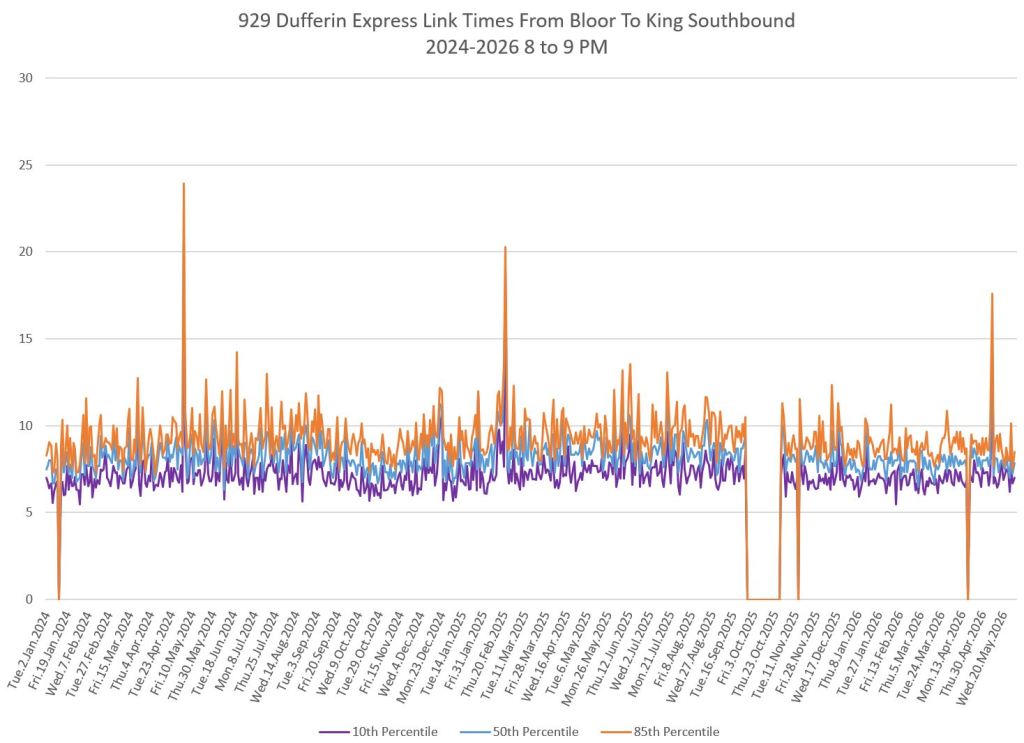
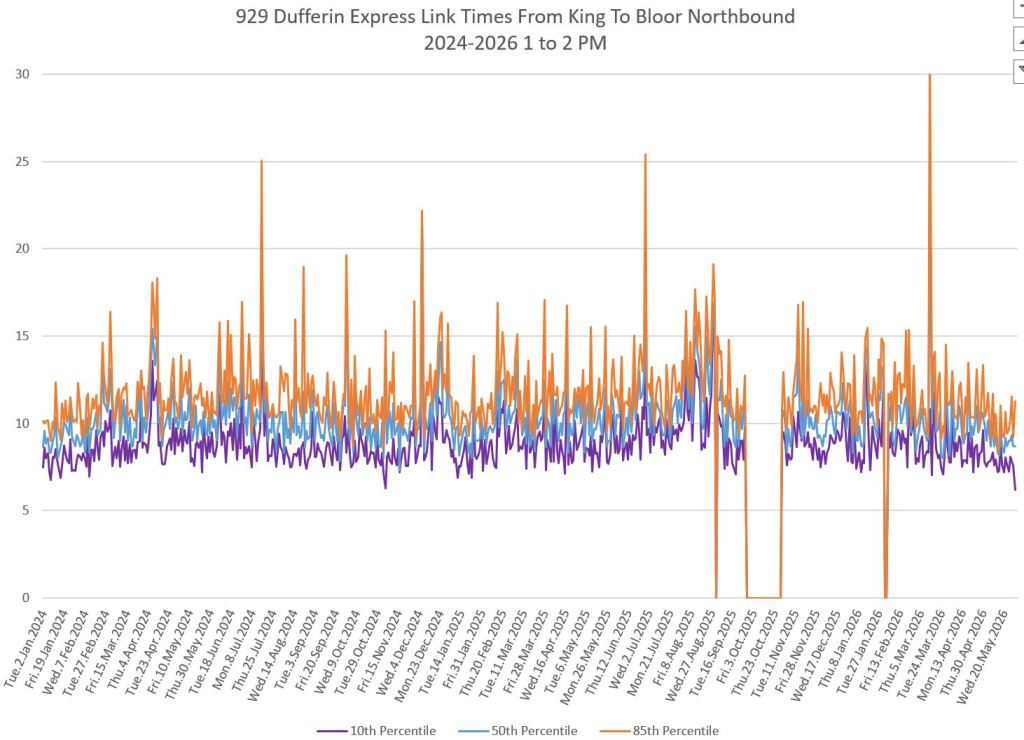
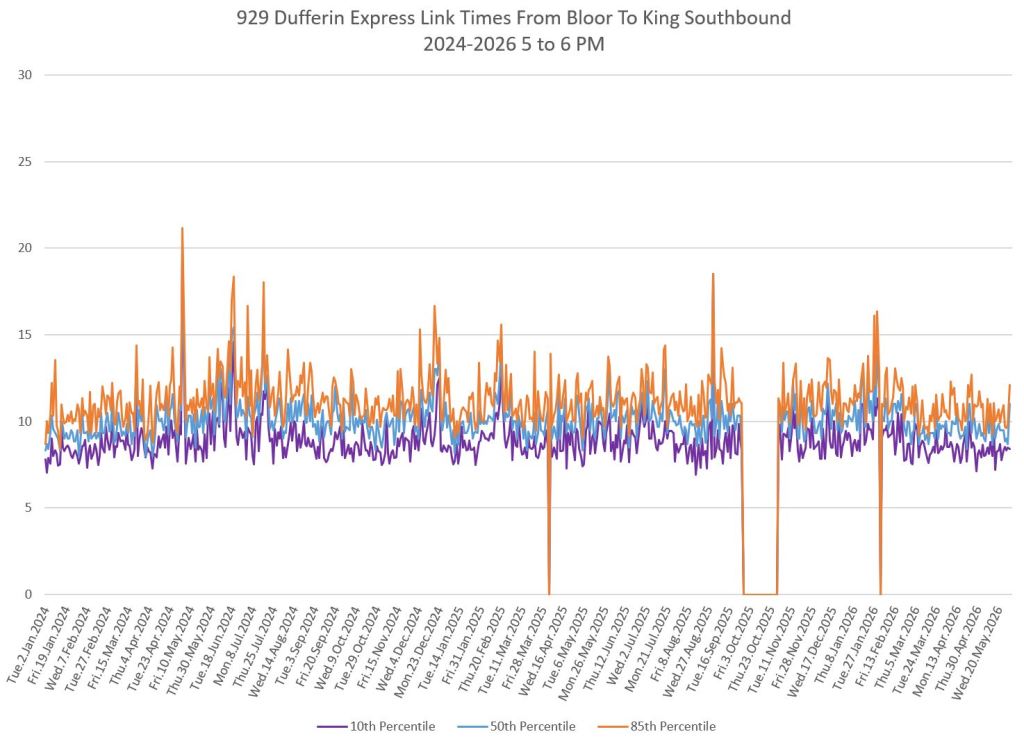
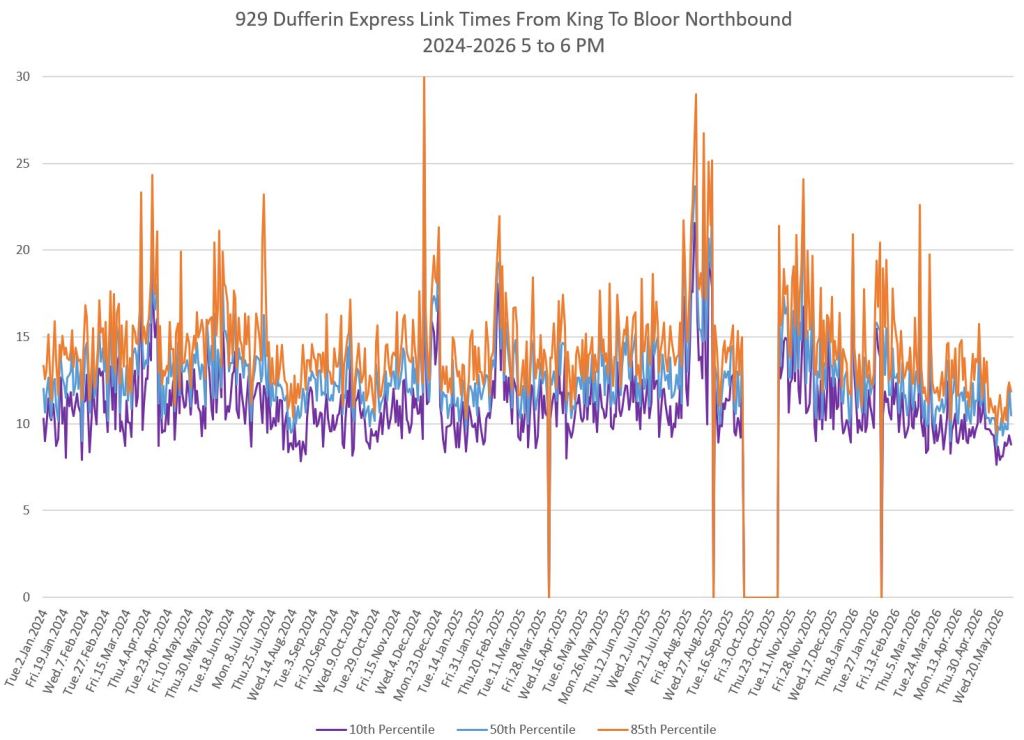
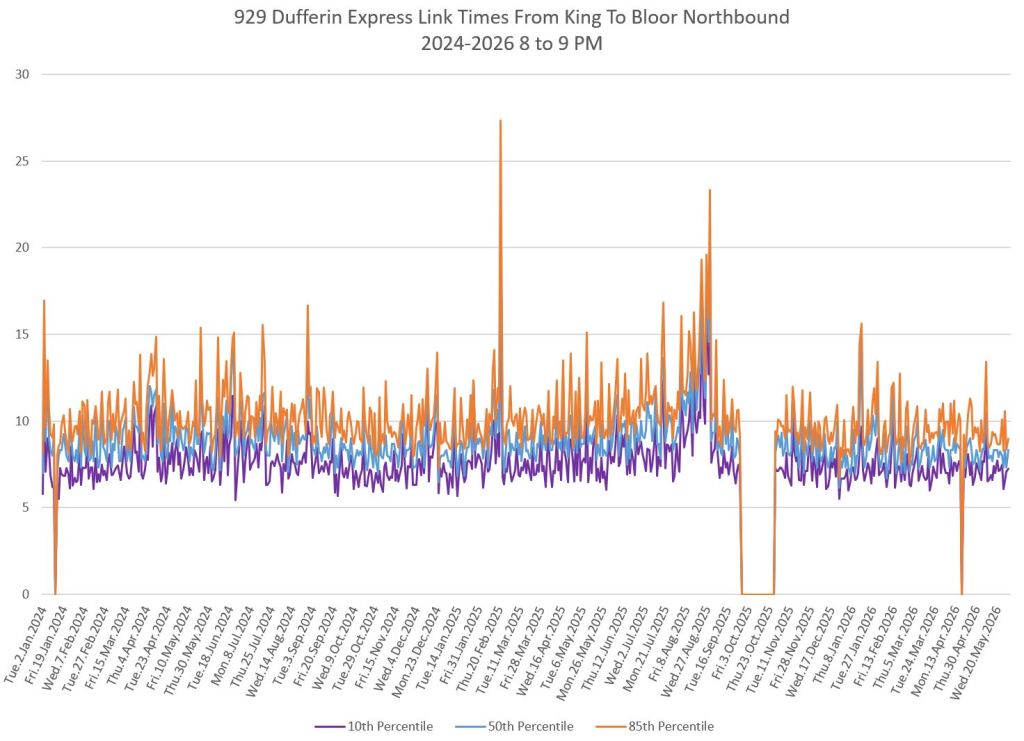
929 Dufferin Between King and Bloor
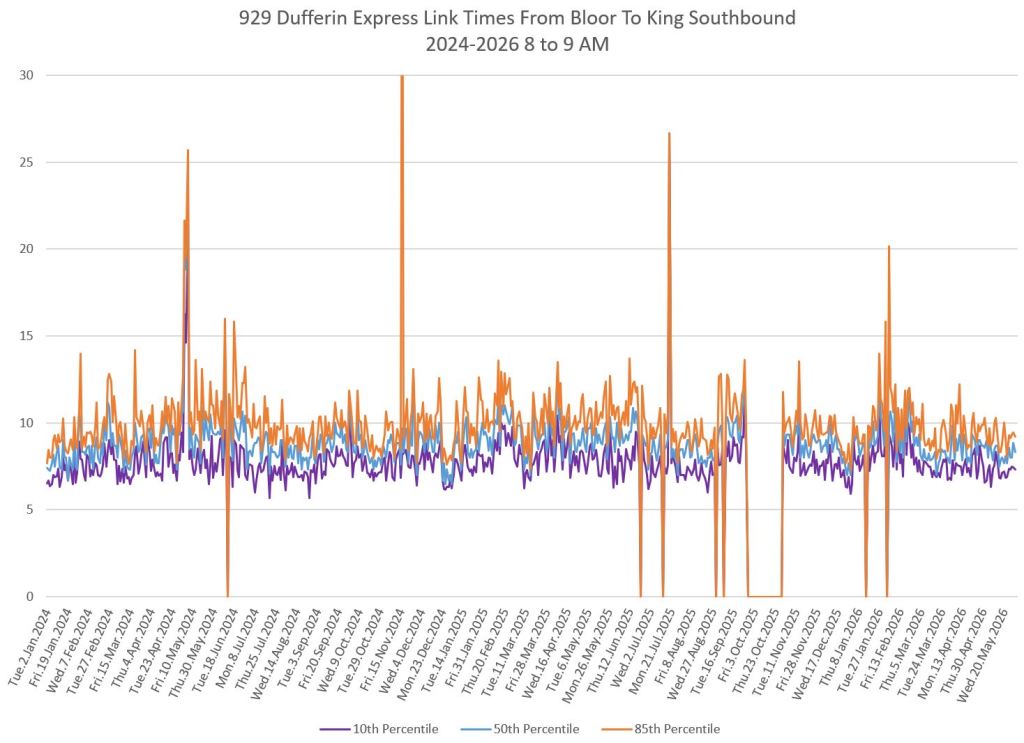
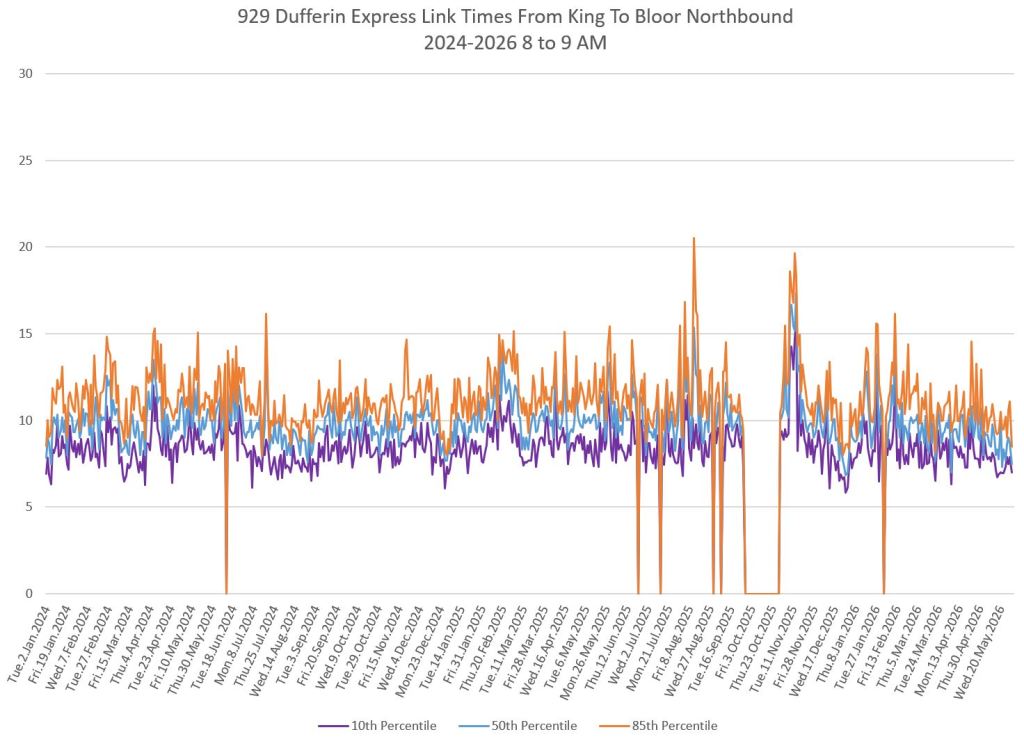
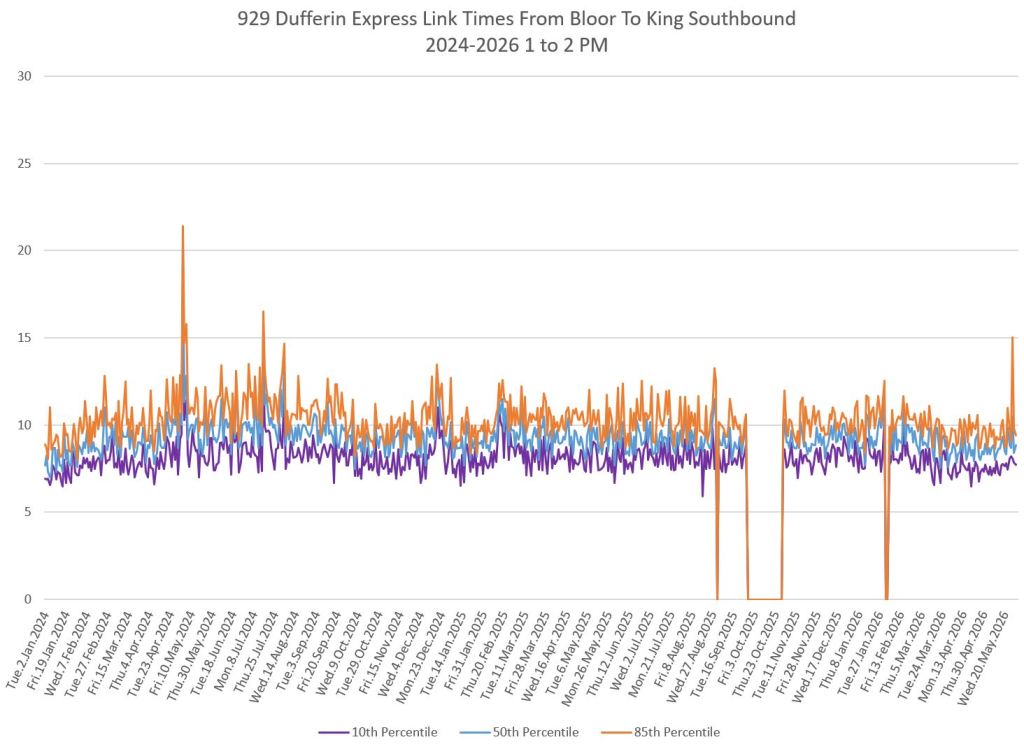
Improvements on the 929 Dufferin Express service mirror those on the local service with the main reductions being in the afternoon and PM peaks.

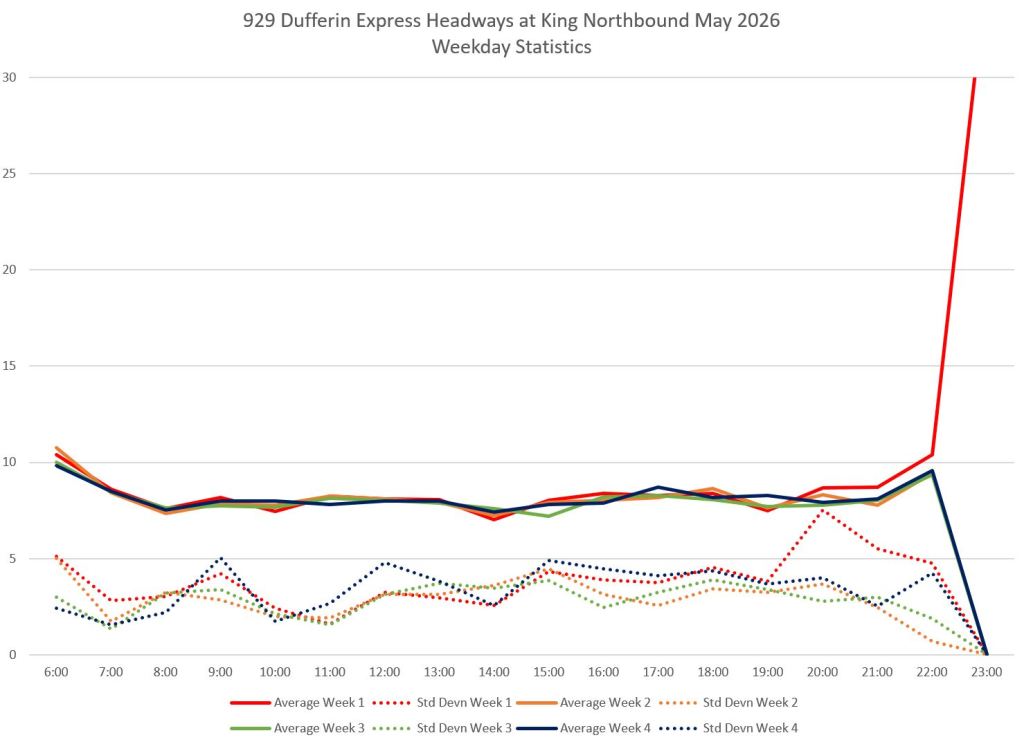
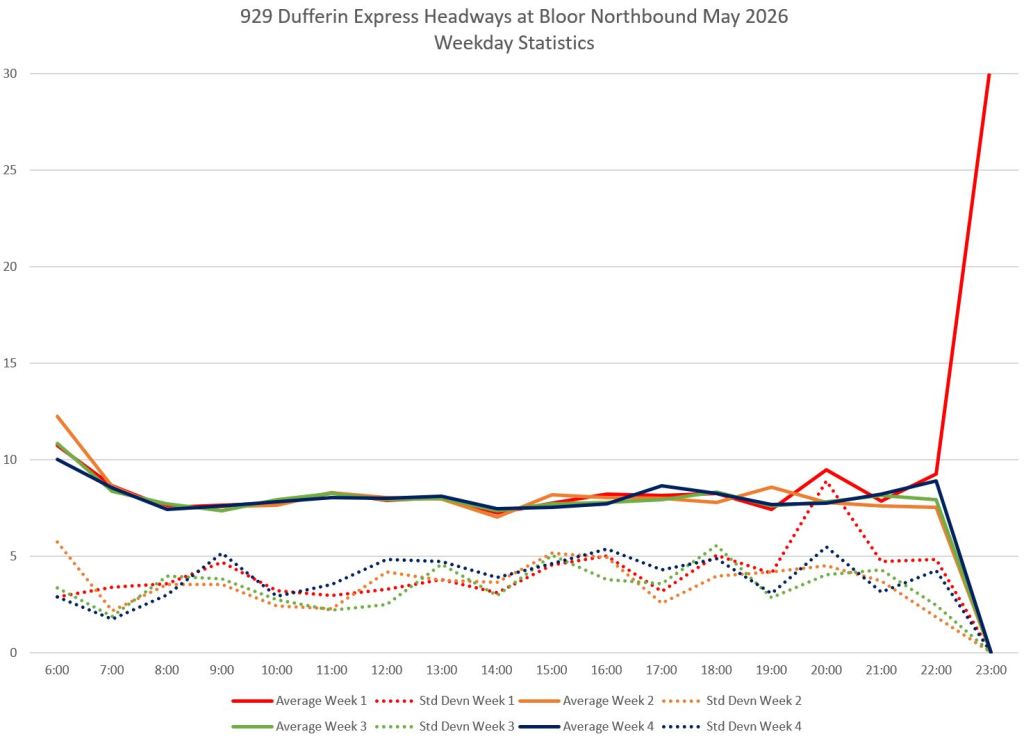
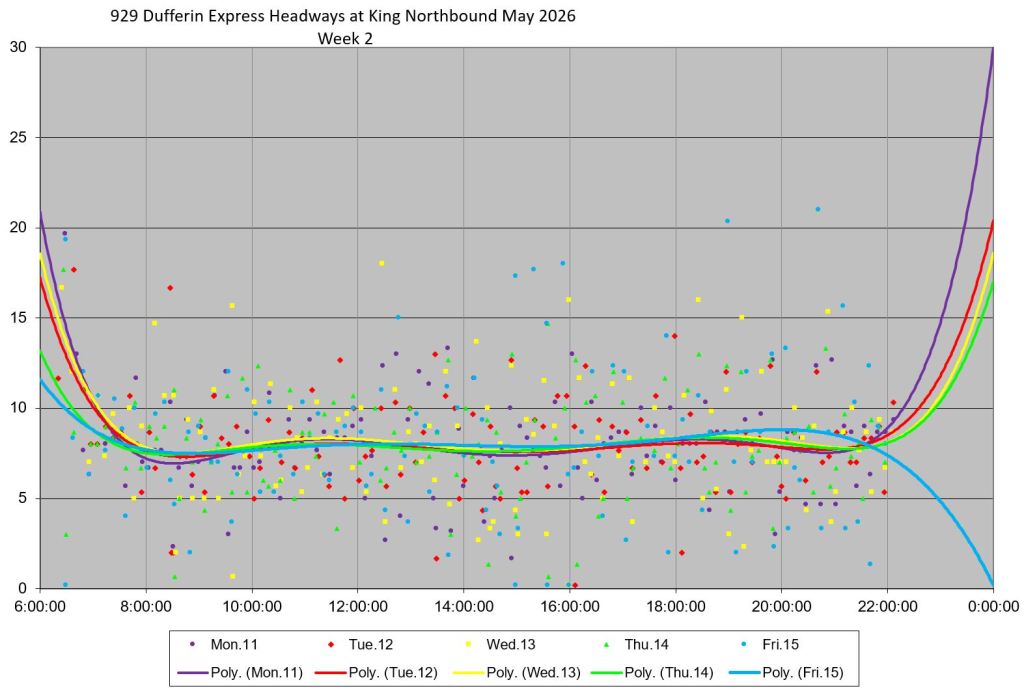
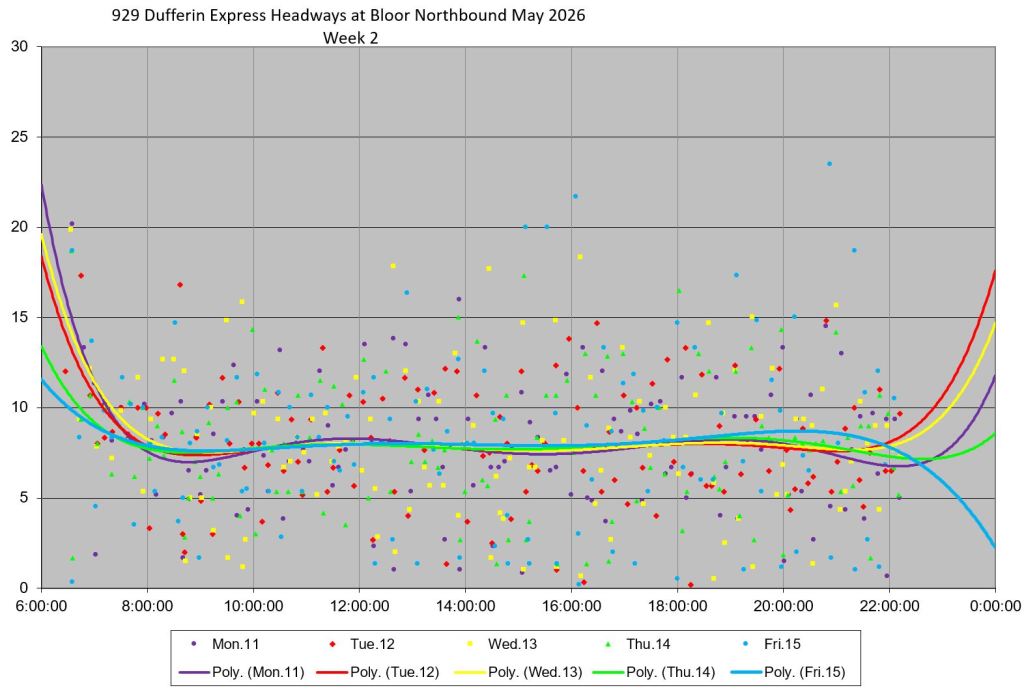
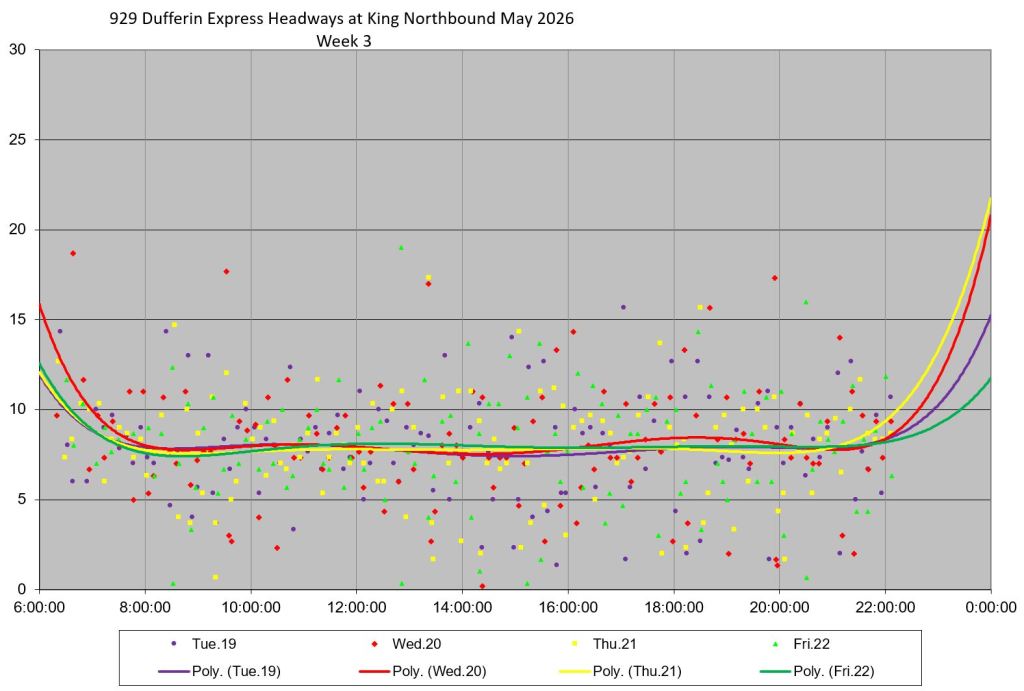
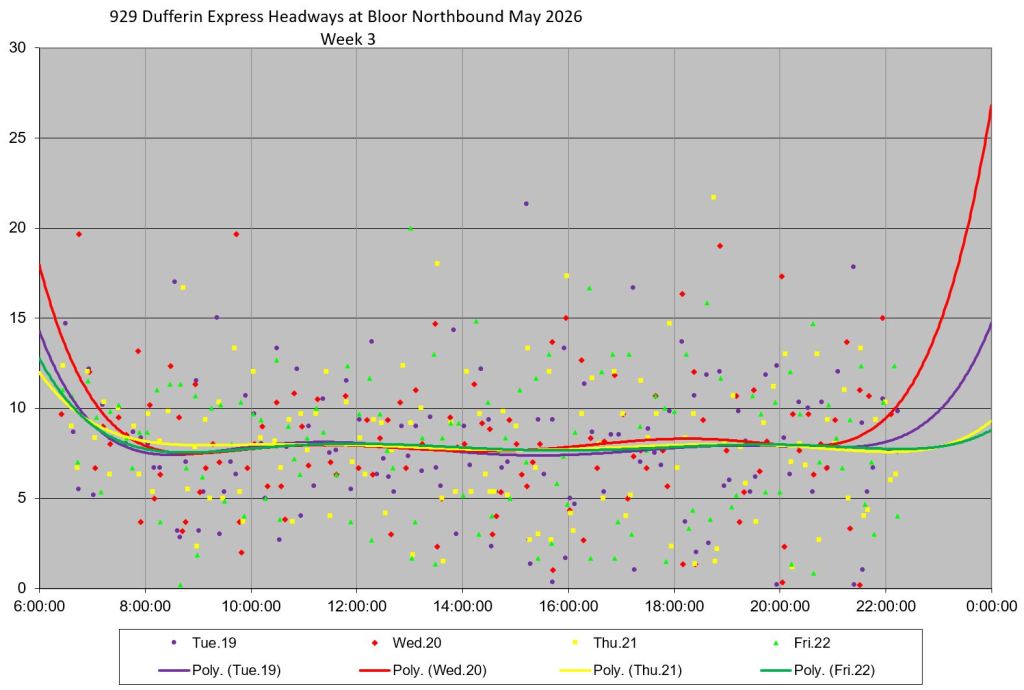
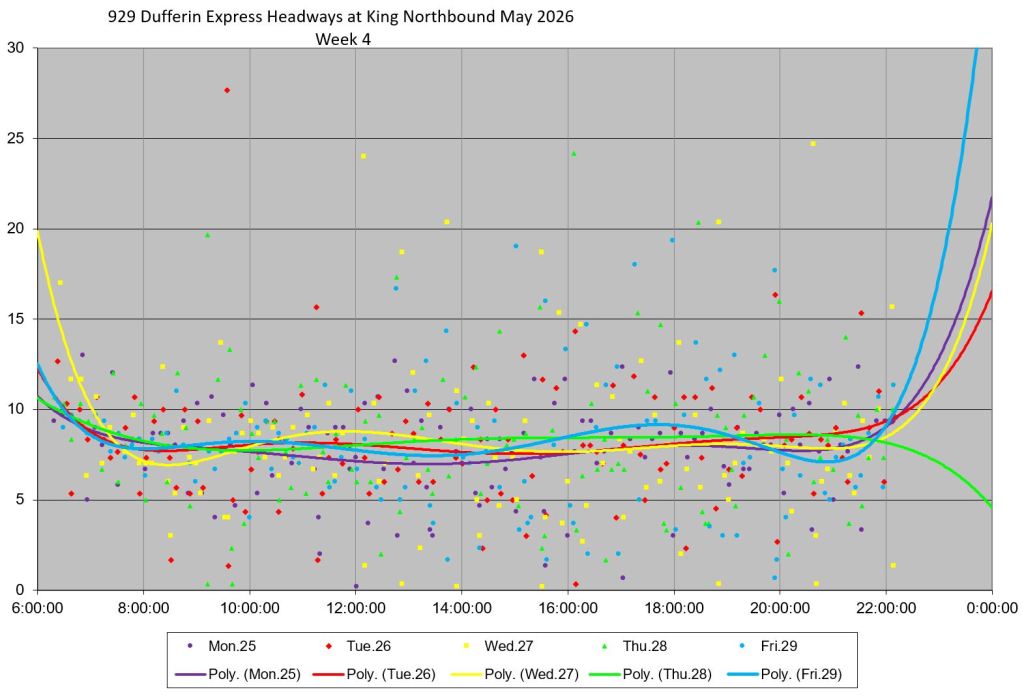
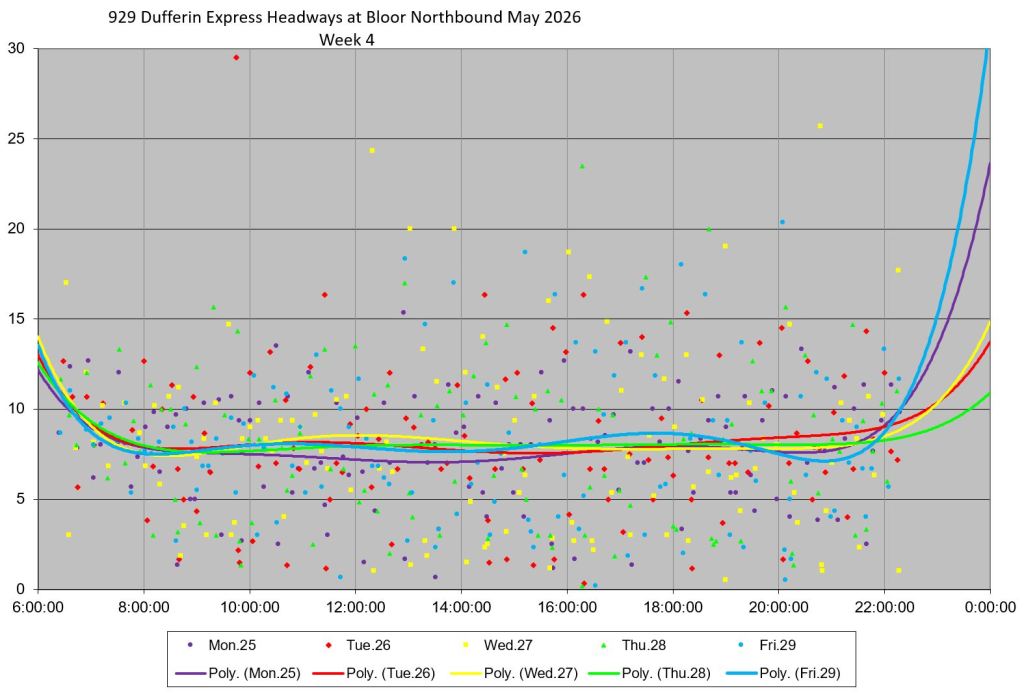
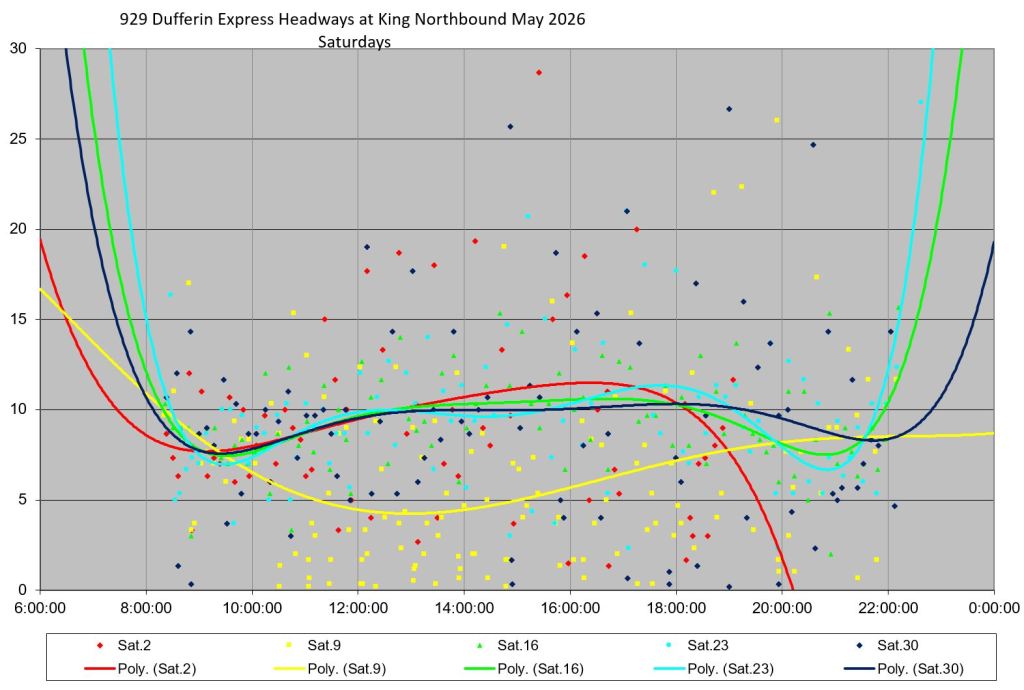
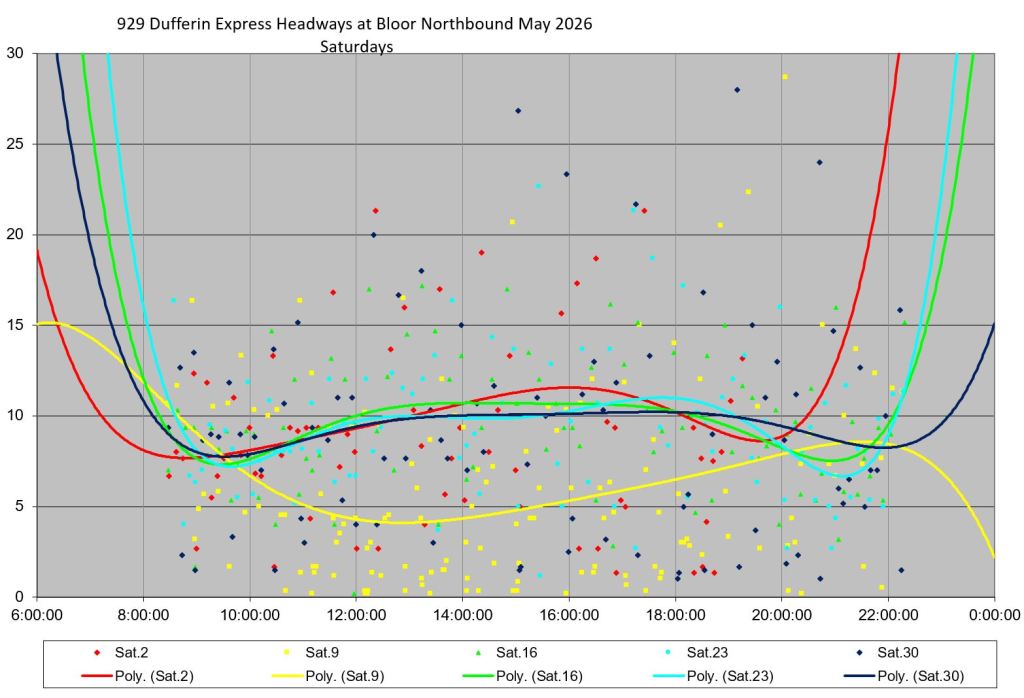
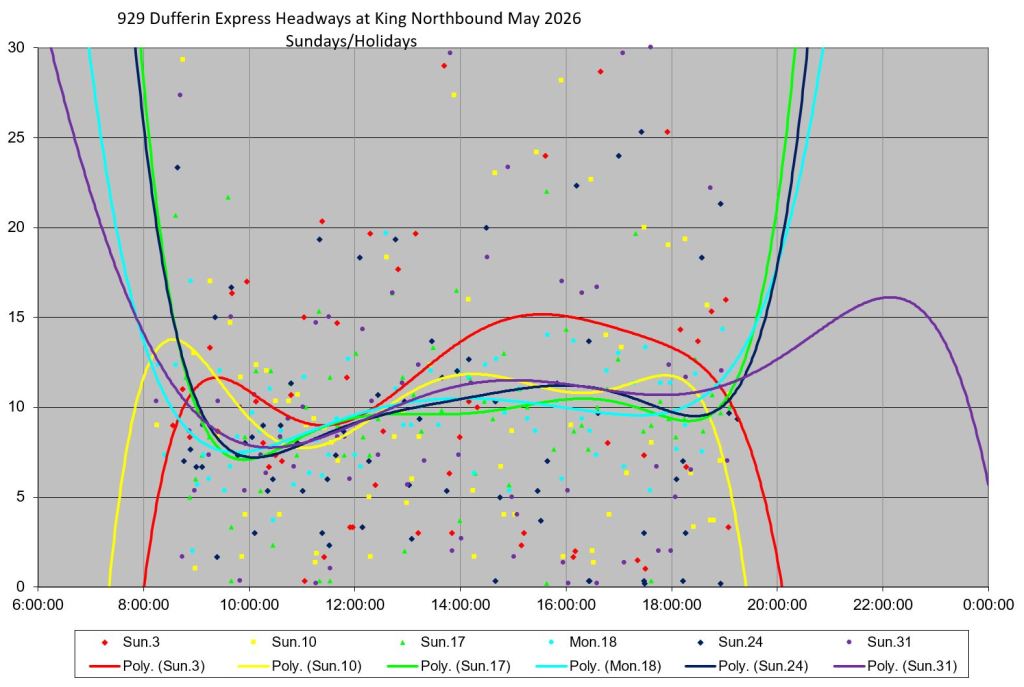
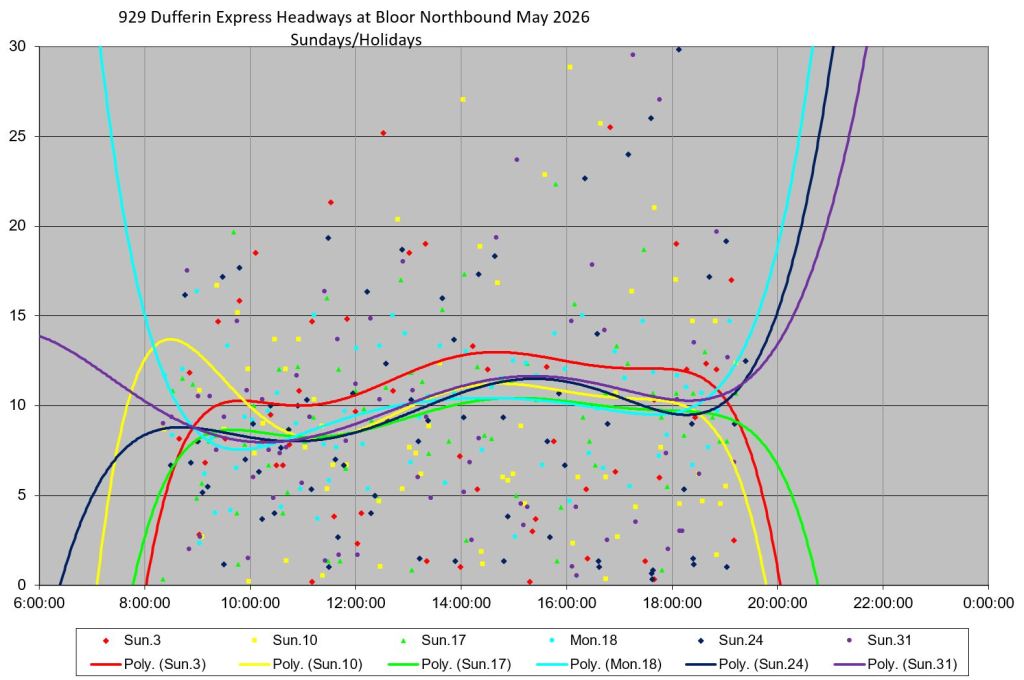
929 Headways Northbound at King and at Bloor
The 929 Express service leaves the south end of the route at Dufferin Loop with service already erratic when it crosses King, and even more so at Bloor. Note that the standard deviation values (measuring scatter in individual are already high at King, and are higher still at Bloor. The averages are consistent showing that all buses operated (if there were missed trips, the averages would be higher). The problem is that they were not evenly spaced. These charts are in the same format as the 29 Dufferin local headway charts above.
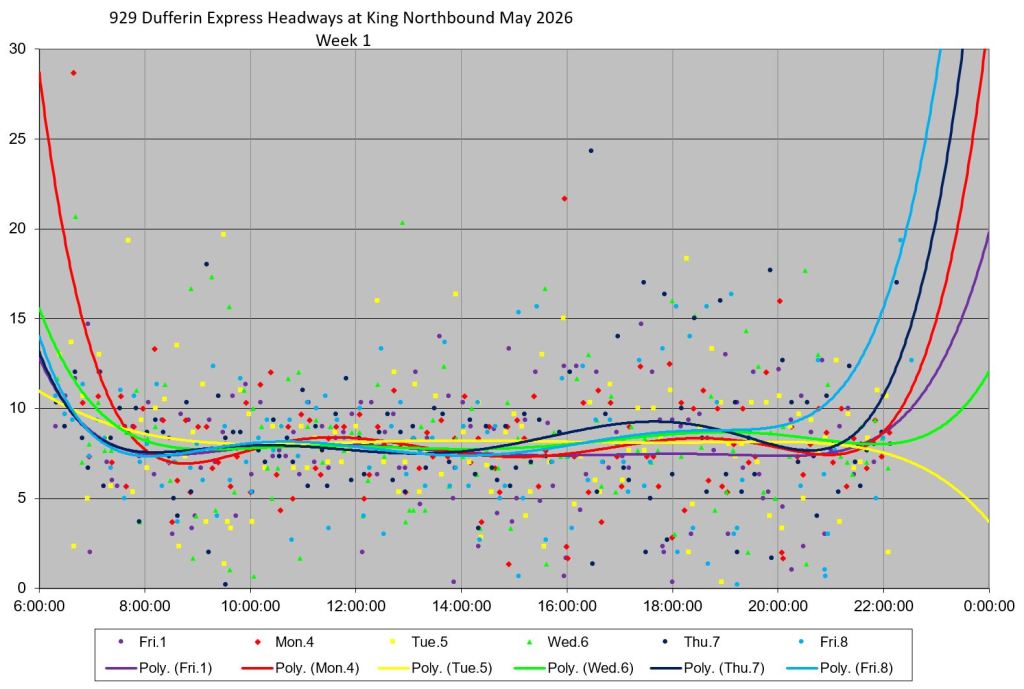
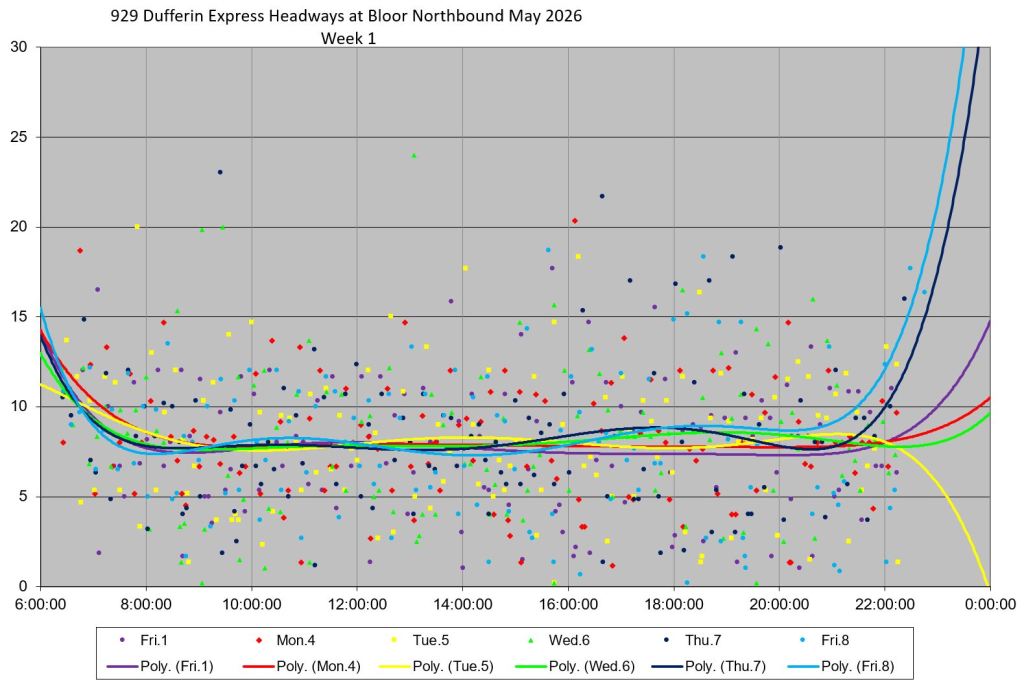
The next charts show the week by week, and weekend detail at King and at Bloor.
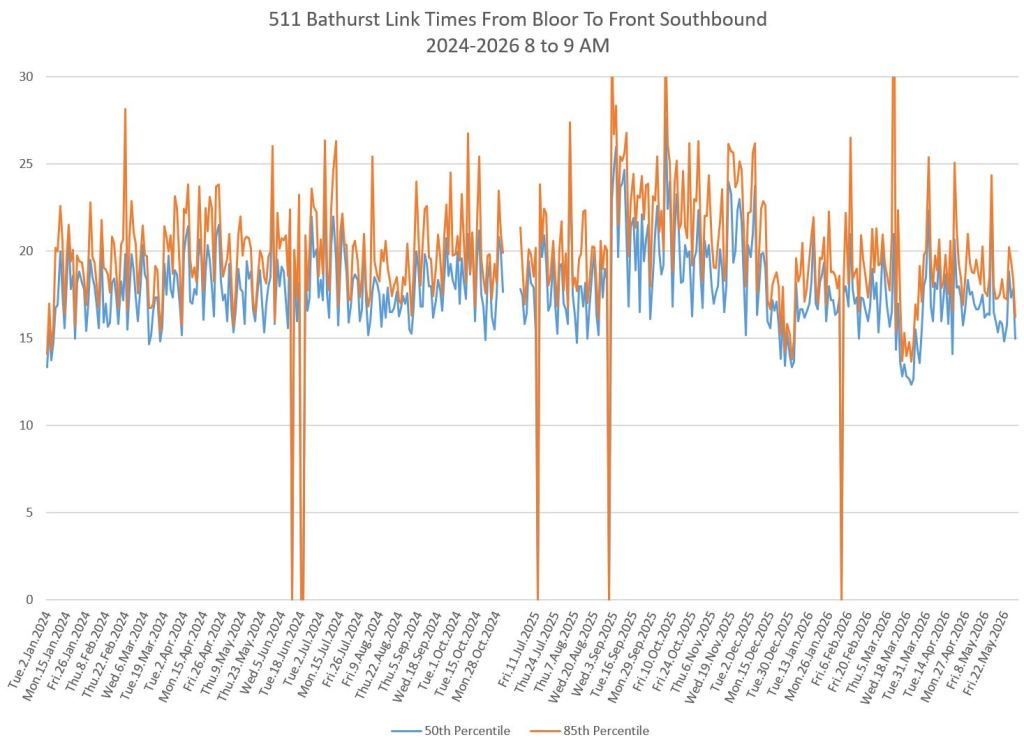
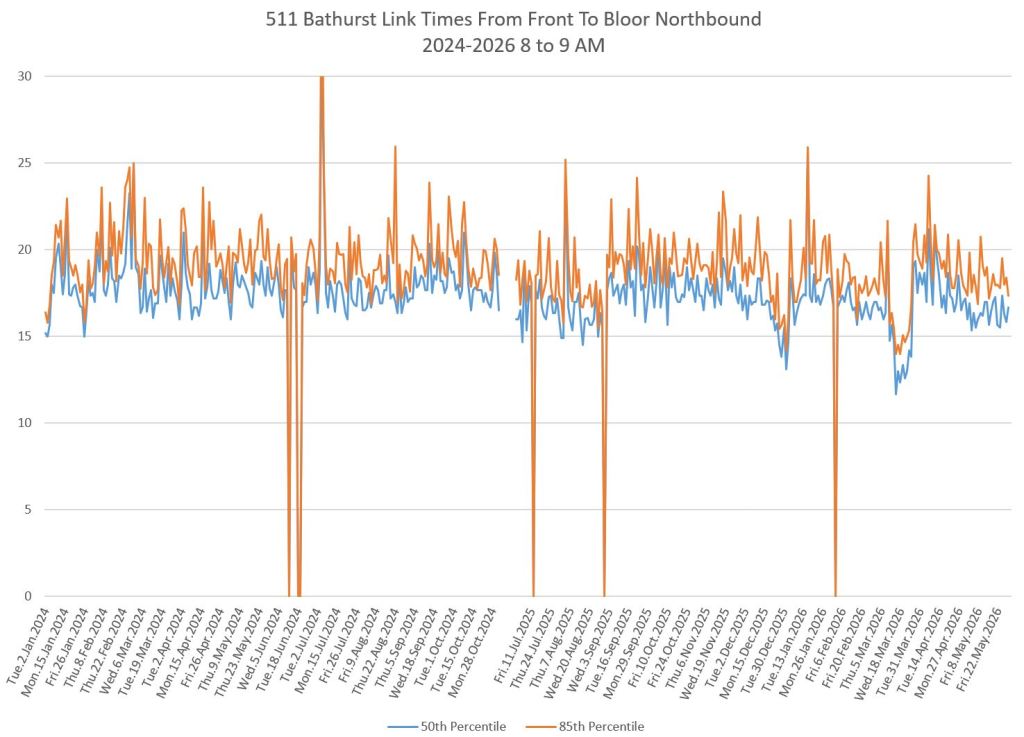
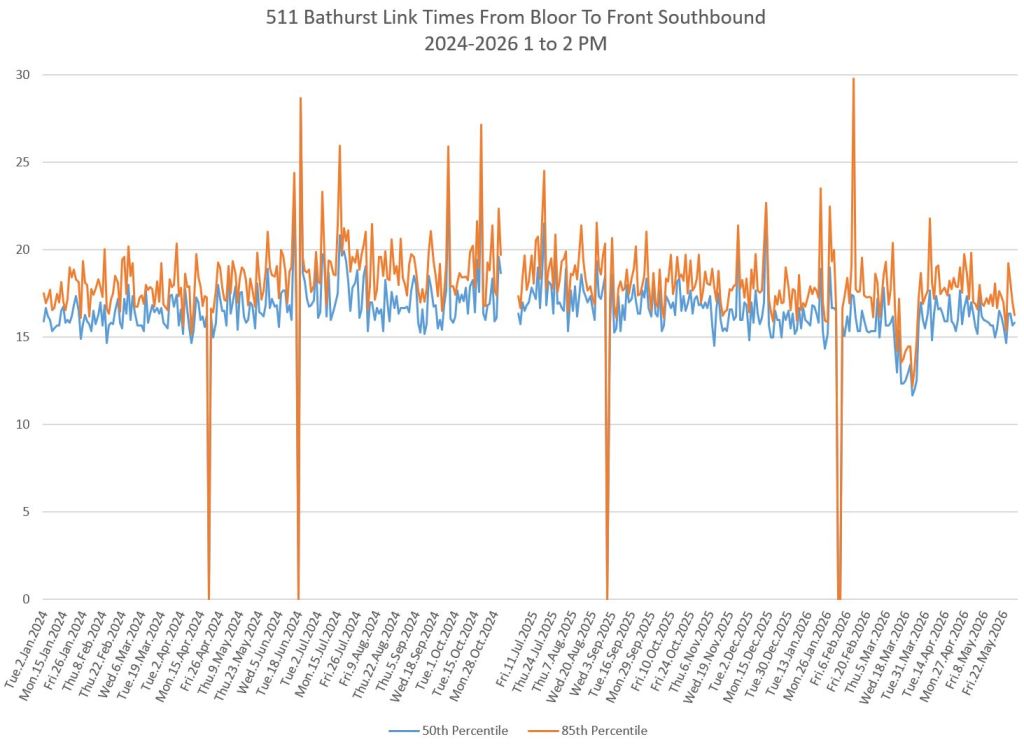
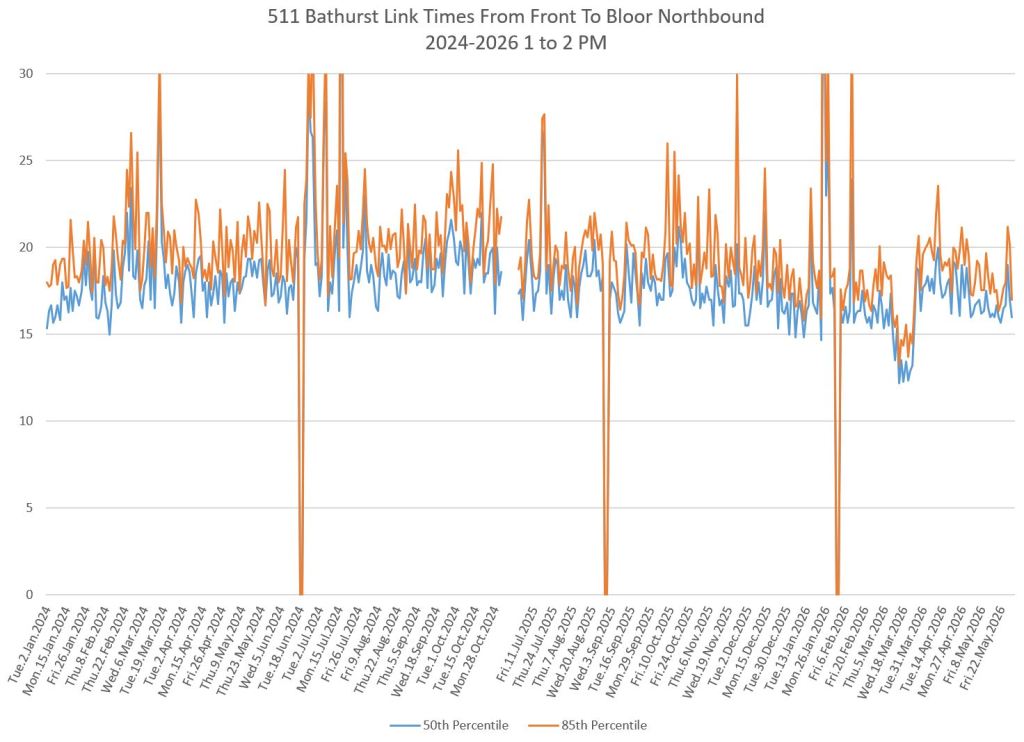
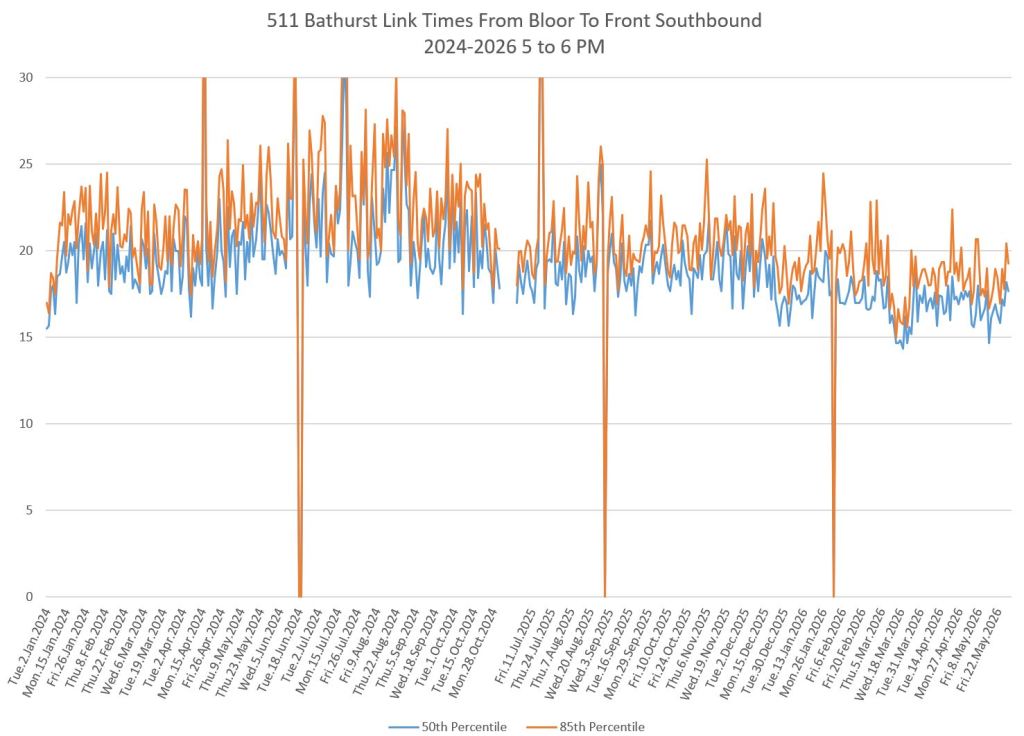
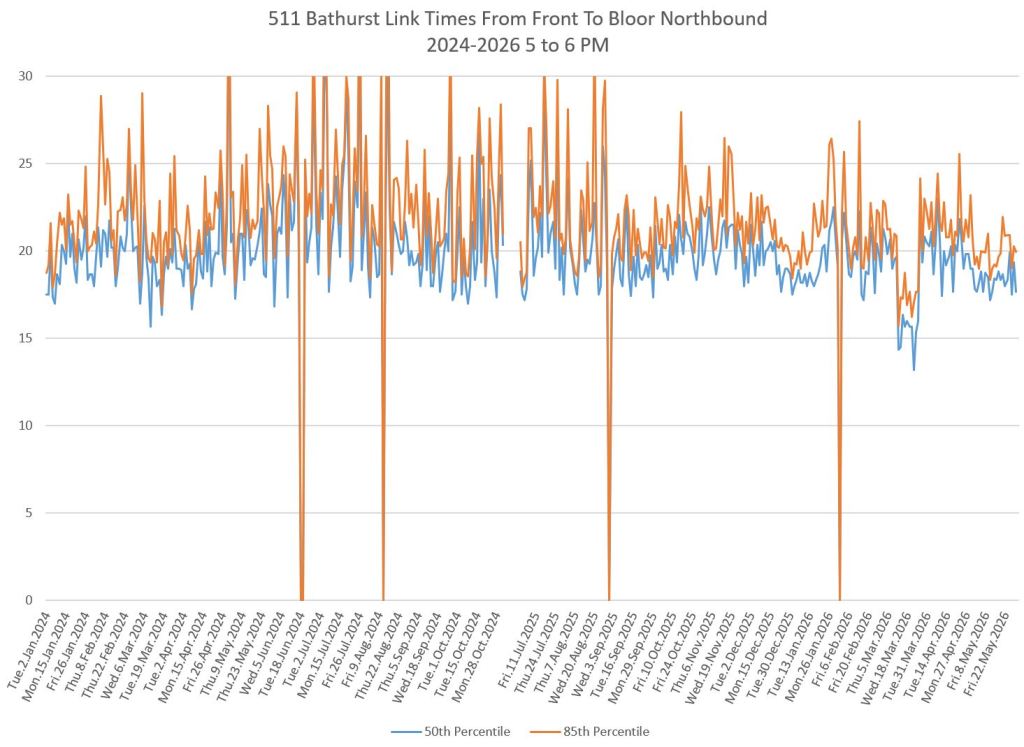
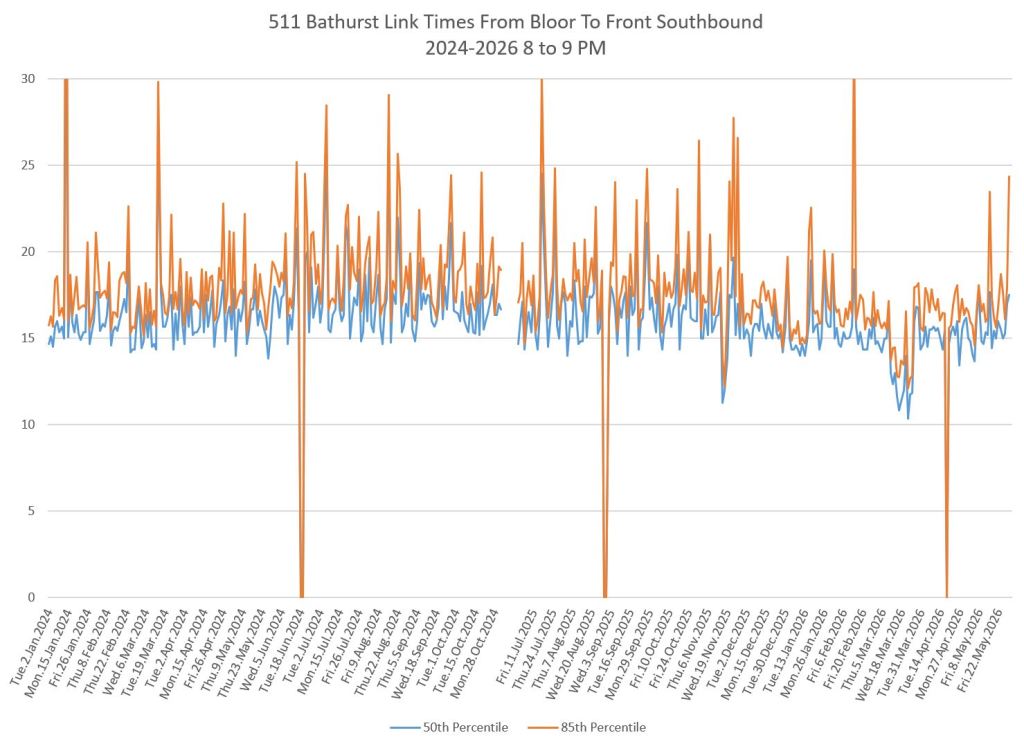
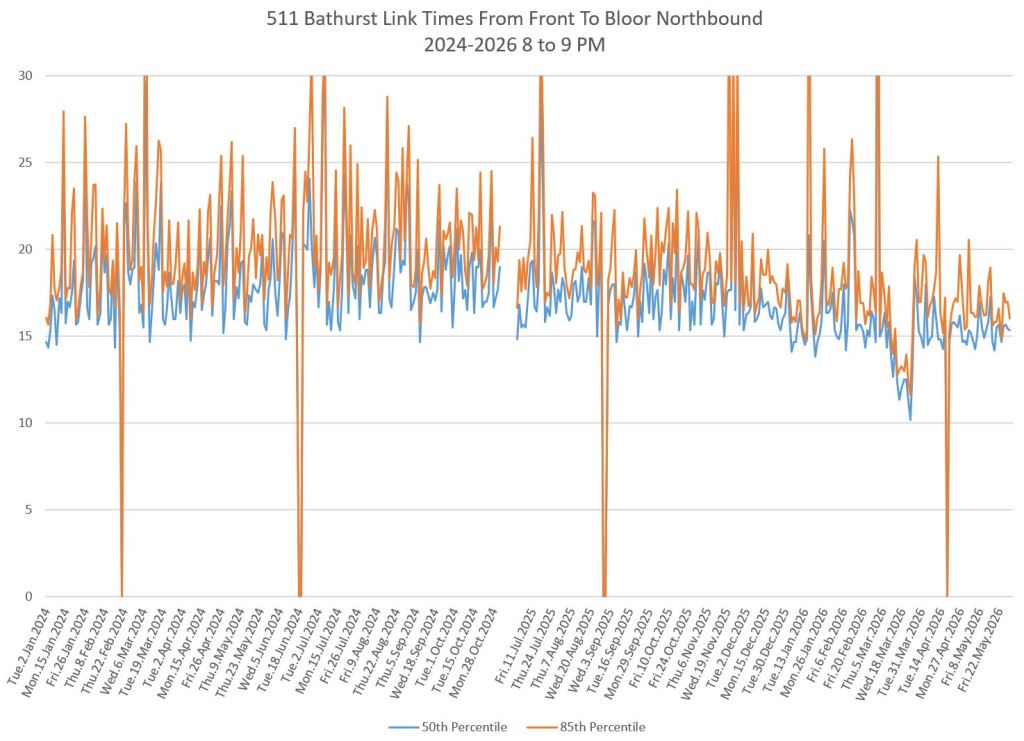
511 Bathurst Between Front and Bloor
A small improvement in travel times is visible in recent weeks. There is not enough data yet, with the painting only recently completed, to assess what the lasting benefit will be. There is also a dip in travel times in mid-March 2026 while the route operated with buses during power repairs at the south end of the route. This illustrates the delays imposed on a streetcar route by slow operation through intersections.
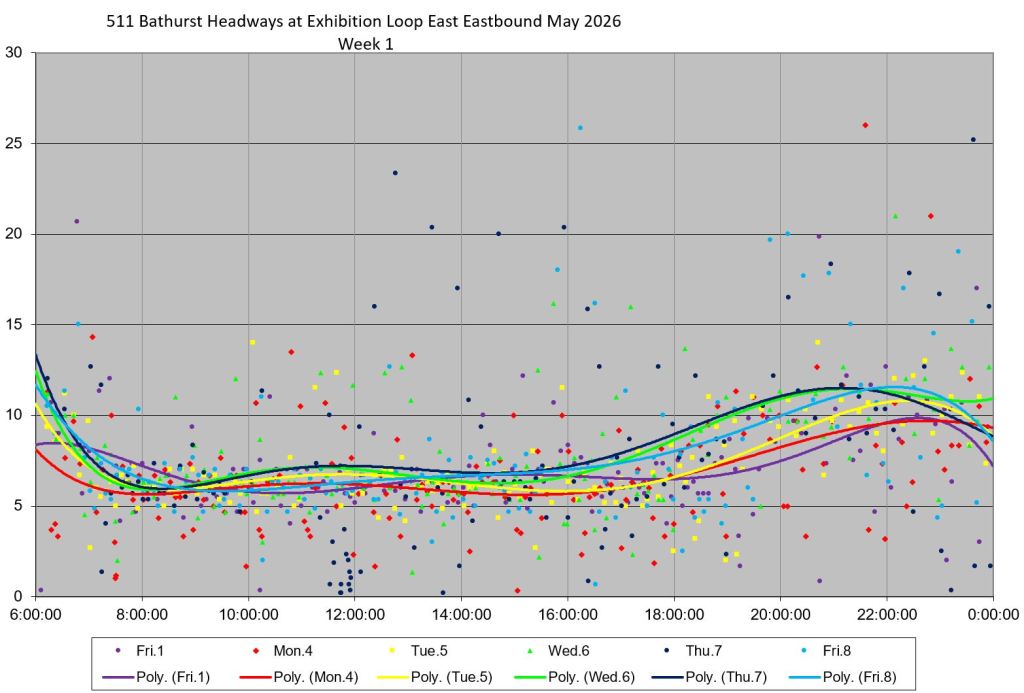
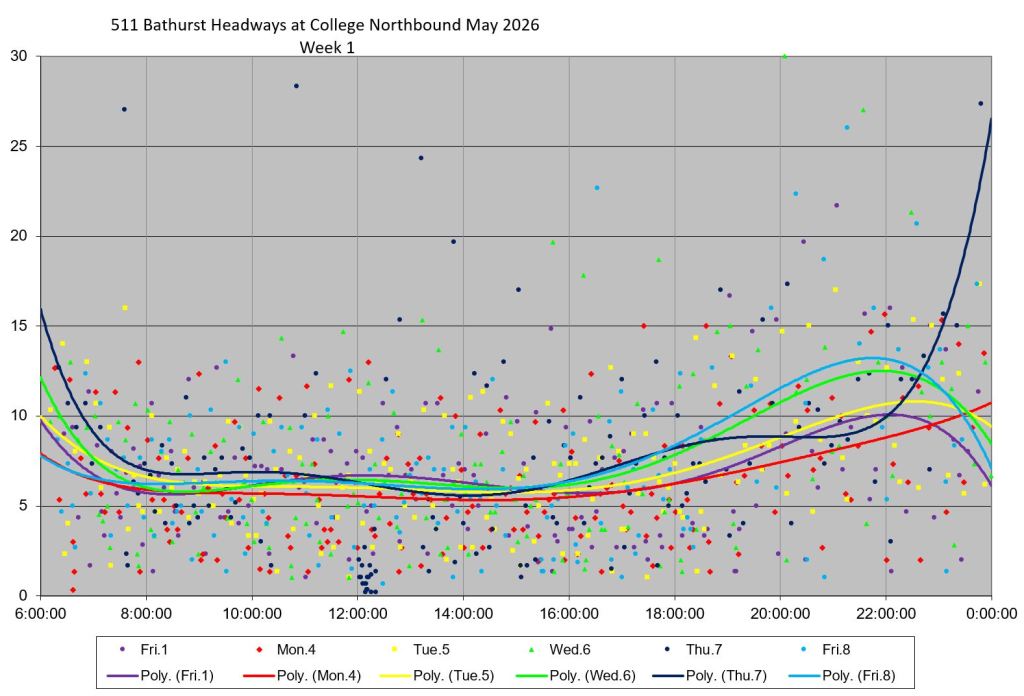
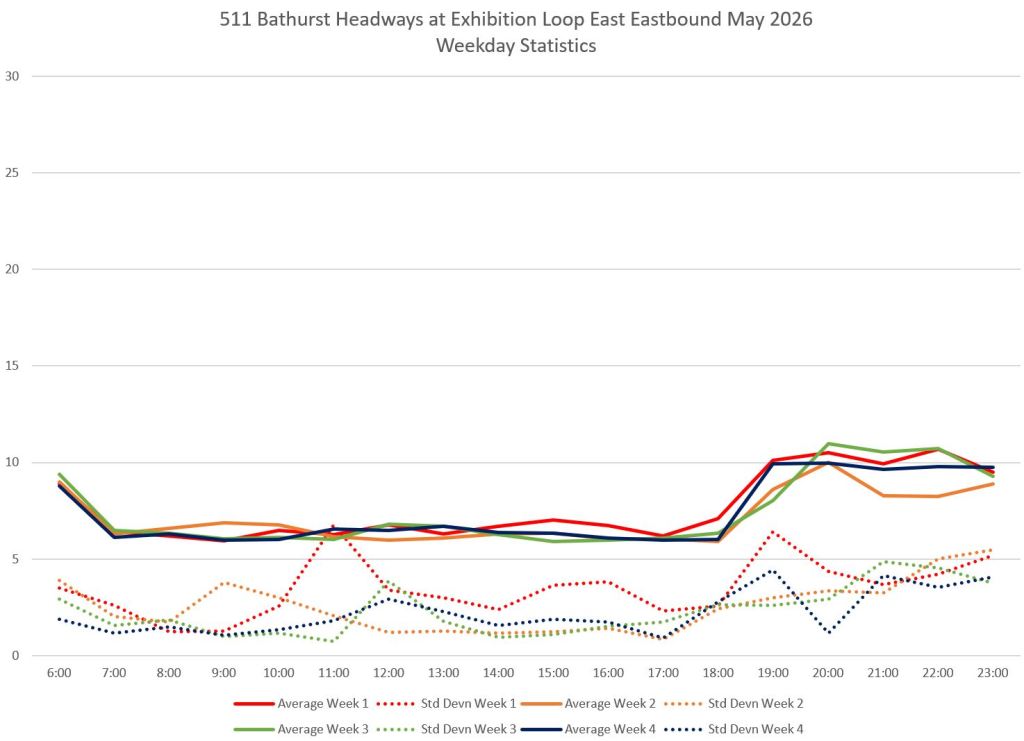
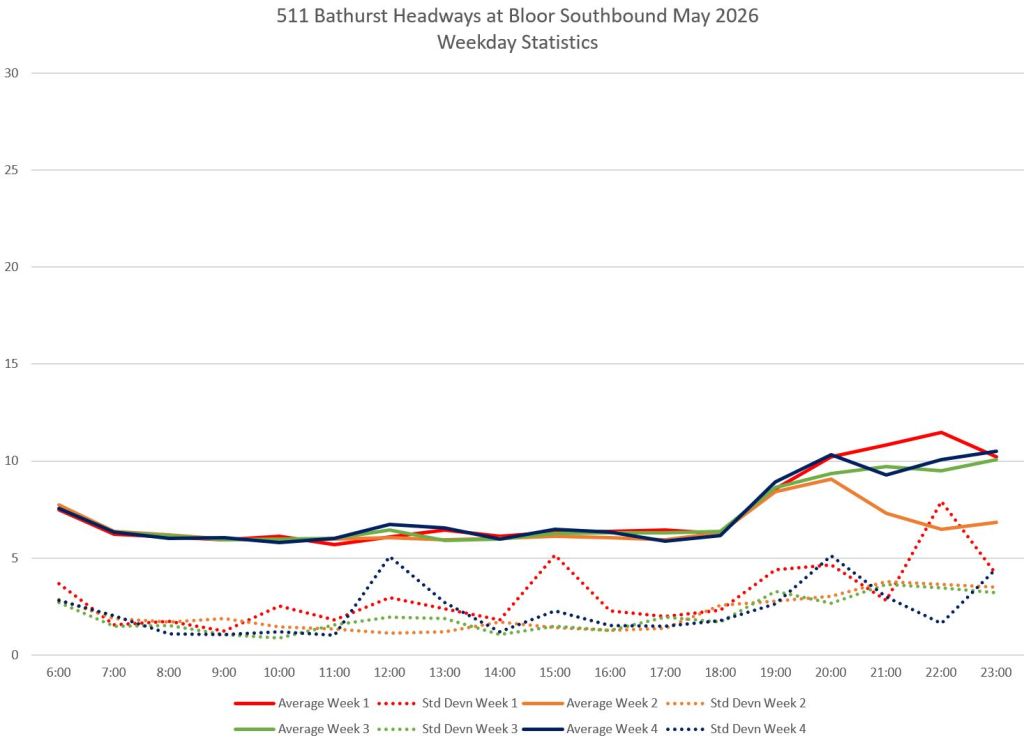
Headway Reliability on 511 Bathurst
It is not sufficient to improve travel times, to the extent this actually happens, if service departs from terminals at irregular intervals. Although the Bathurst car nominally arrives every 6 minutes on paper, actual headways range either side of this goal. As they currently stand, TTC service standards allow a ±3 minute deviation, in other words anything from 3 to 9 minutes is considered an acceptable spacing. Most riders will see the gap and the gap cars will be more crowded than average stats might suggest.
The first problem lies in erratic departures from terminals. Here are the headway stats at the terminals and at midpoints for May 2026. The dotted lines are standard deviations, a measure of the scatter of data values. Note that they are higher for northbound trips from Exhibition, and the mid-route values are higher than those at trip origins. This is the typical pattern of bunched cars getting closer together, and gaps getting wider. Although the averages sit at the six minute line, the scheduled service, individual arrivals are not as regular.
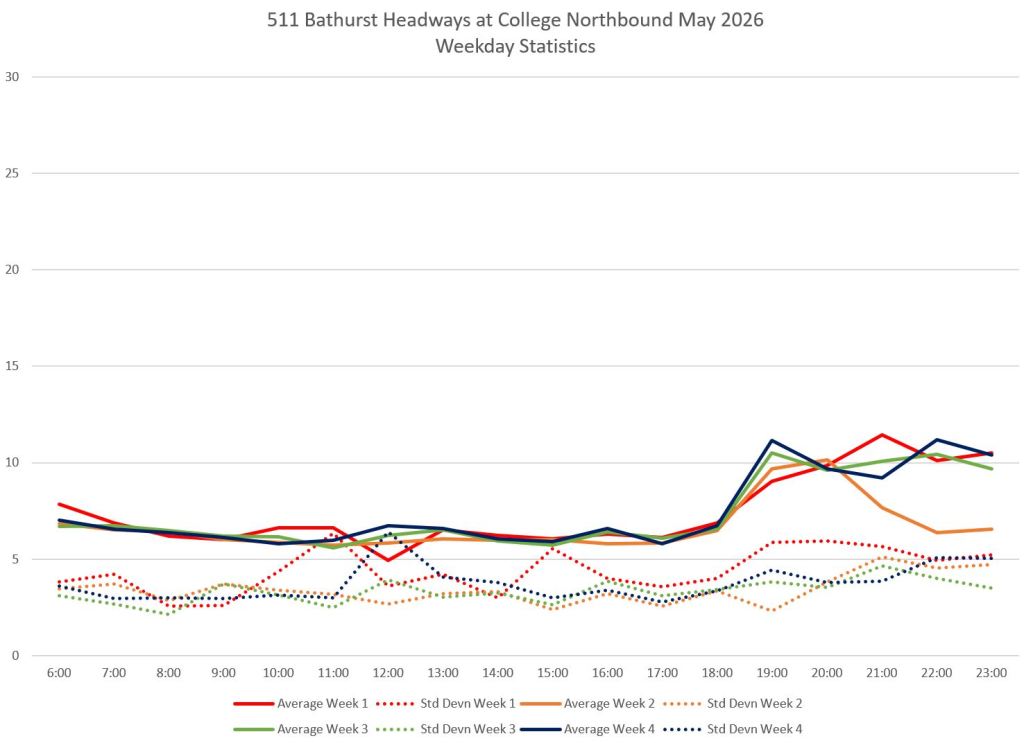
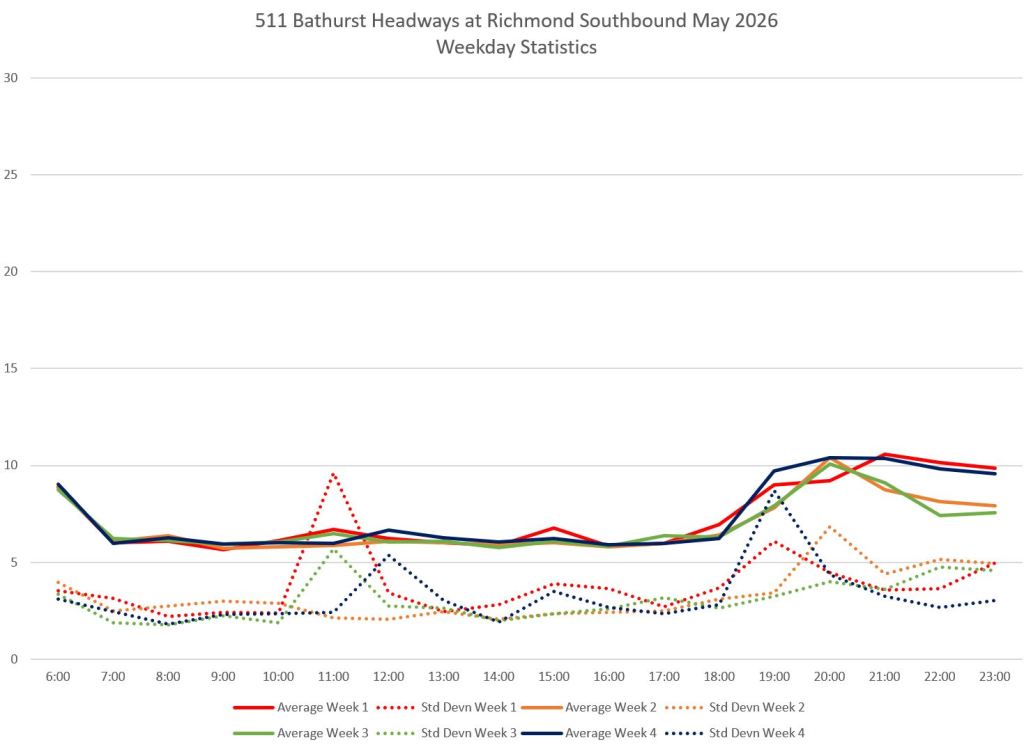
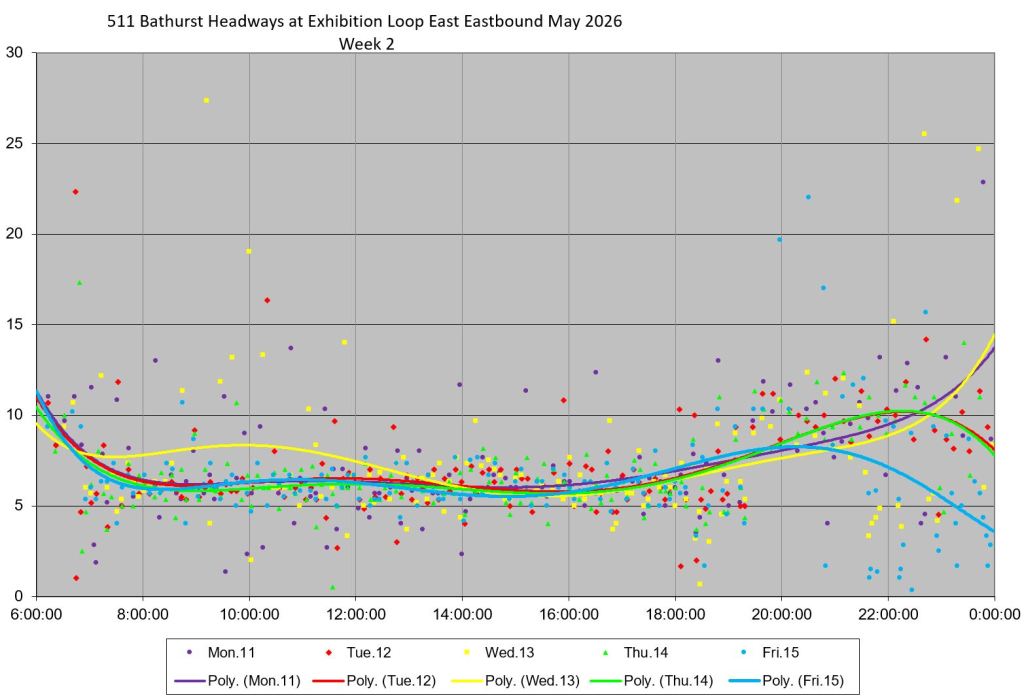
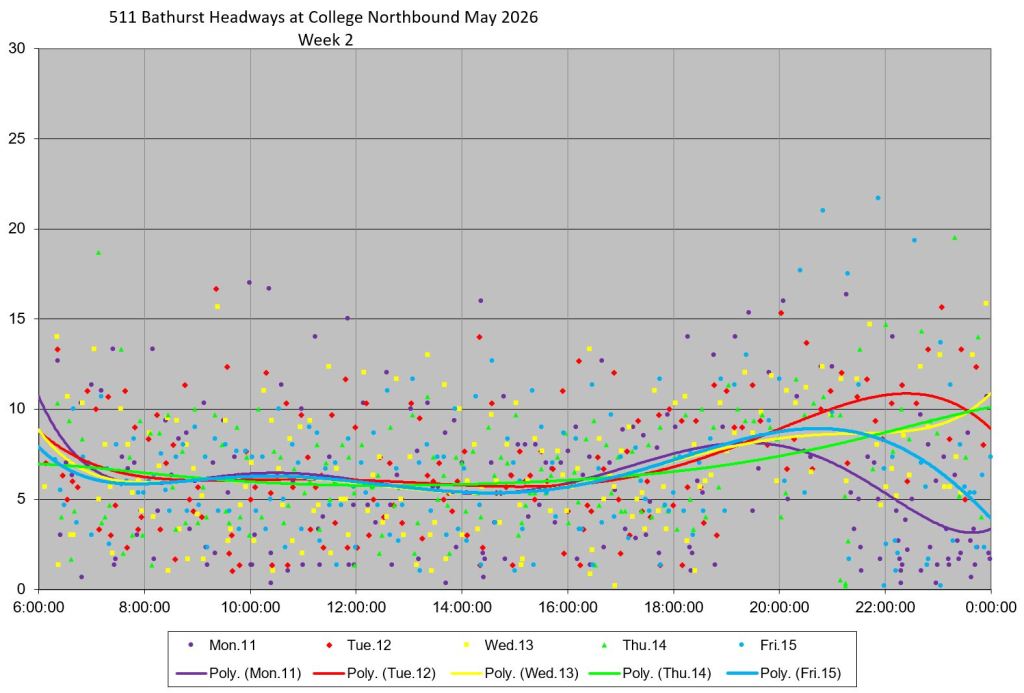
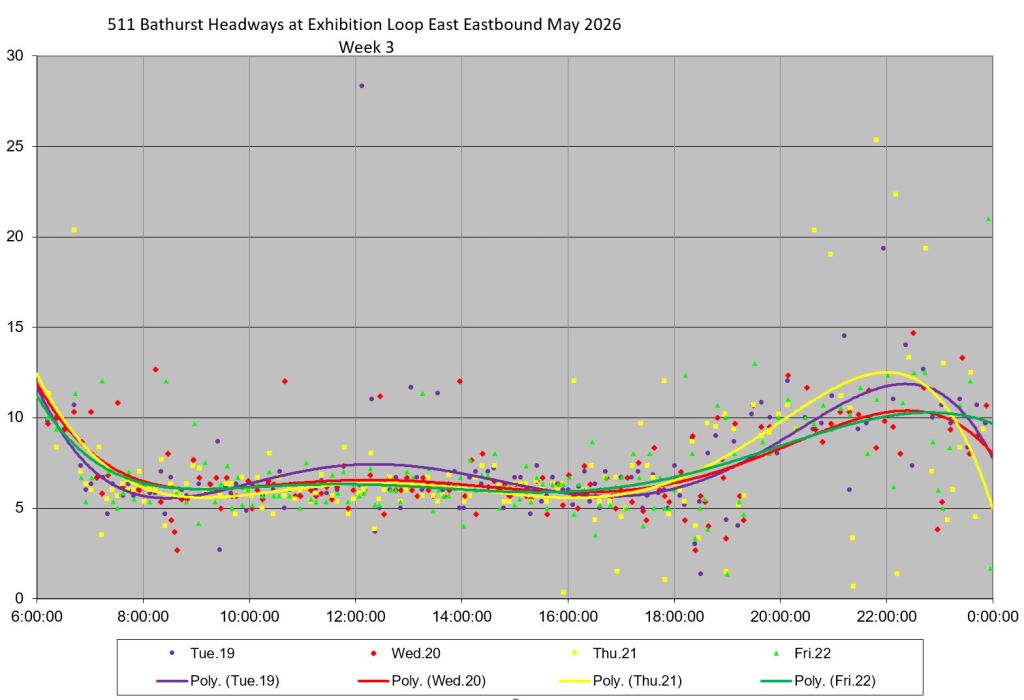
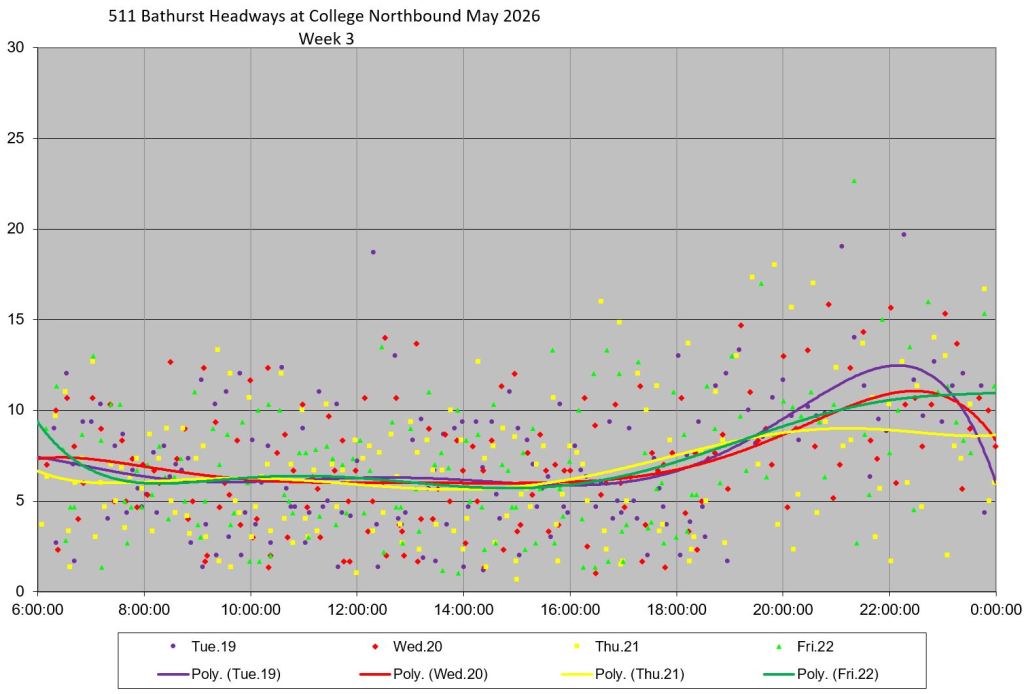
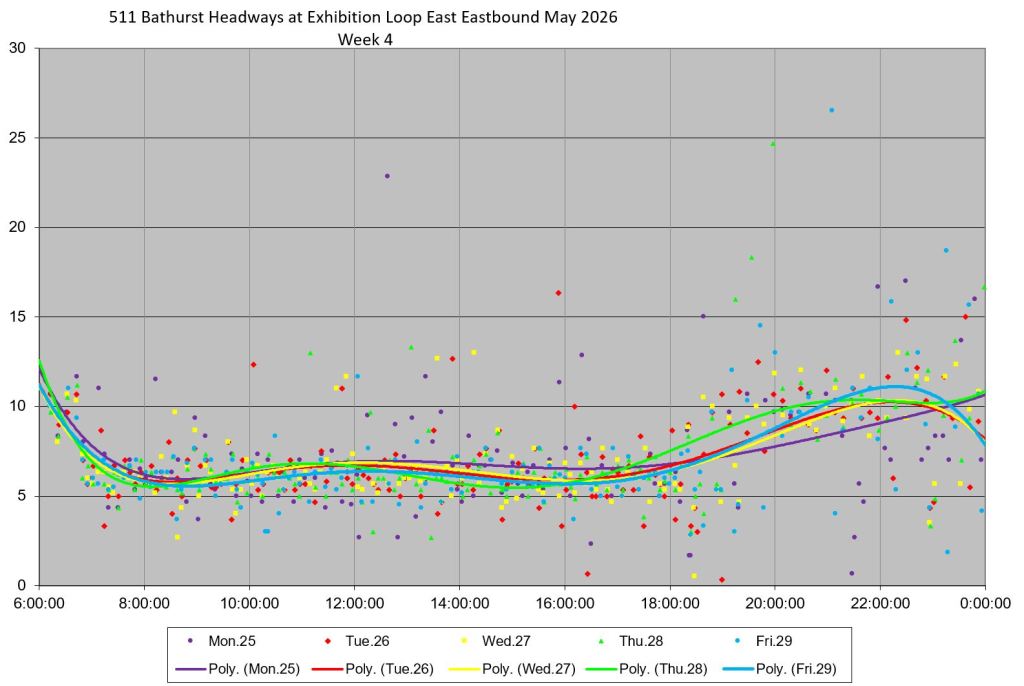
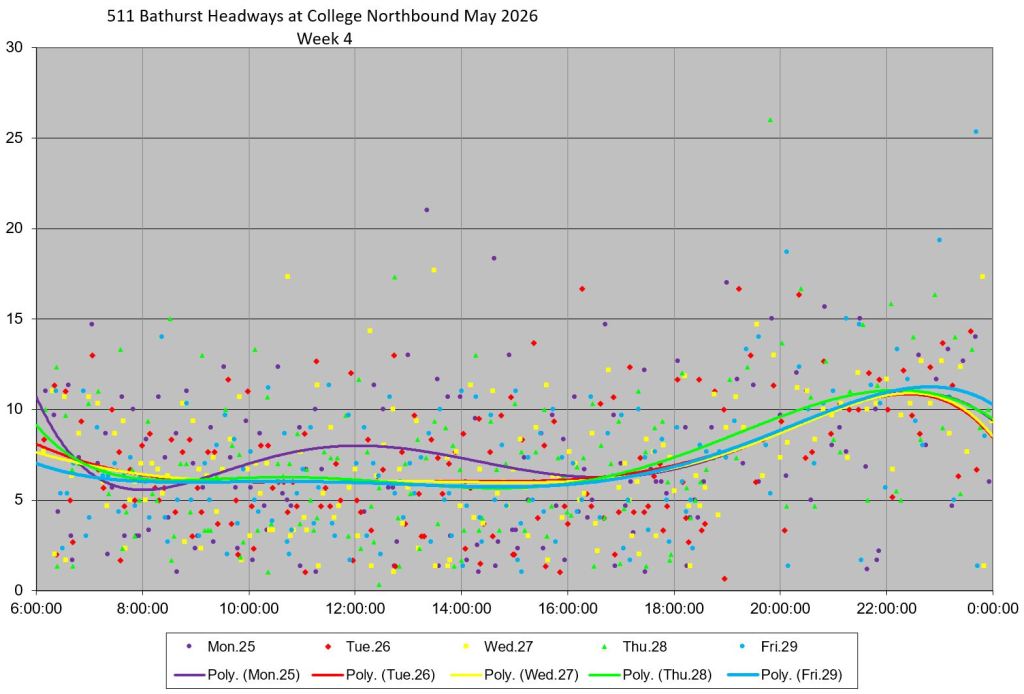
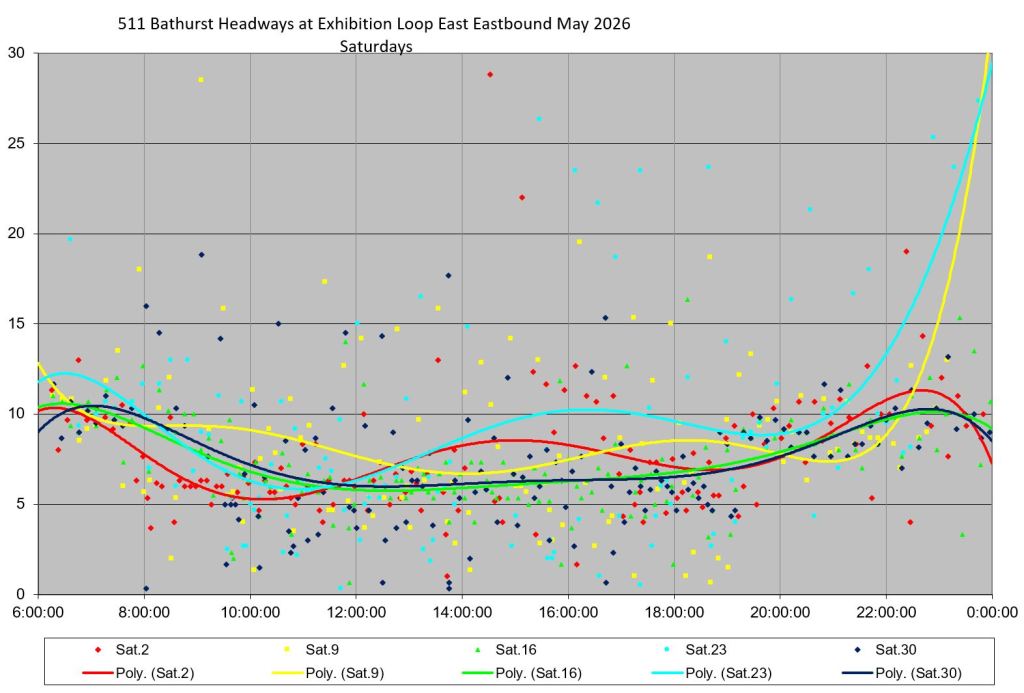
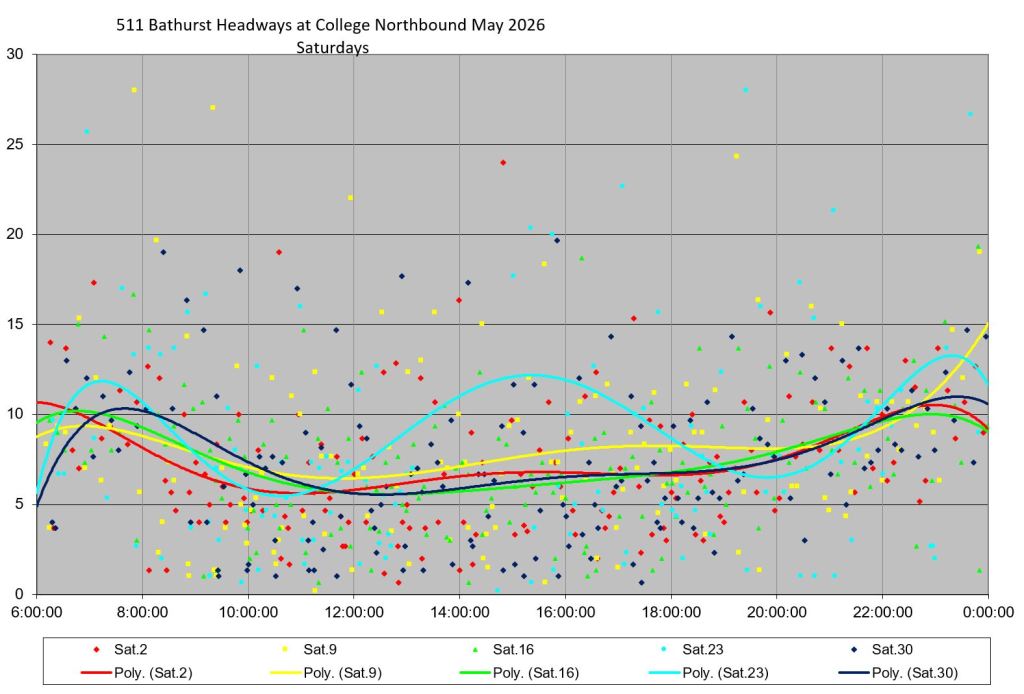
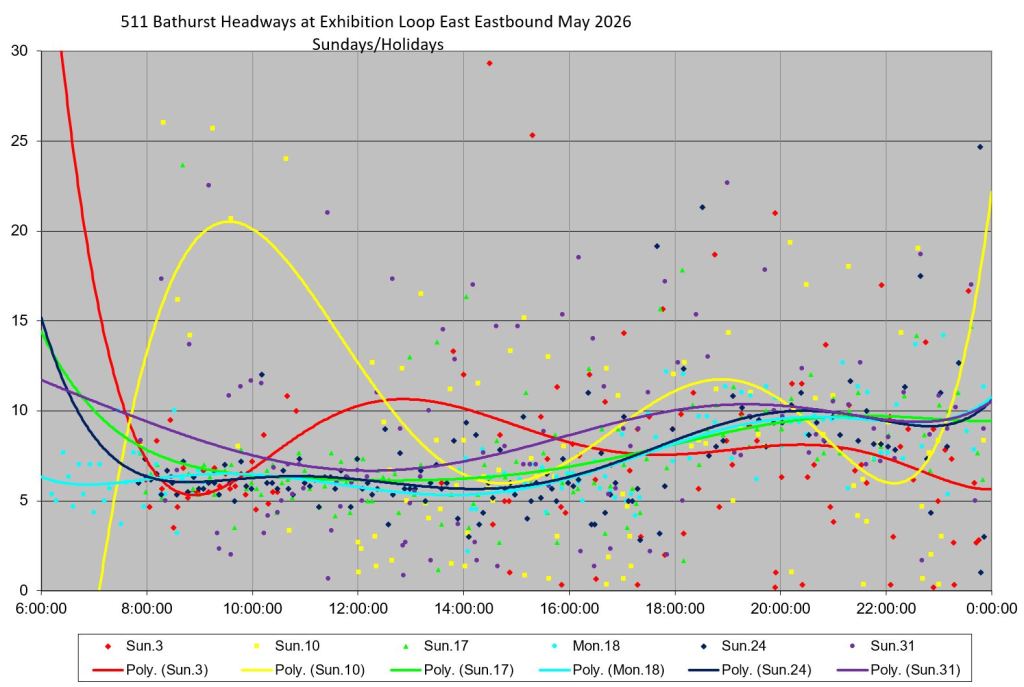
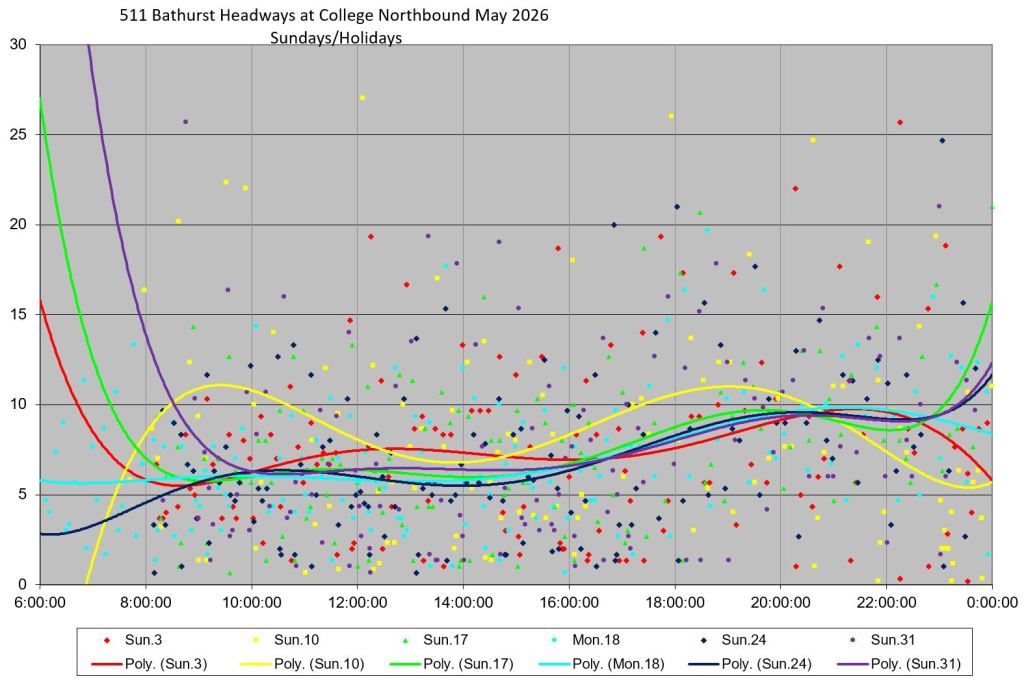
Here are the week by week plots of individual headways leaving Exhibition Loop and northbound at College. Weekend data are also shown. It is quite clear that actual headways are widely scattered at some times, particularly on weekends. Southbound data are not quite as bad, but still not anywhere near the consistency one expects.
This shows how the benefit of the red lanes is lost because of erratic service spacing. The TTC has a “bunching and gapping pilot”, but it is clear that 511 Bathurst needs a lot of work.