
With the opening of Line 5 Eglinton on February 8, the former 35 Jane bus was split in two. This article reviews the headway reliability on the new services, with a look back at November 2025 as a comparison. Service in the Jane corridor was notoriously erratic. It has been proposed as a RapidTO red lane route, but nothing has actually been implemented yet.
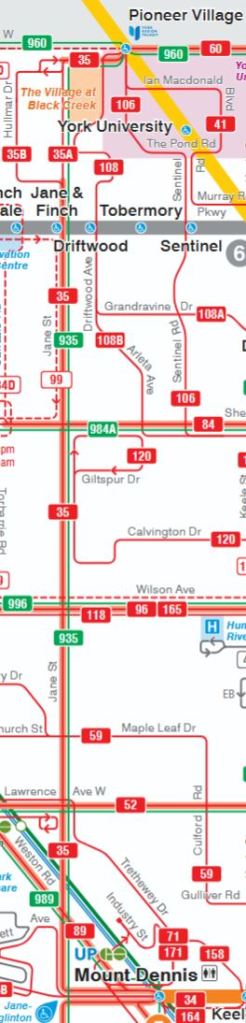
The original service operated from Jane Station to Pioneer Village Station. At the north end, the service divides with half of the buses running via Jane to Steeles, and half via Hullmar. This arrangement is preserved in the new 35 Jane whose southern terminus is Mount Dennis Station. (Map on the left below)
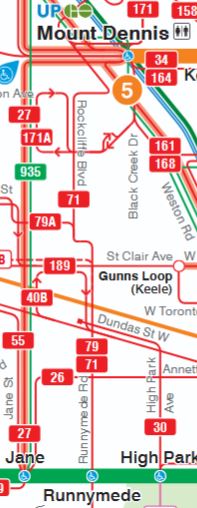
The new 27 Jane South route runs from Mount Dennis Station to Jane Station. (Map on the right)
There was no change in the 935 Jane Express which continues to run directly between Jane and Pioneer Village Stations.
By comparison with the service in Fall 2025, operations on the 27/35 route pair are an improvement, but this starts from a very low bar. Headways along the route are scattered over a wide range of values making service for riders quite unpredictable. There is no change in service behaviour over the three month period indicating that there was no effort to improve performance, or there was, it had no effect.
Introduction
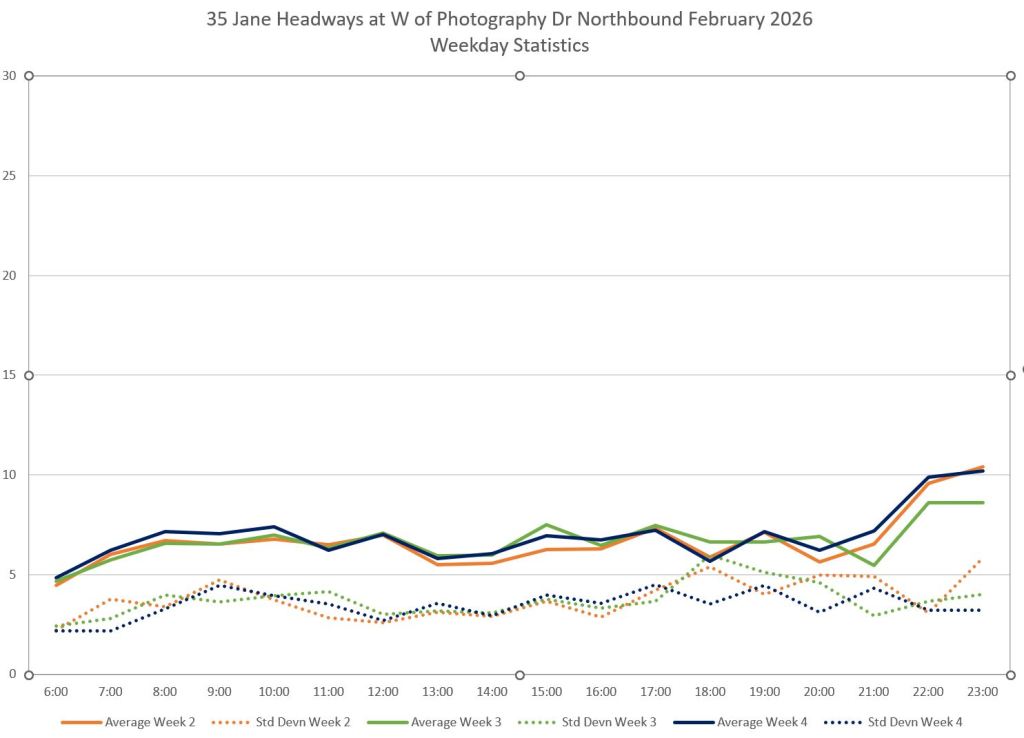
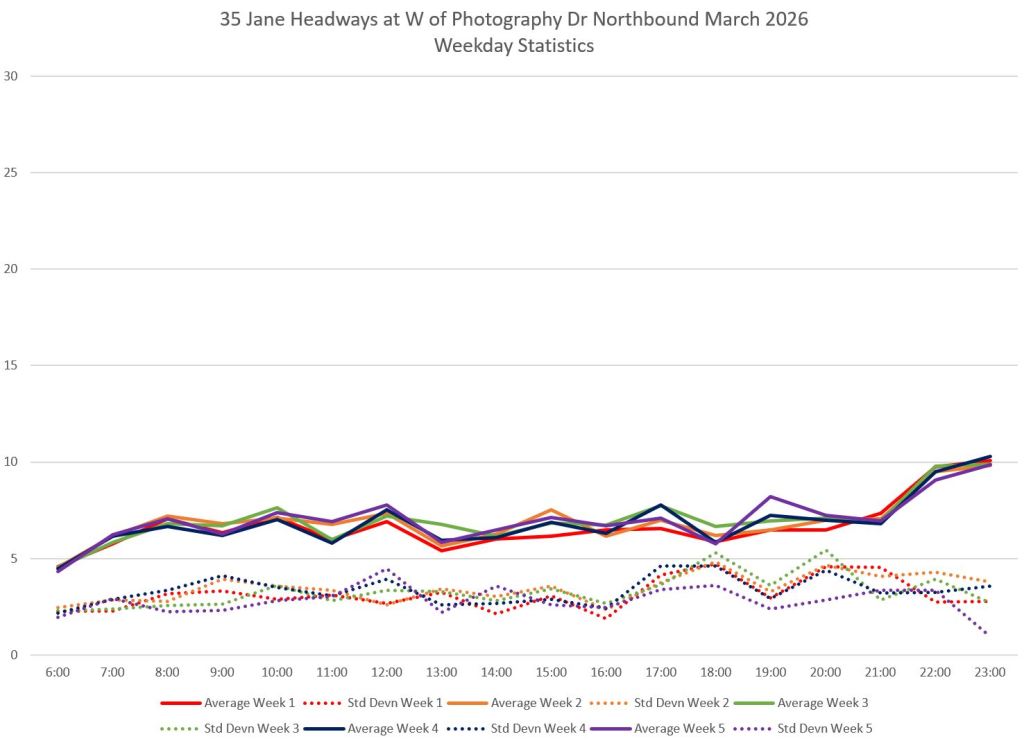
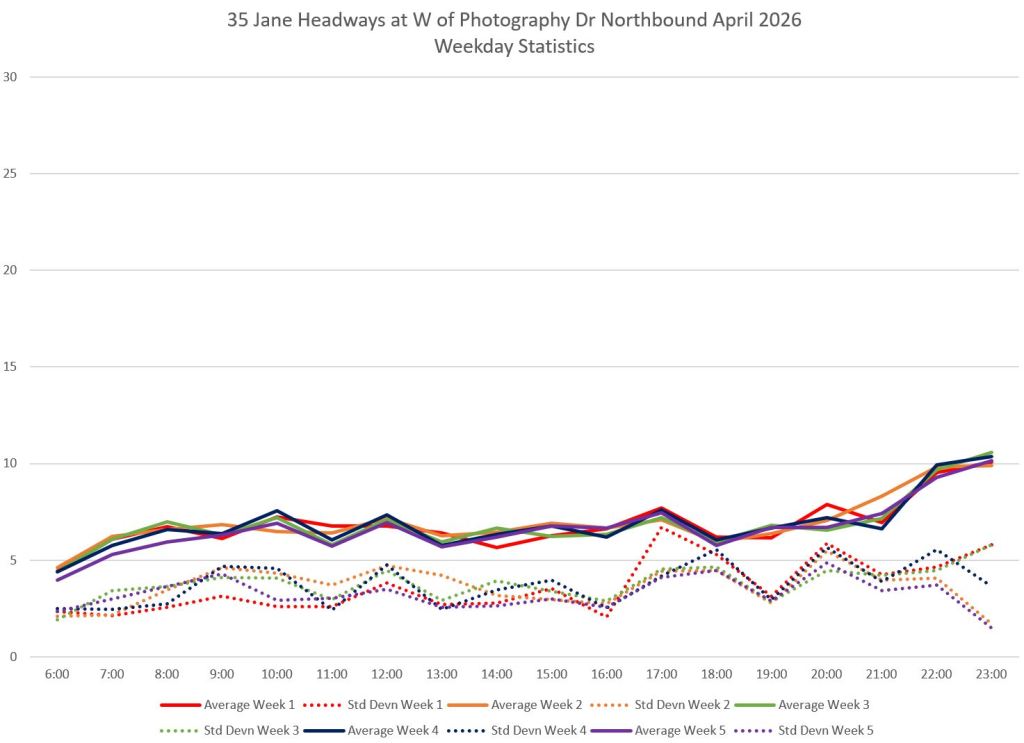
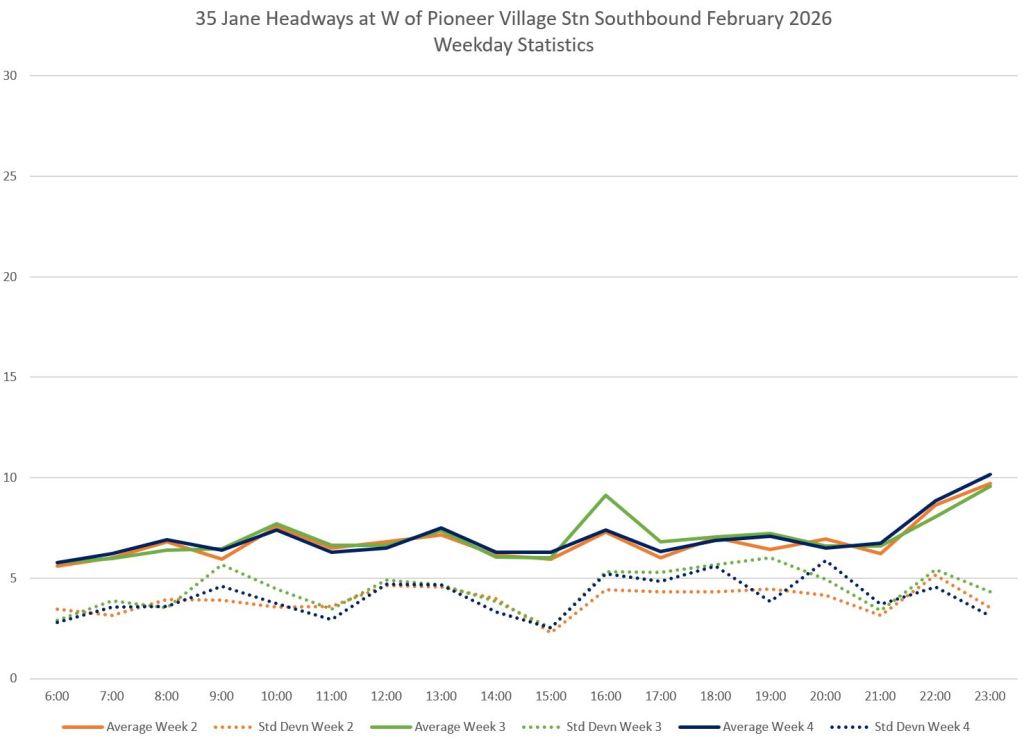
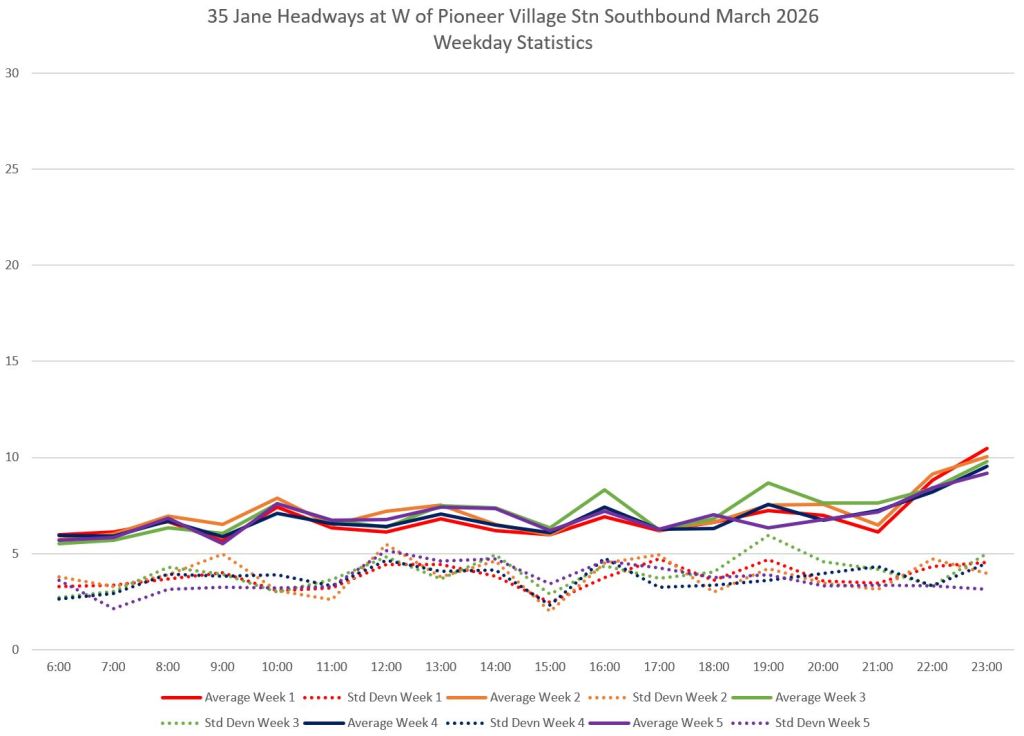
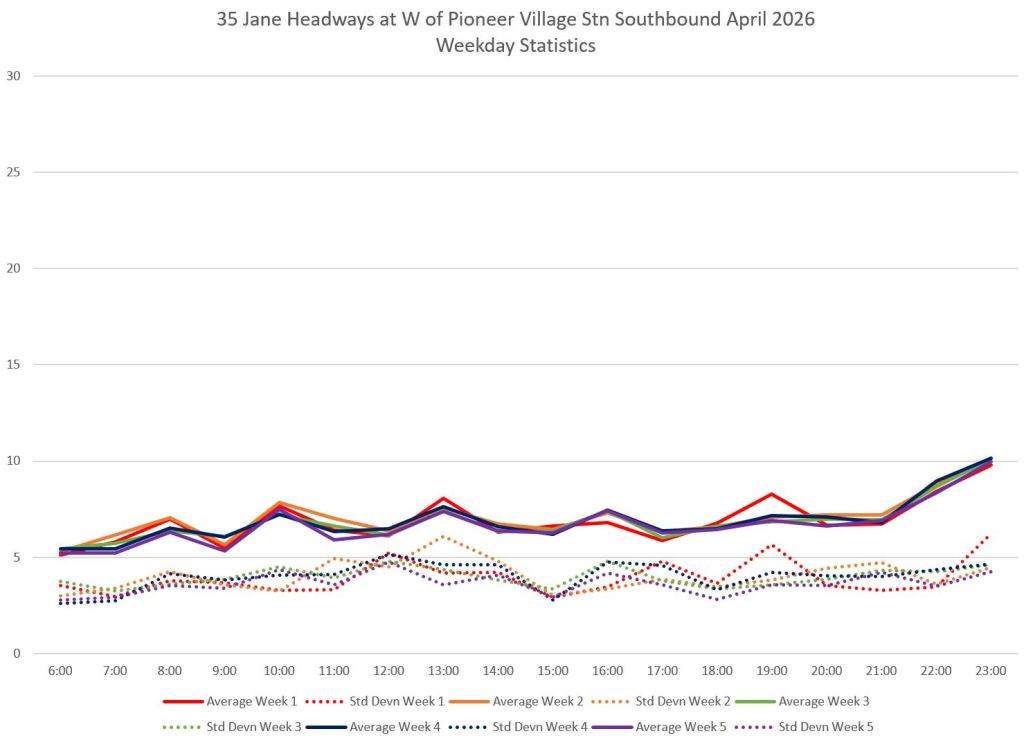
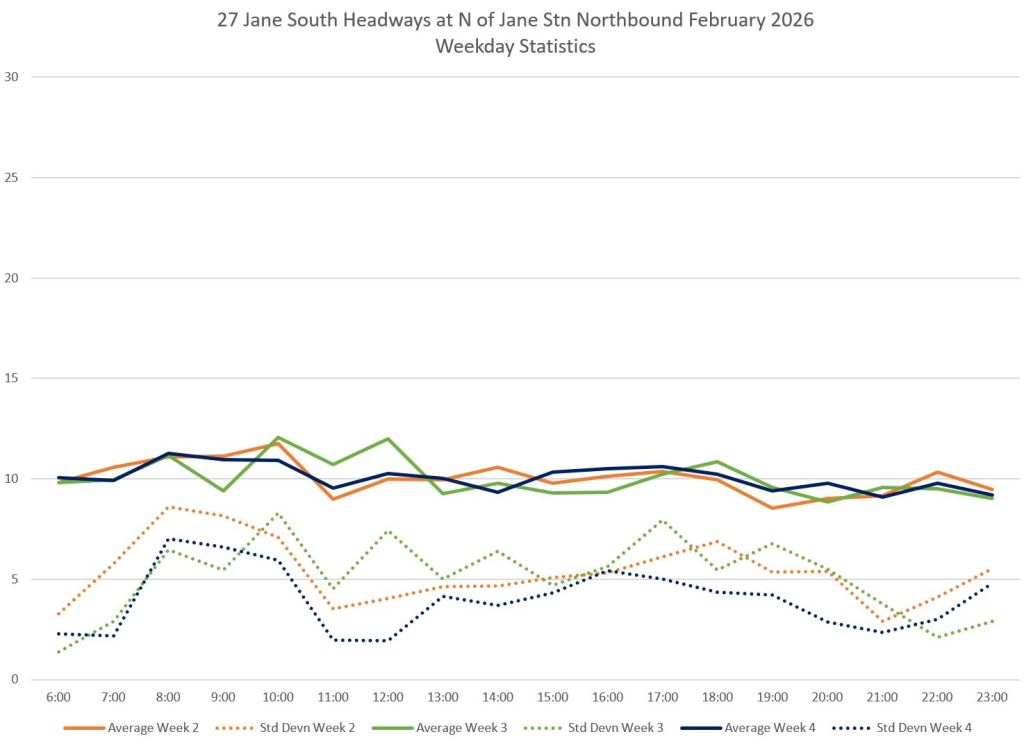
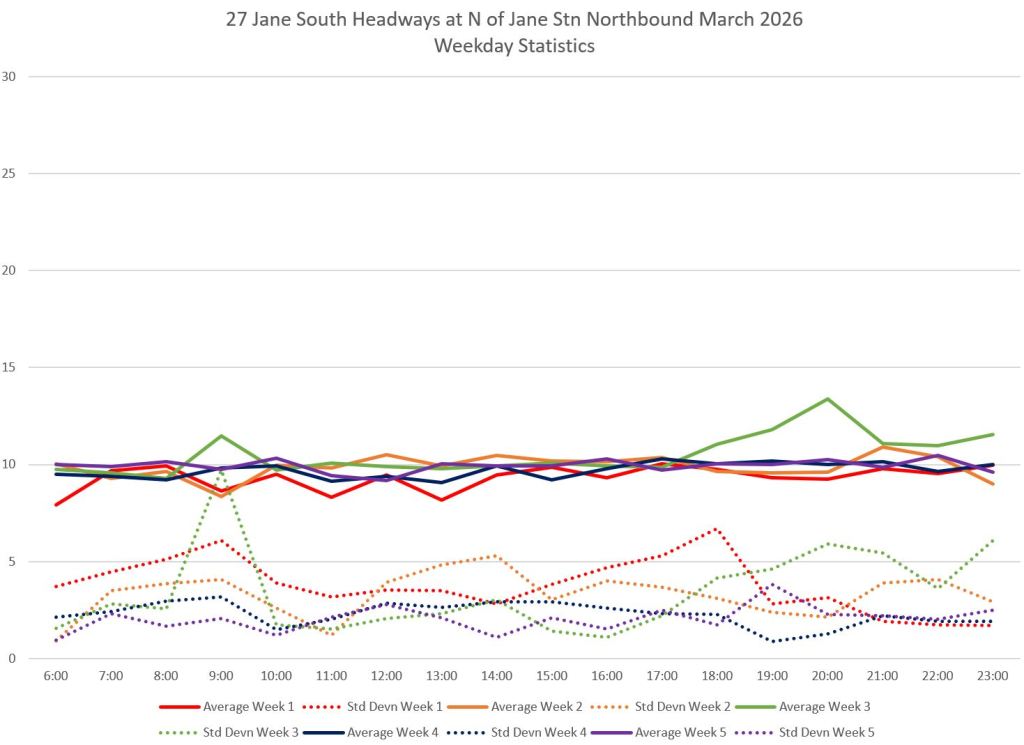
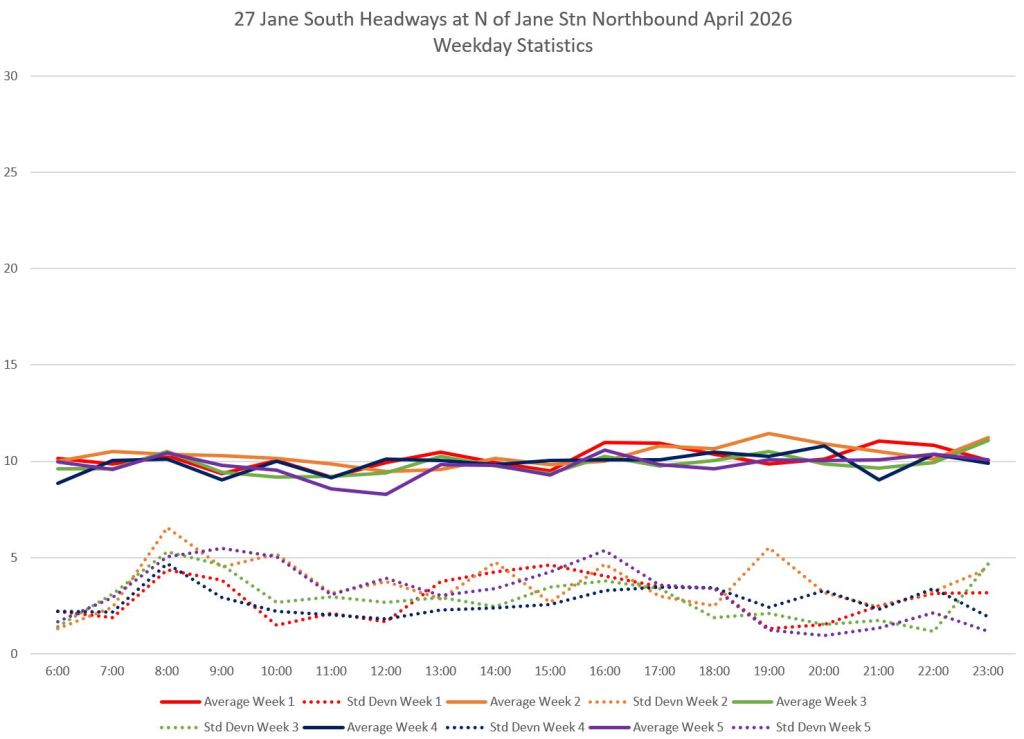
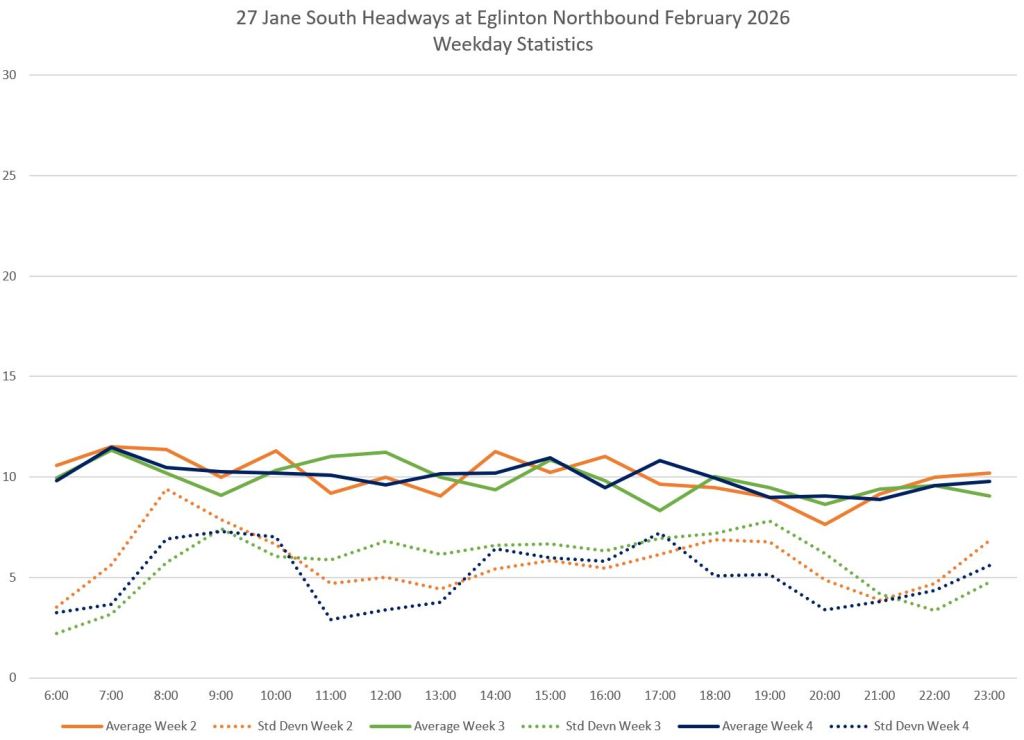
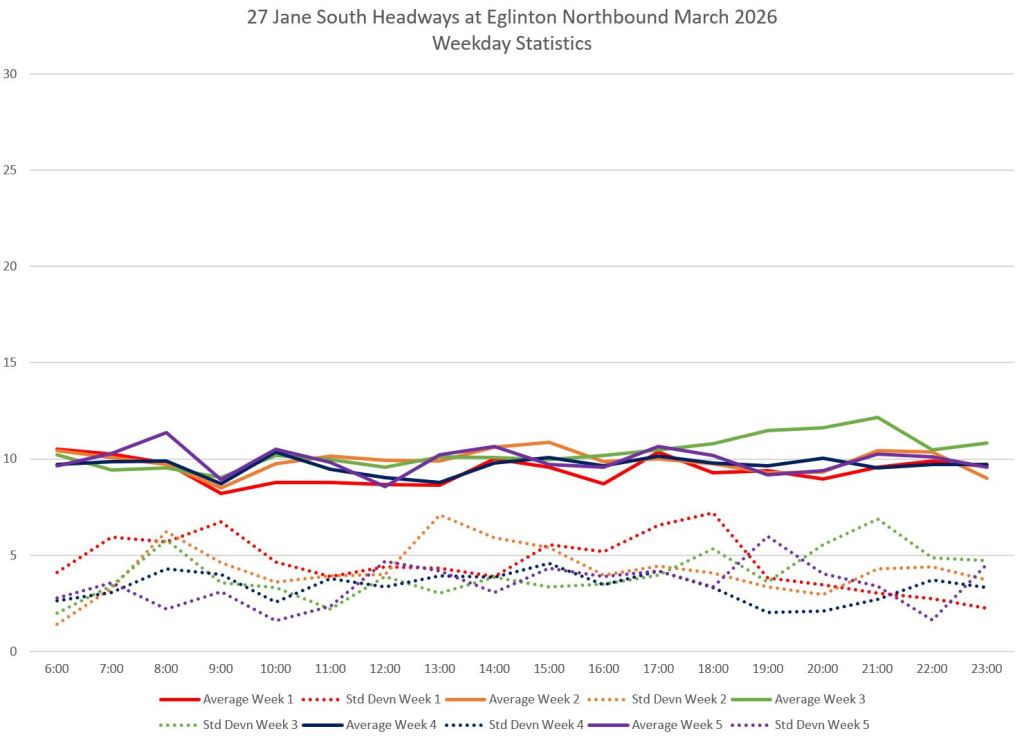
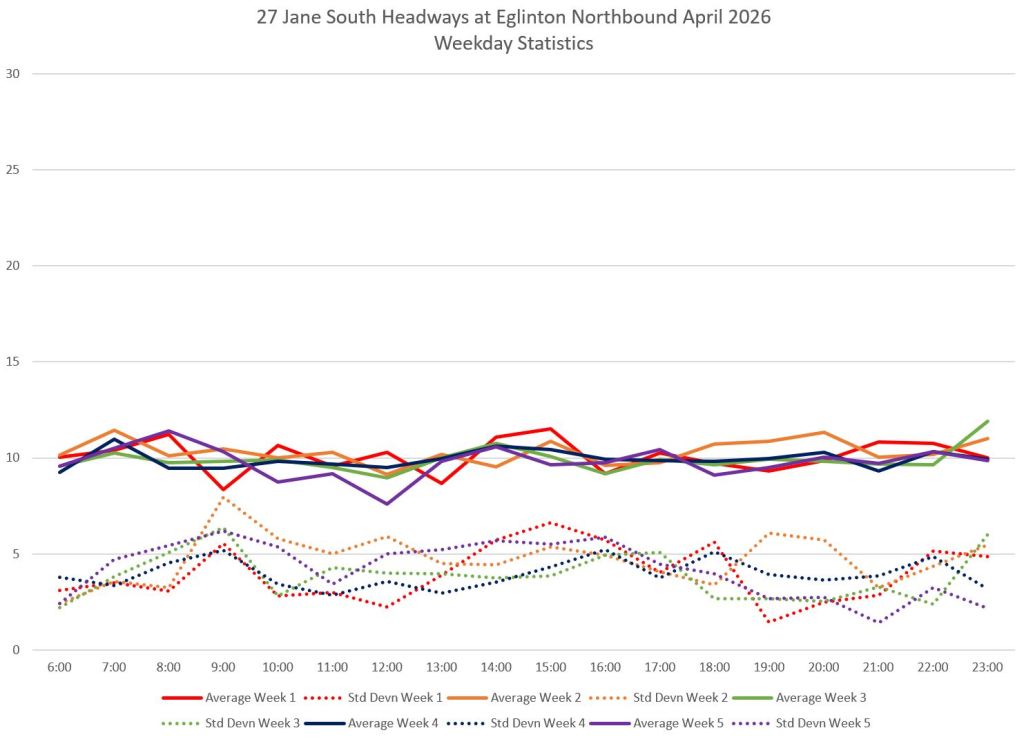
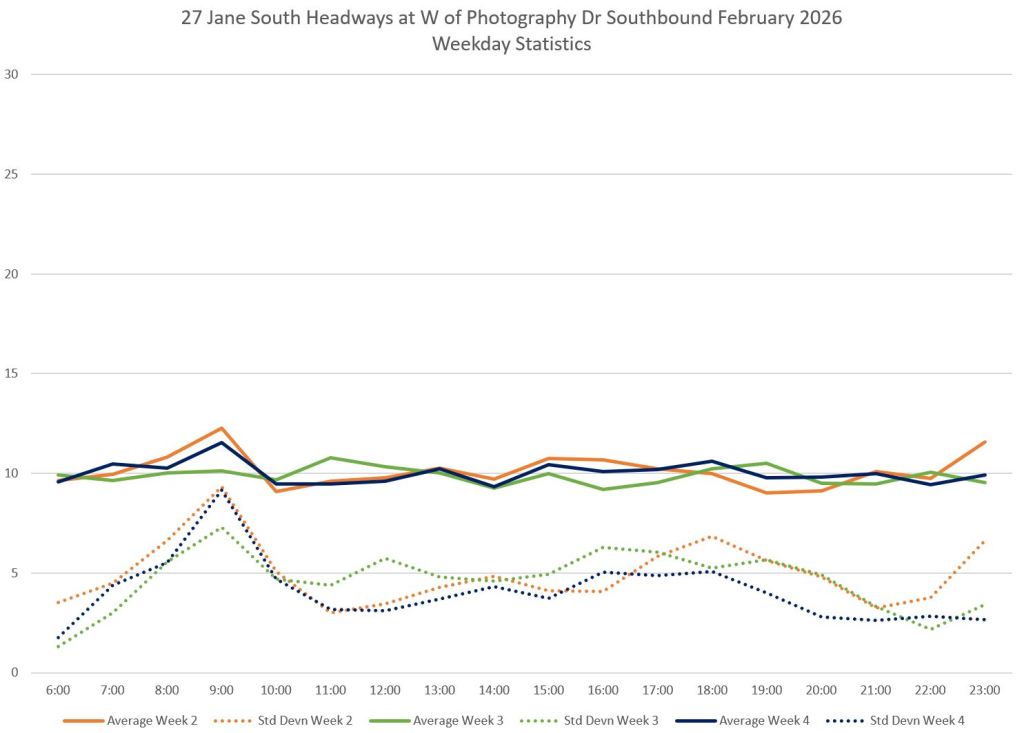
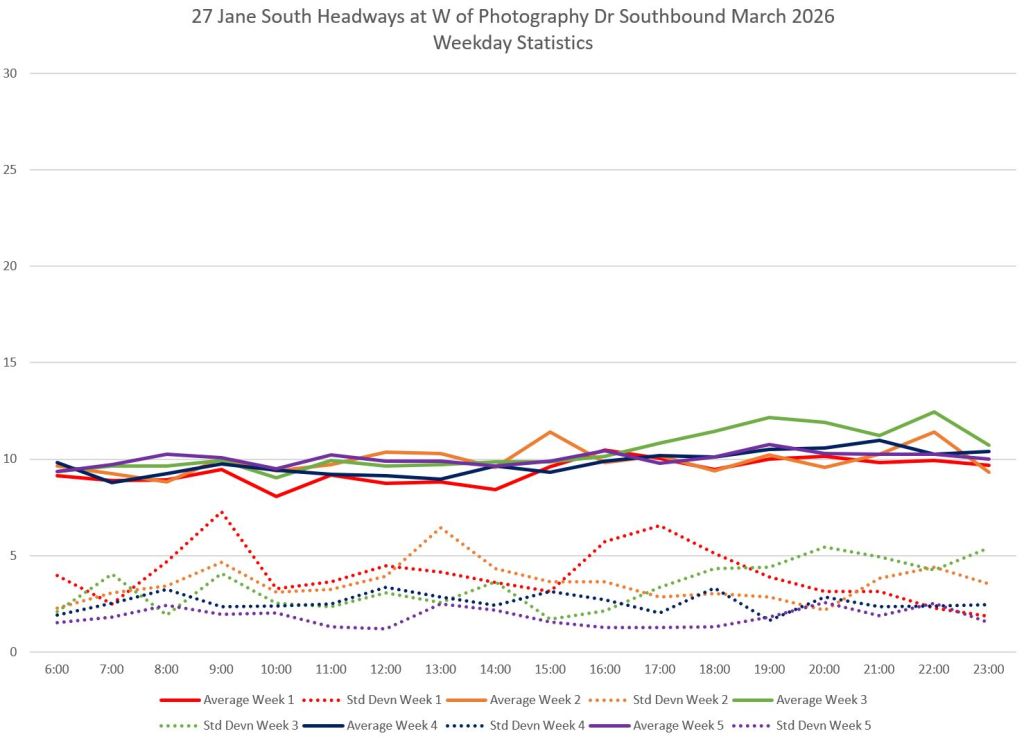
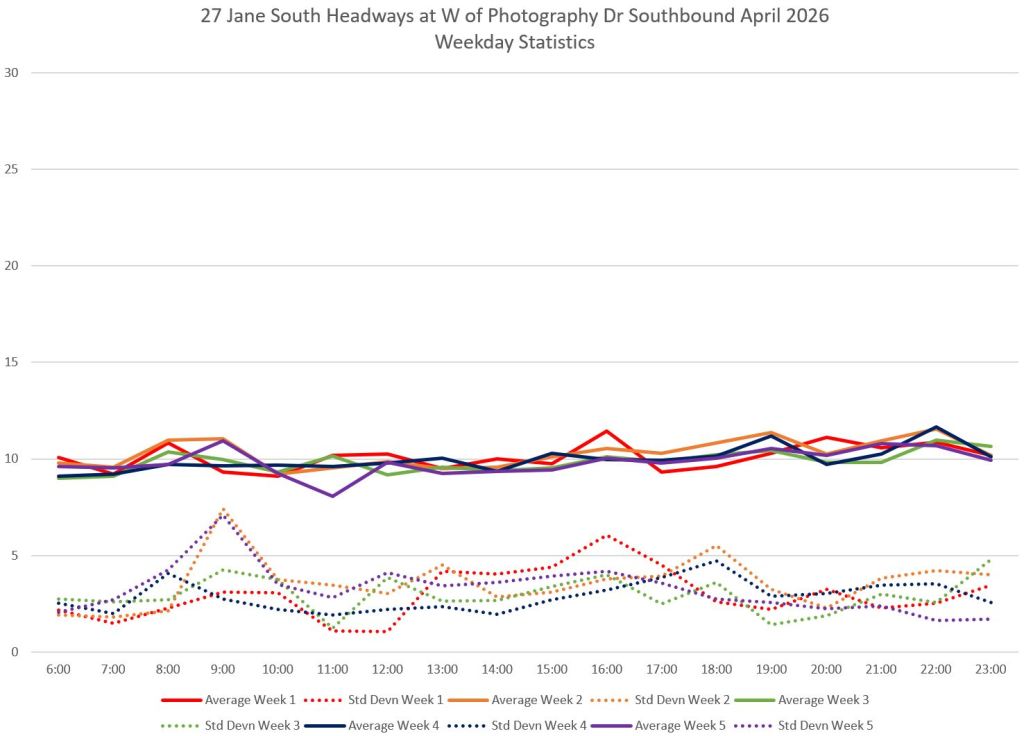
The charts in this section are arranged in three columns, one or each month from February to April 2026. There are four rows containing:
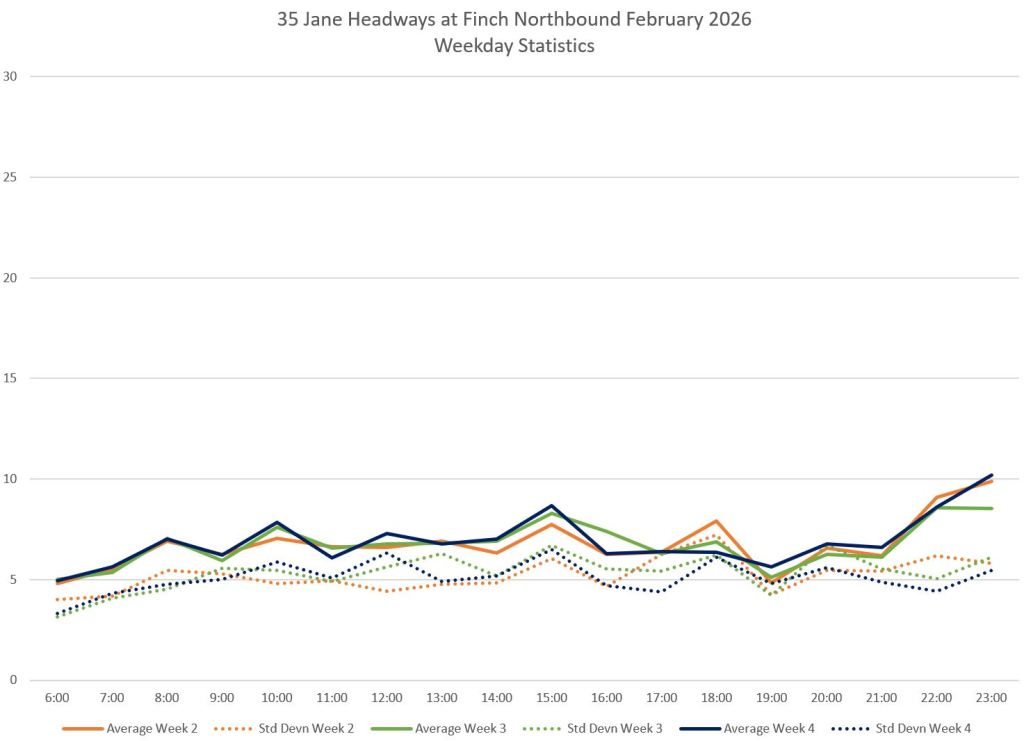
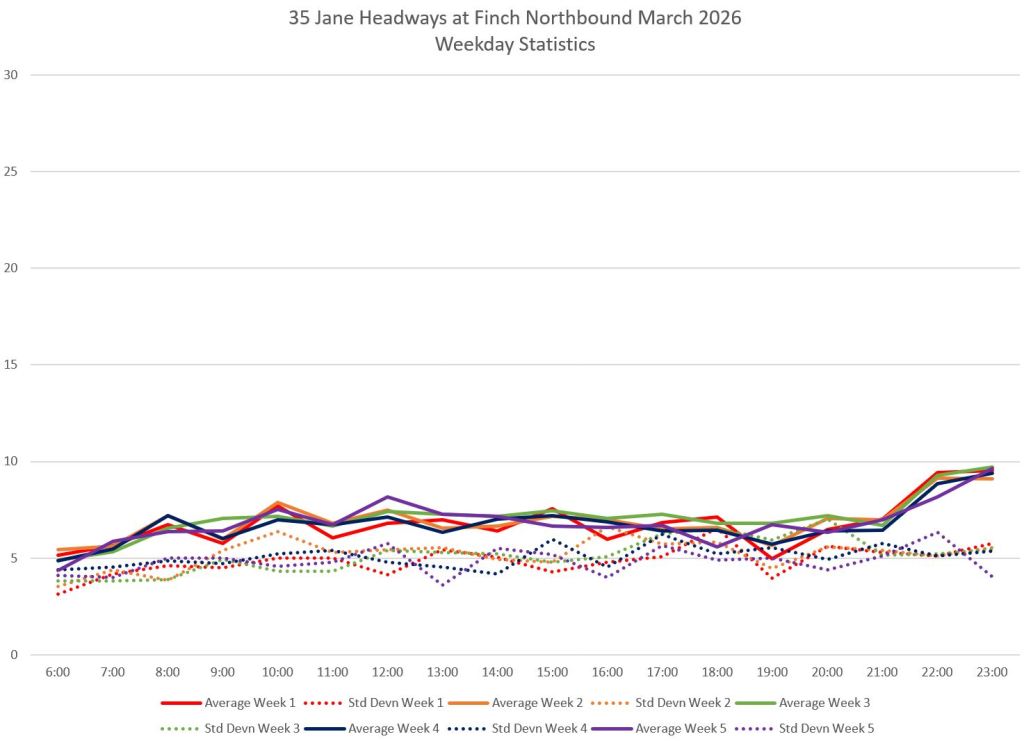
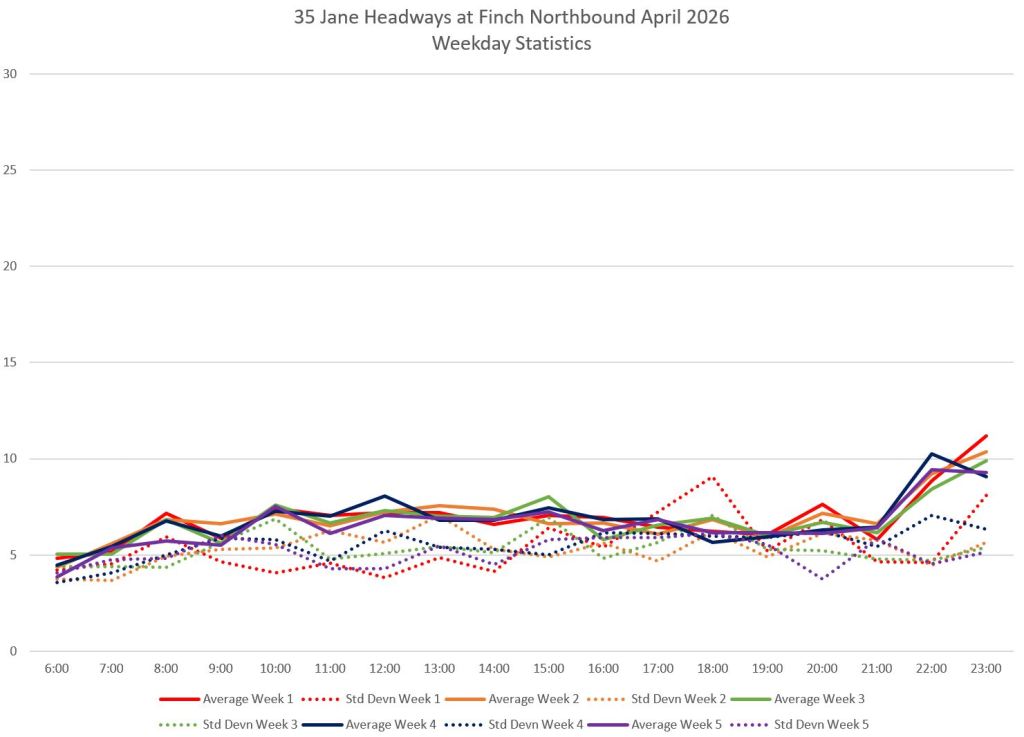
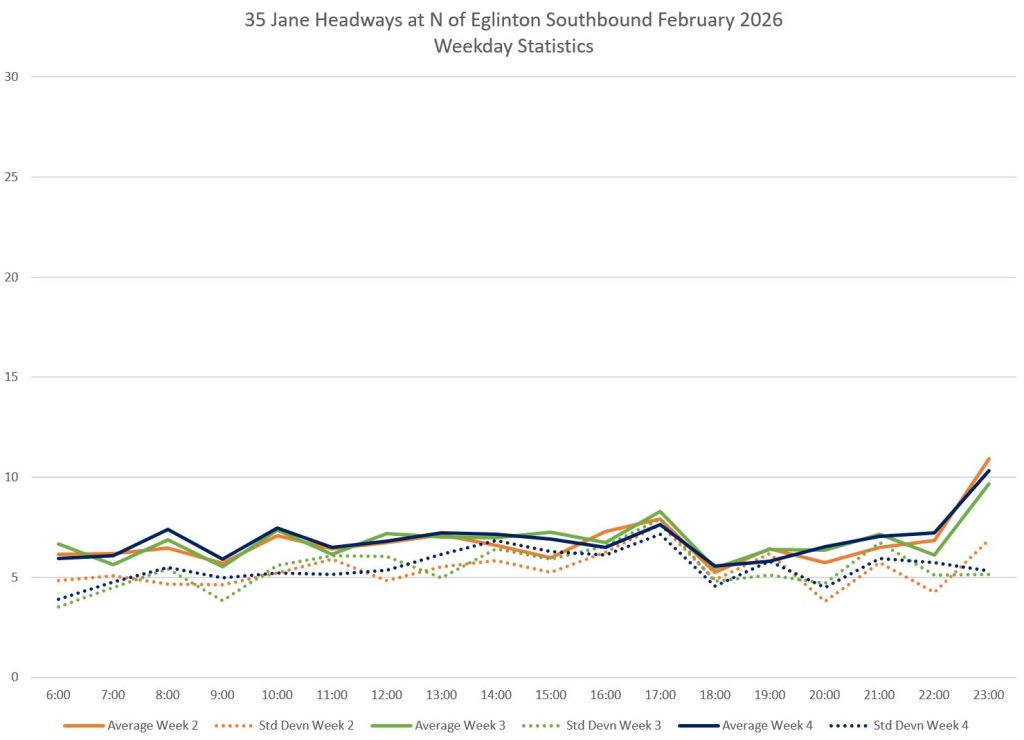
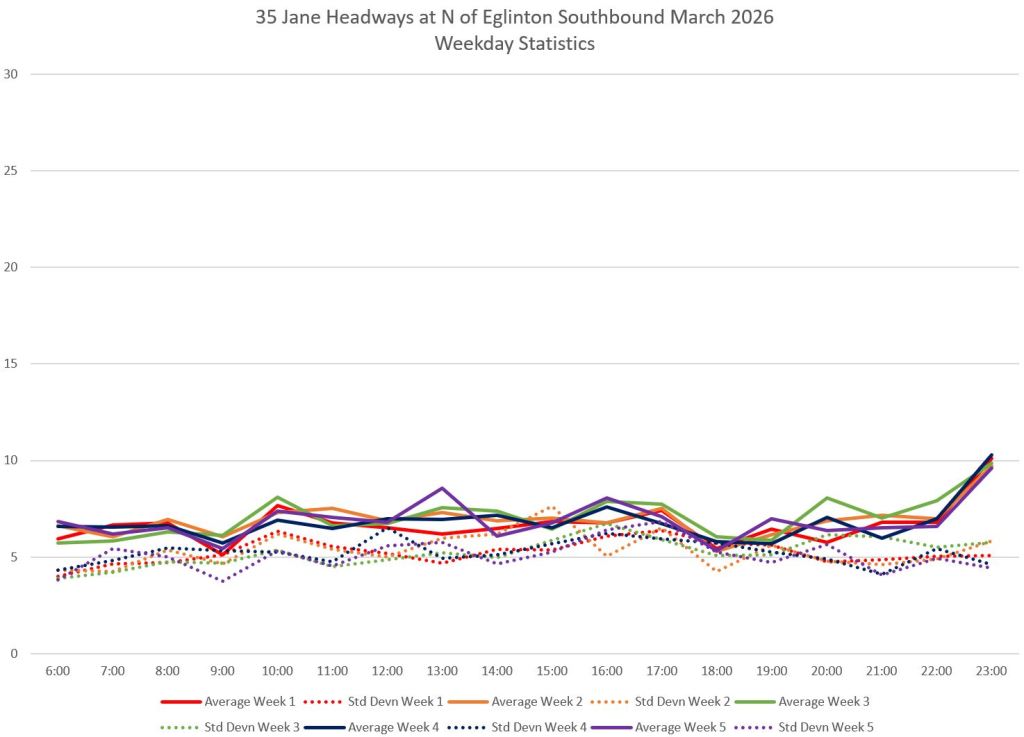
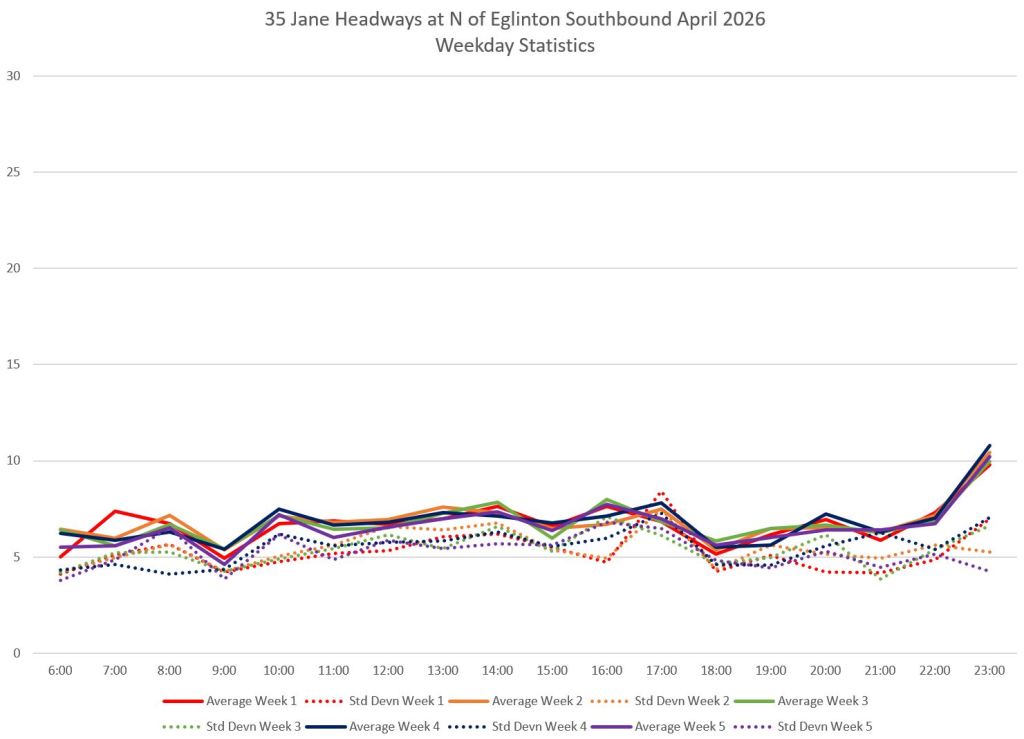
- Overall weekday statistics showing average headways by week and hour, and standard deviations (a measure of how scattered the values are).
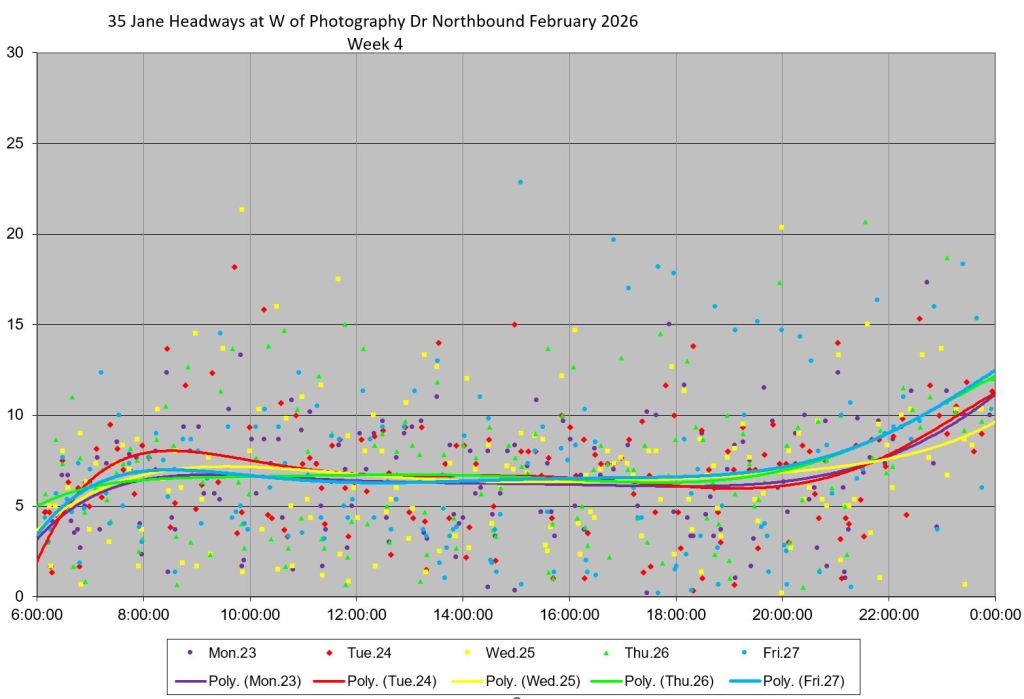
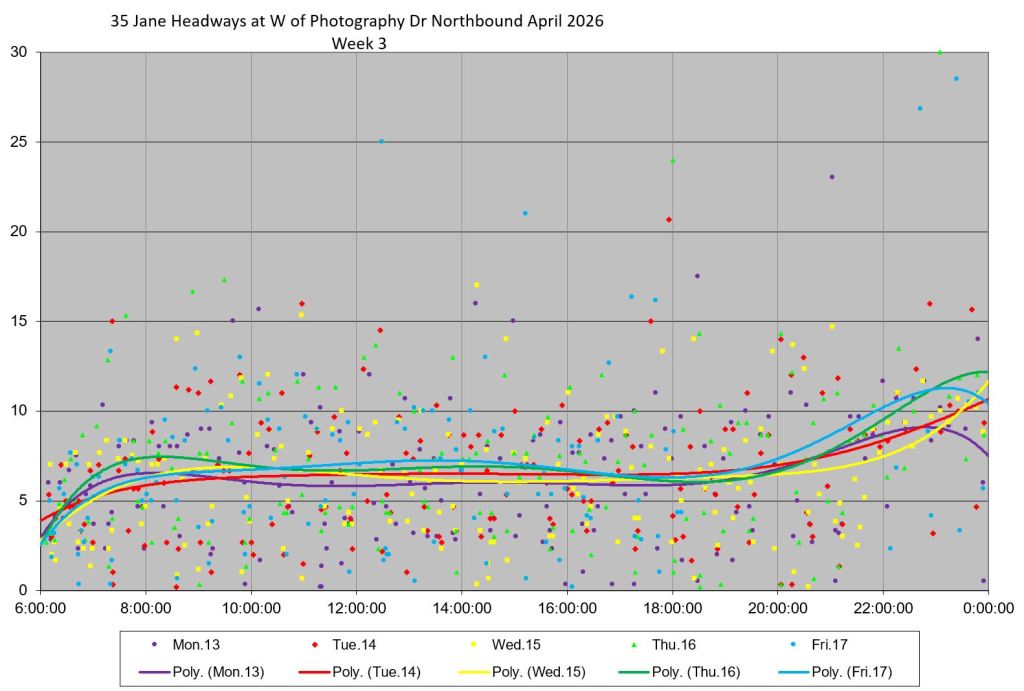
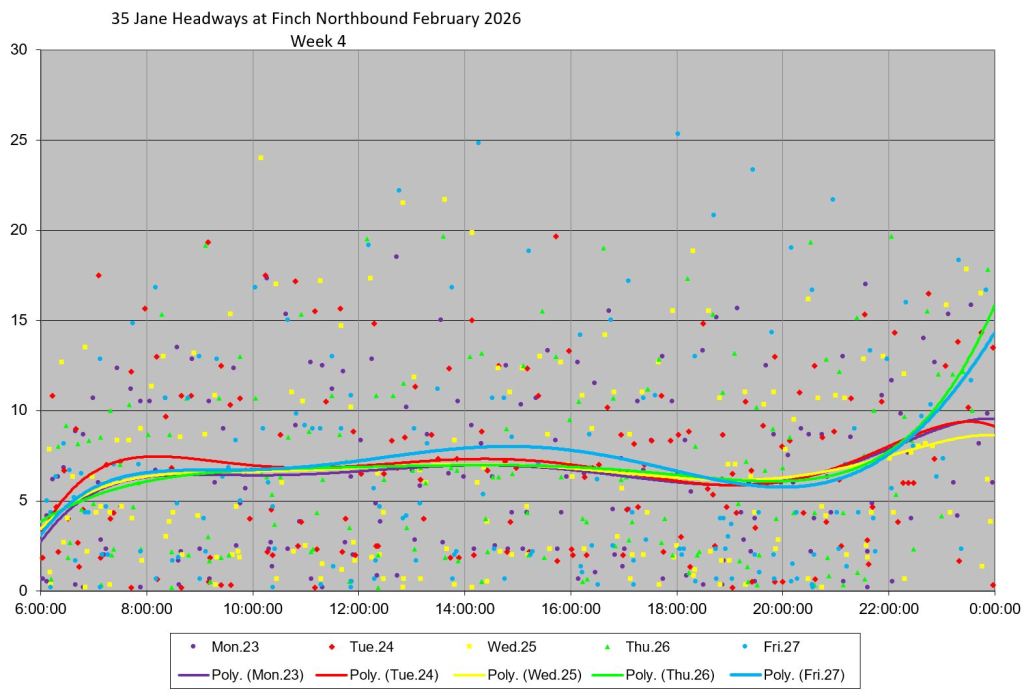
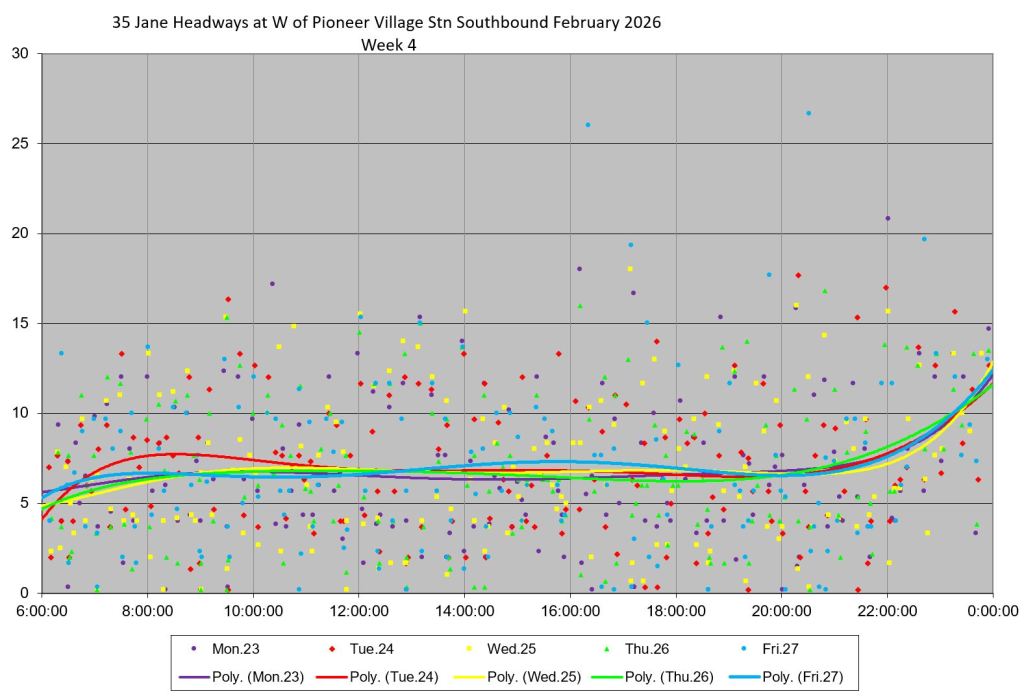
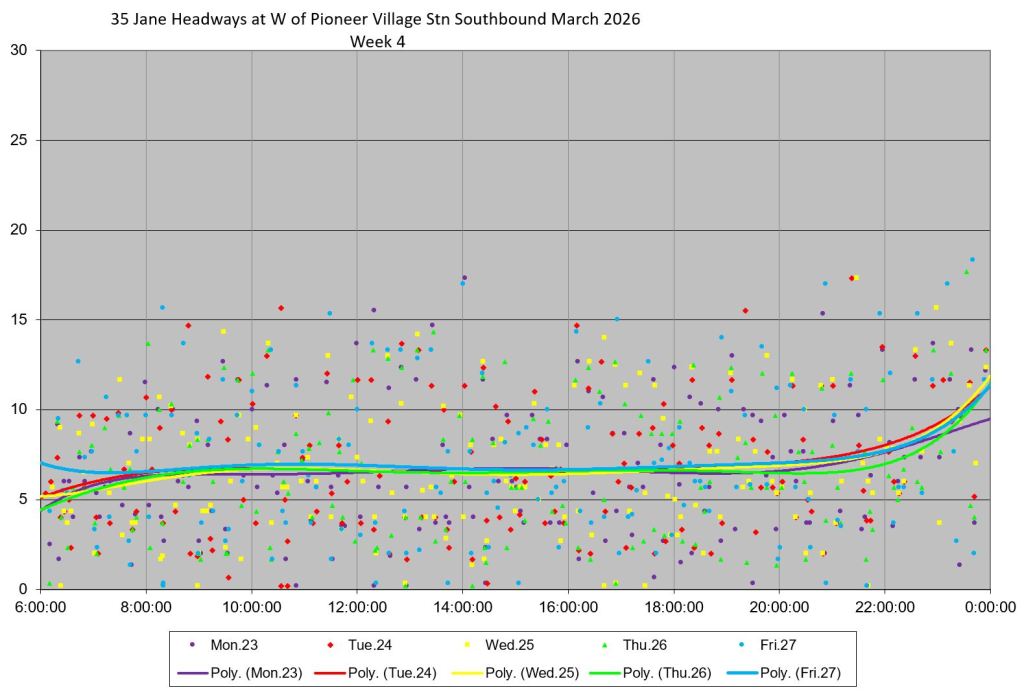
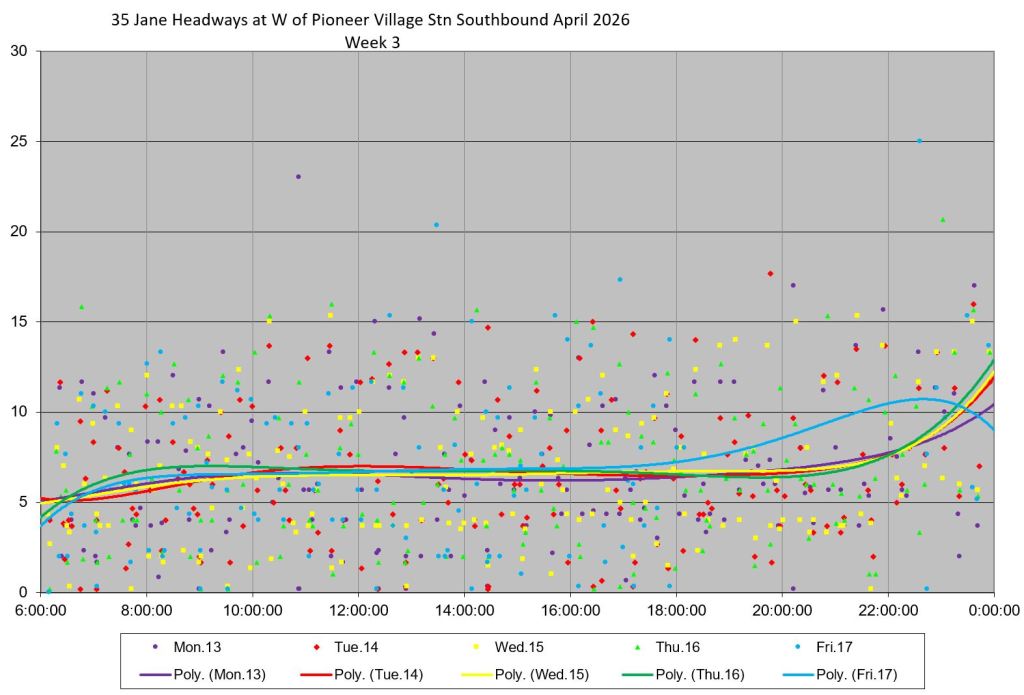
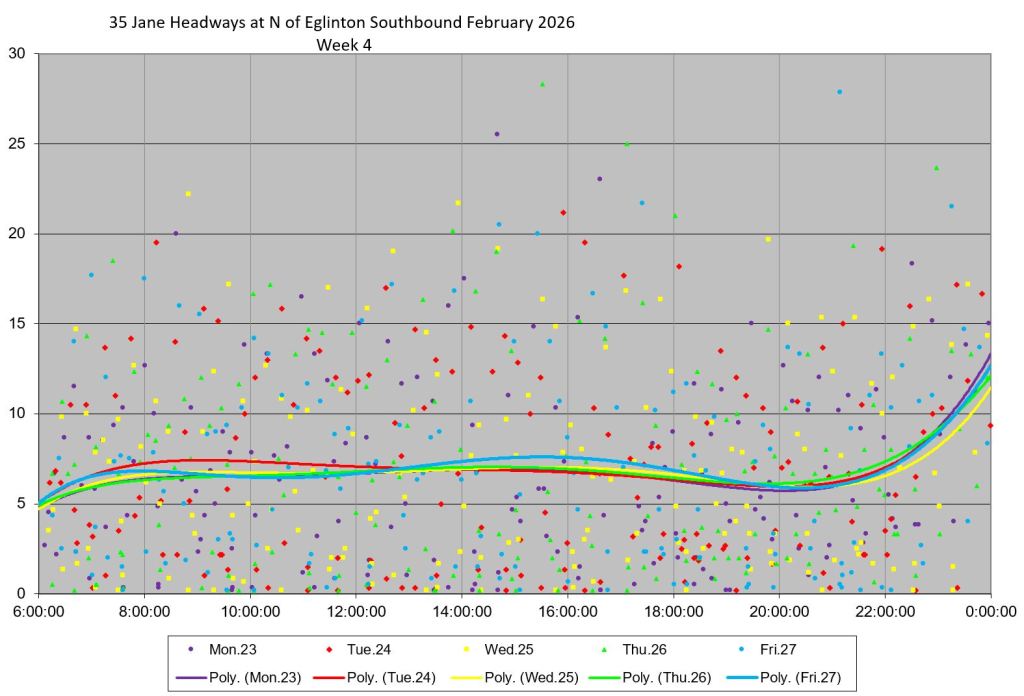
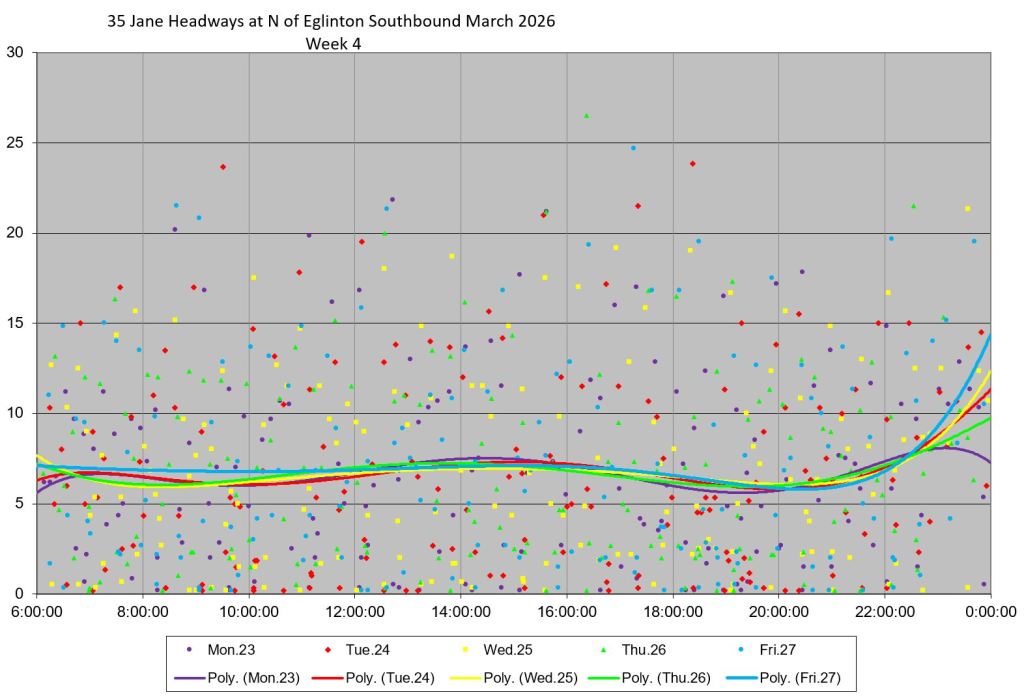
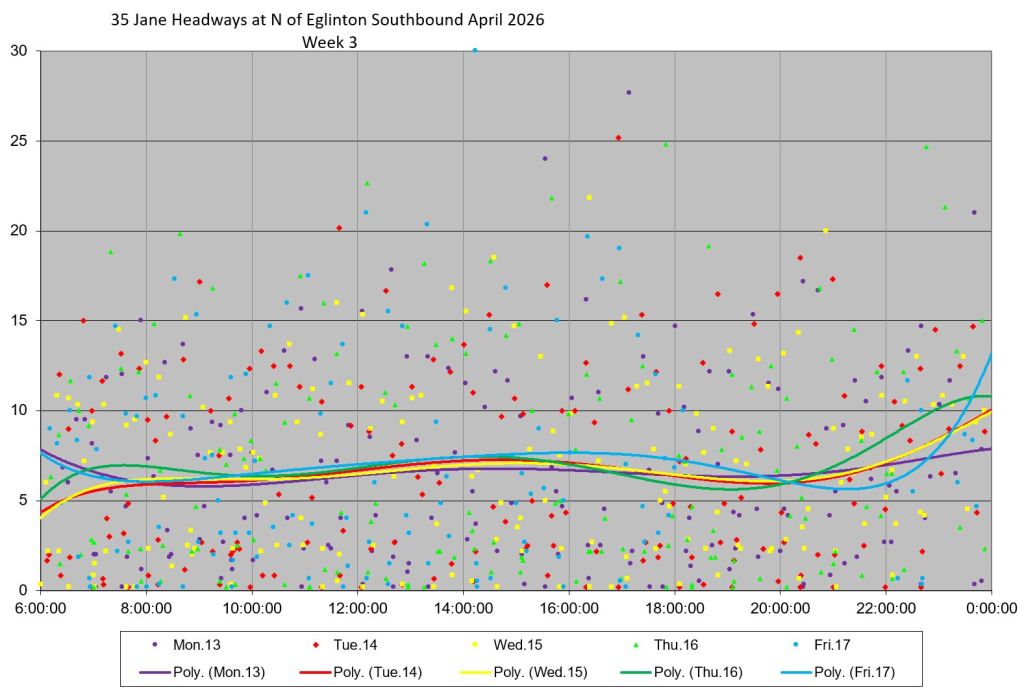
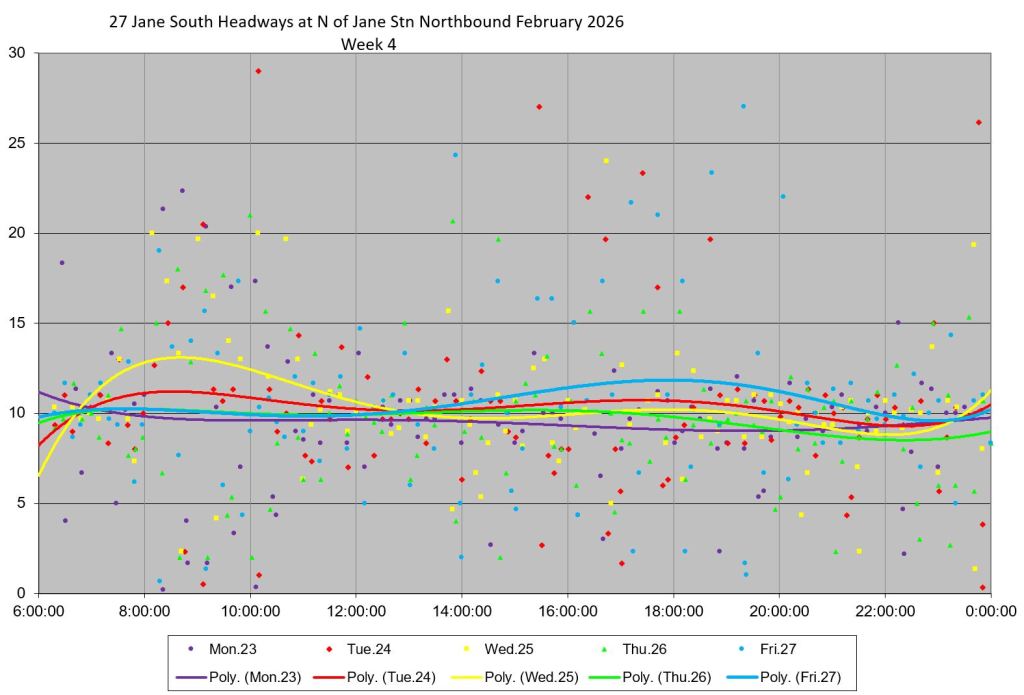
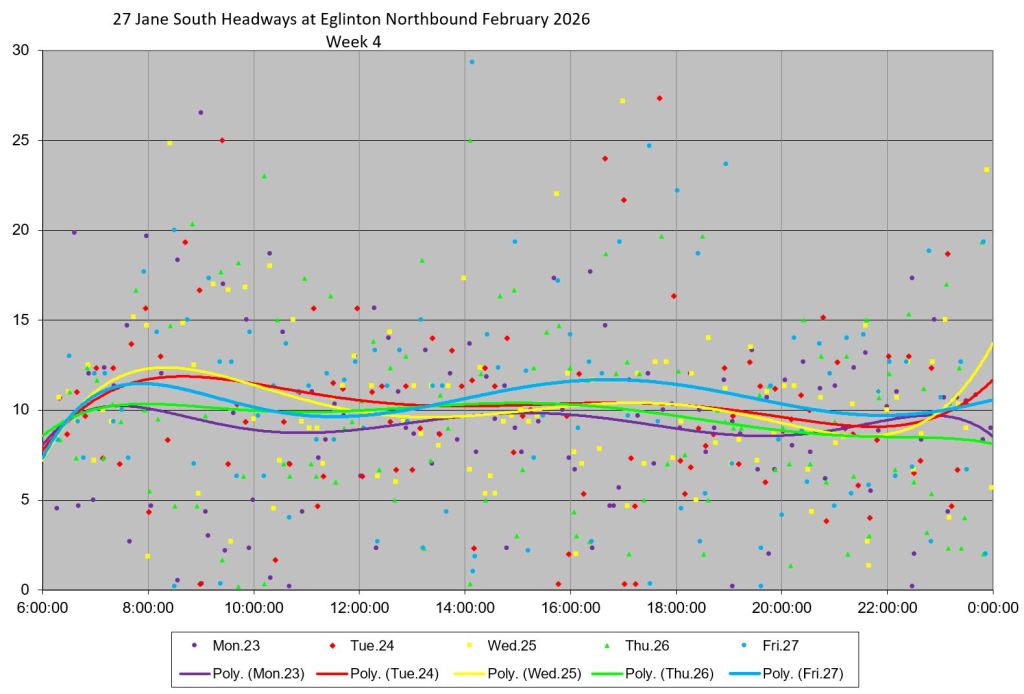
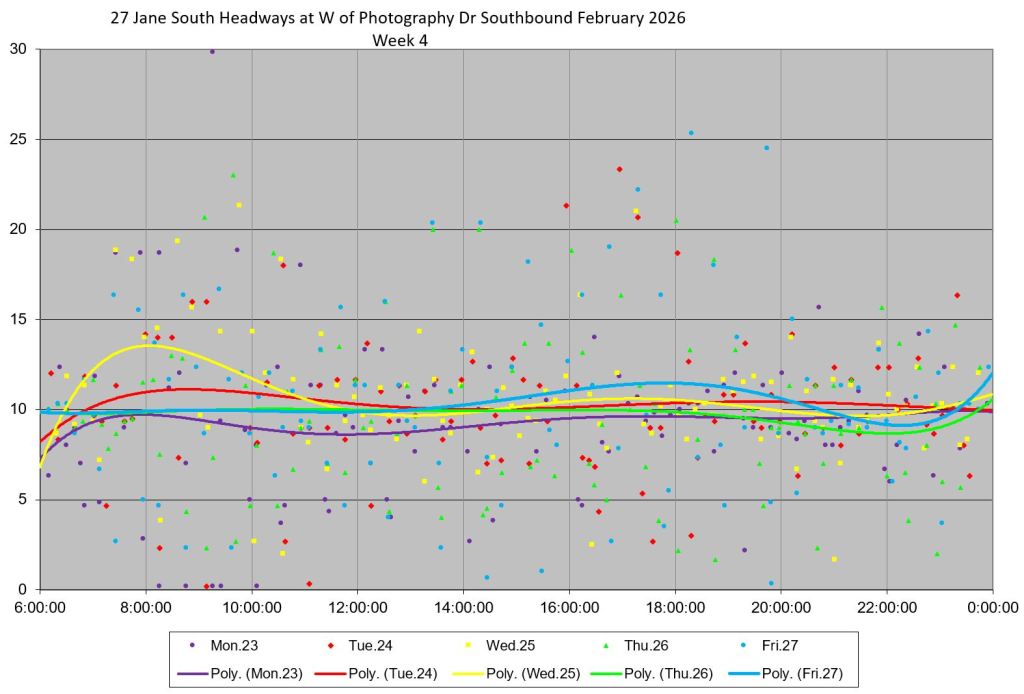
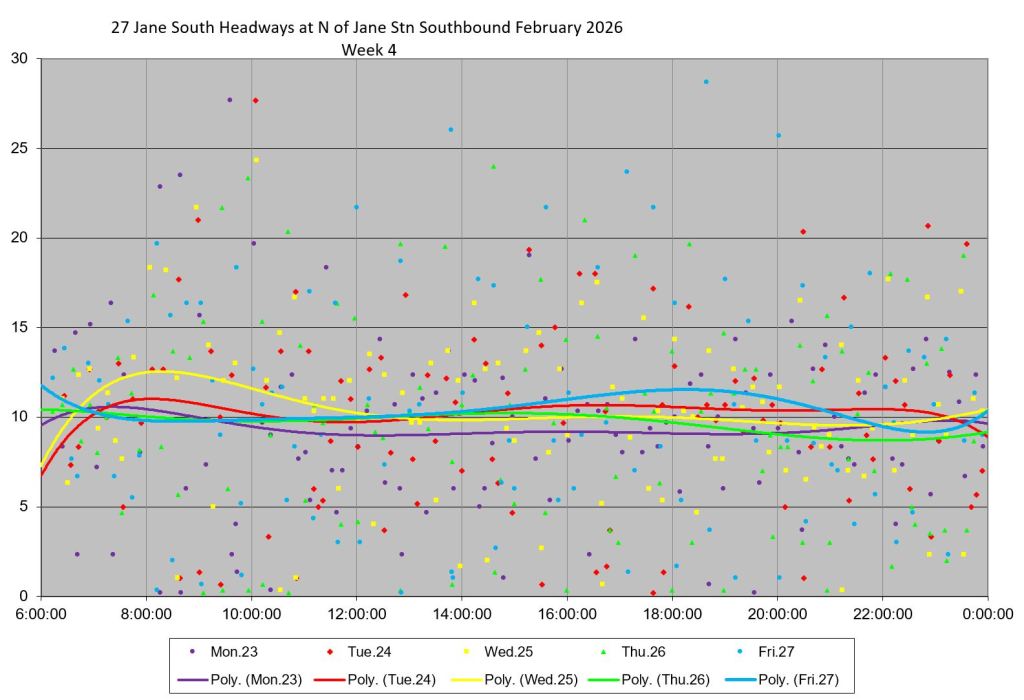
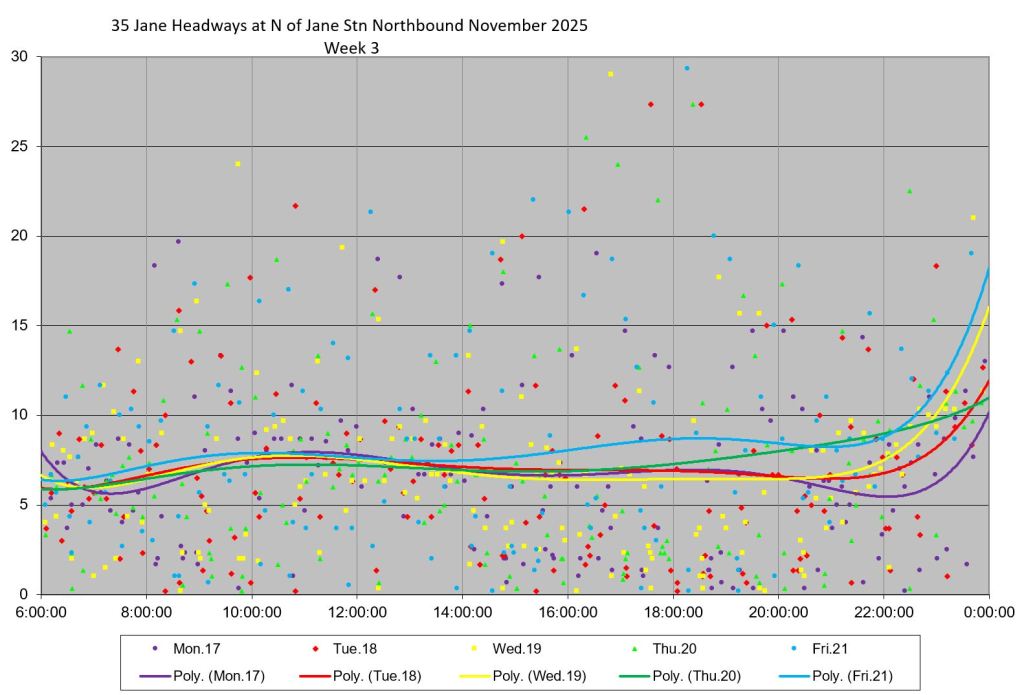
- A detailed chart showing headways in one week within the month. The weeks have been chosen to avoid statutory holidays (Family Day, Good Friday) and the mid-March break lull. Dots show individual trips and trend lines show the general movement of values.
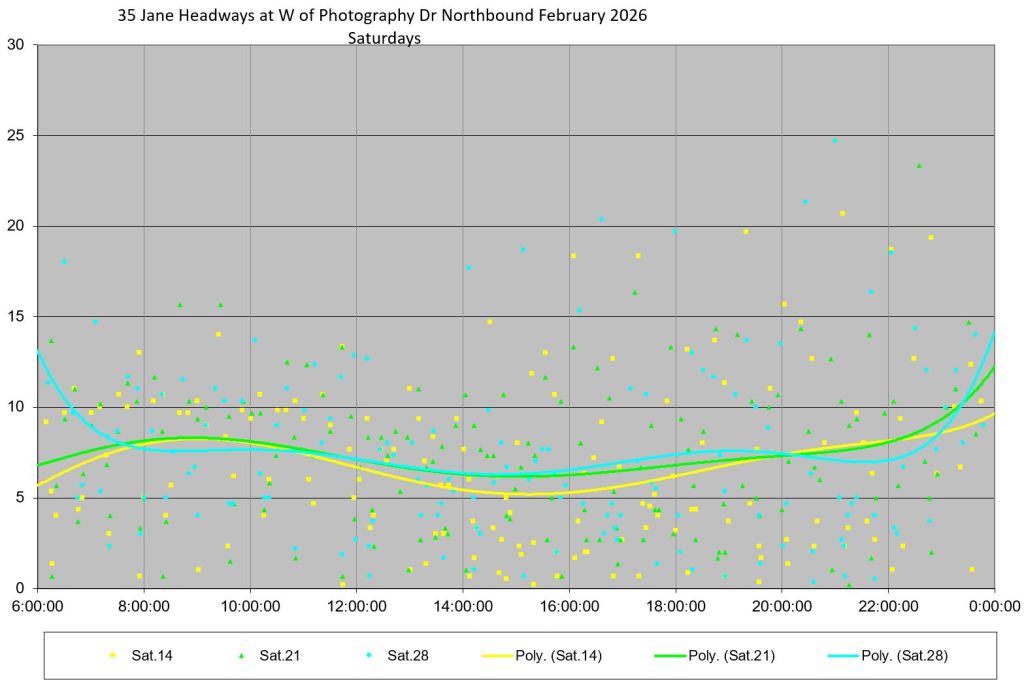
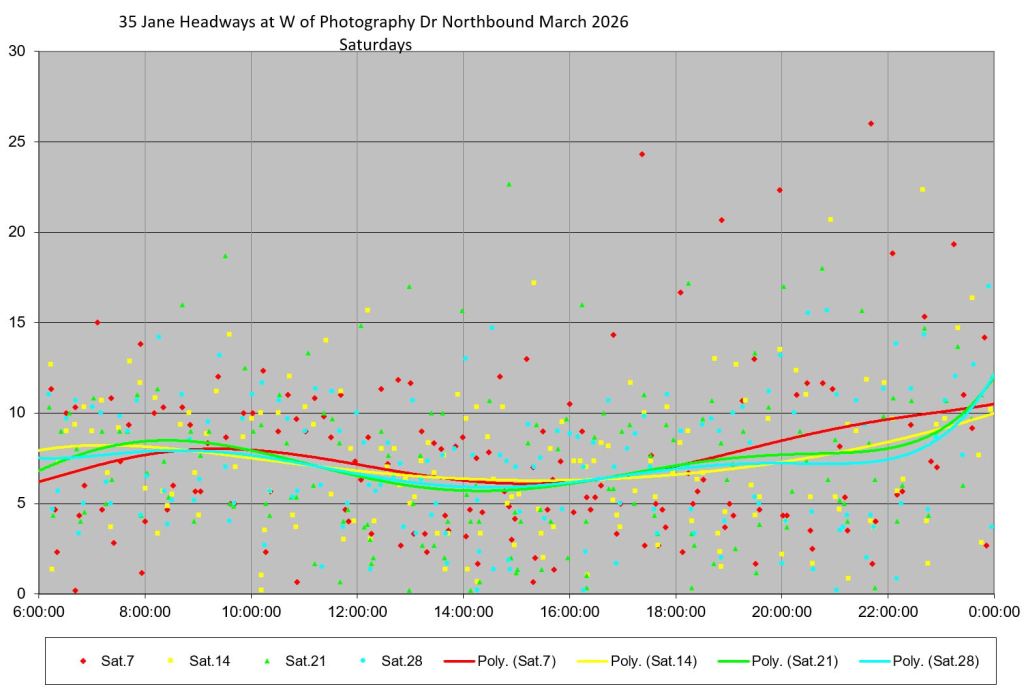
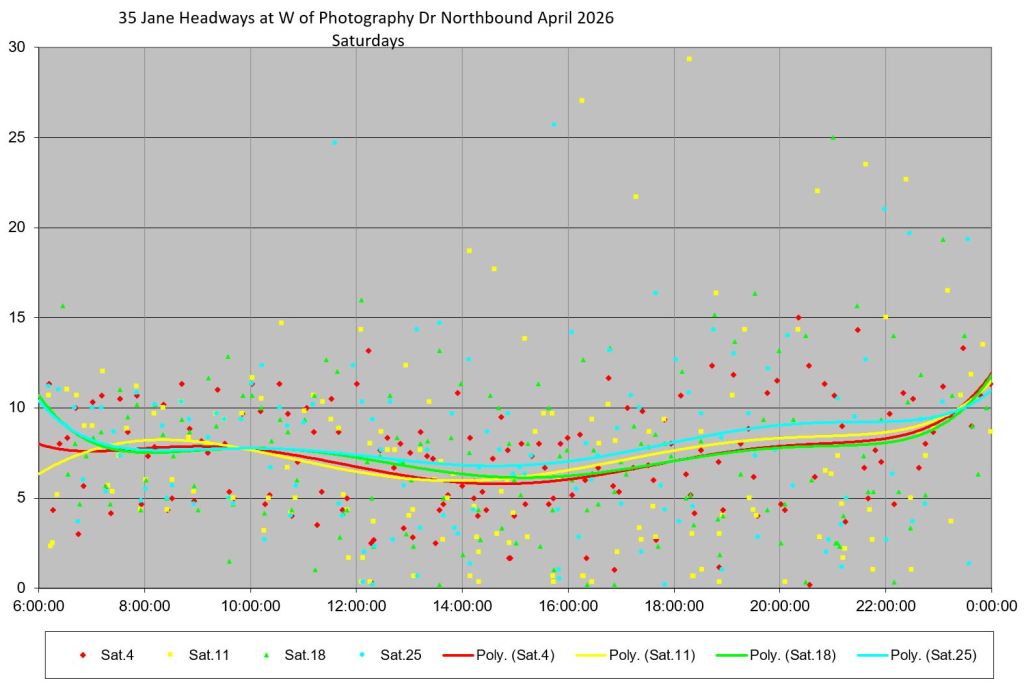
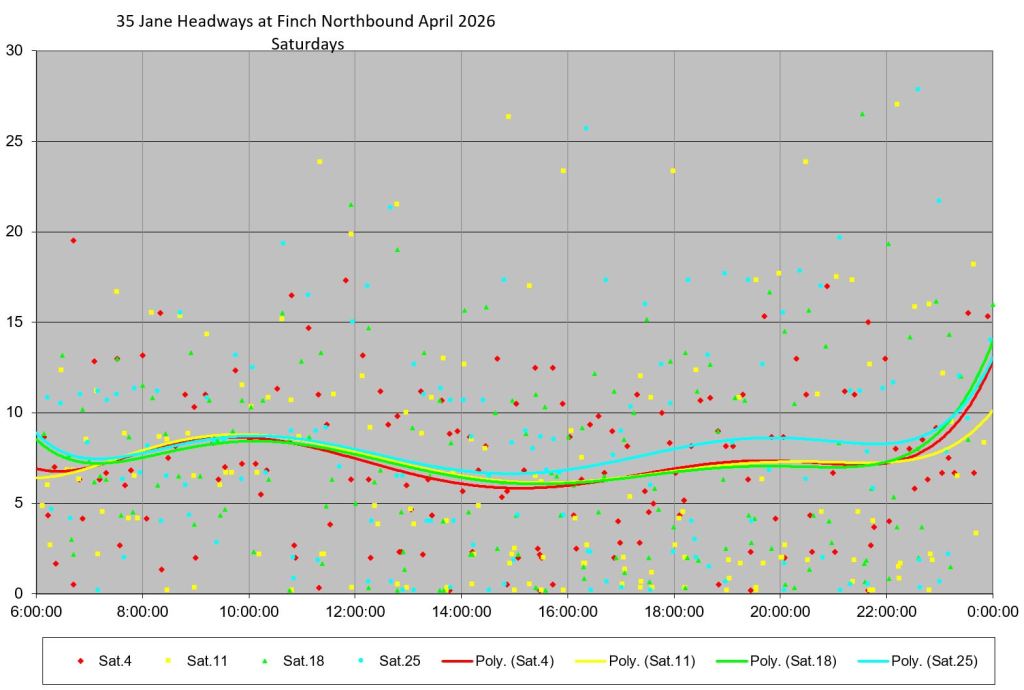
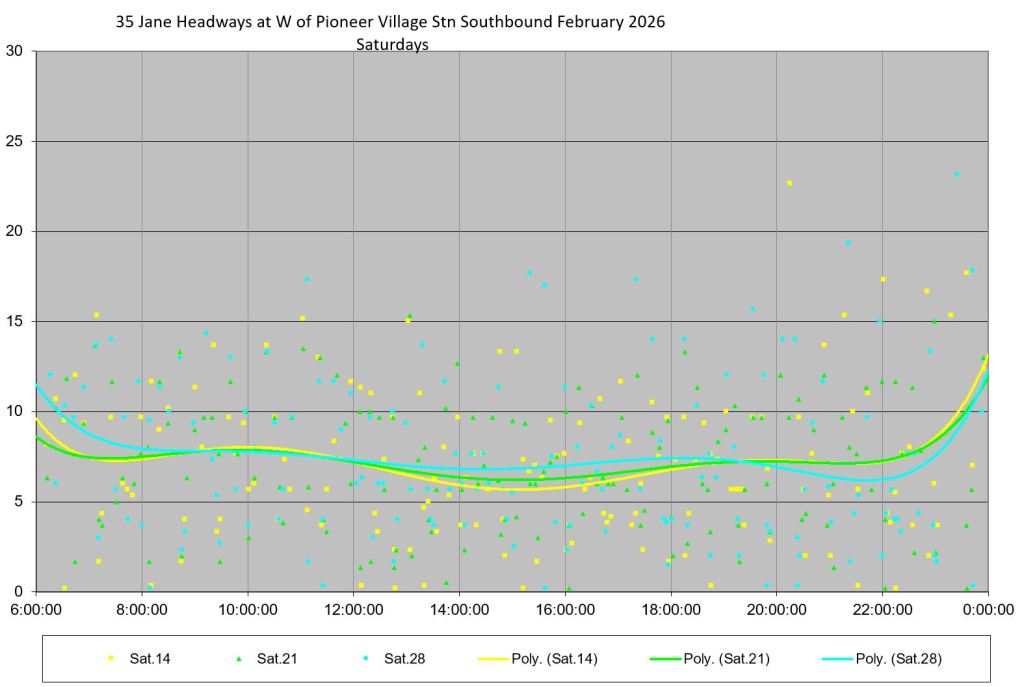
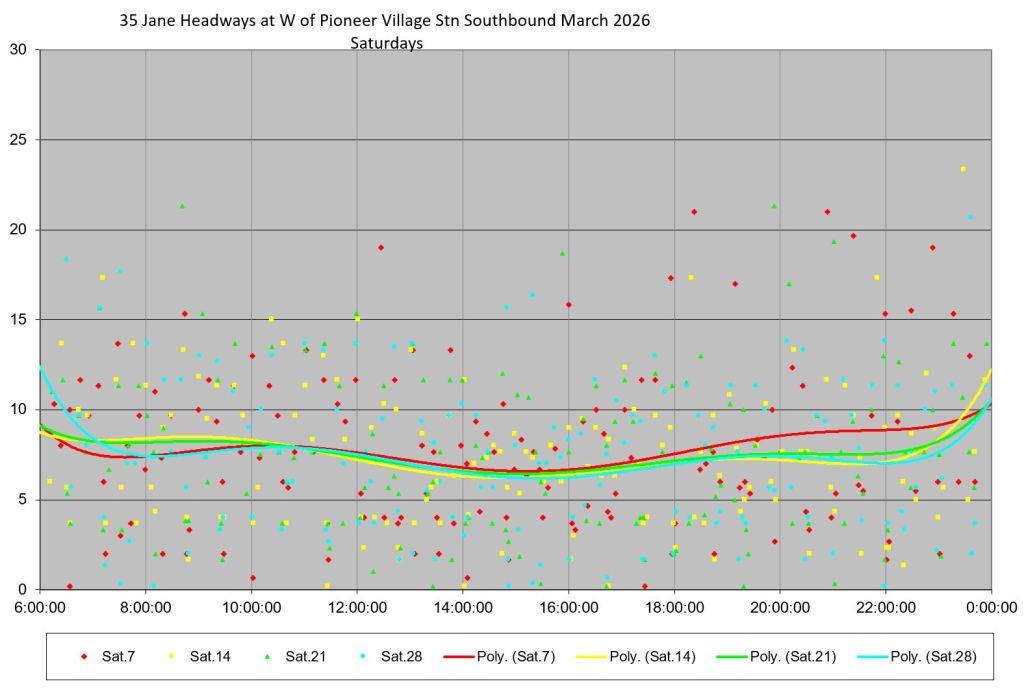
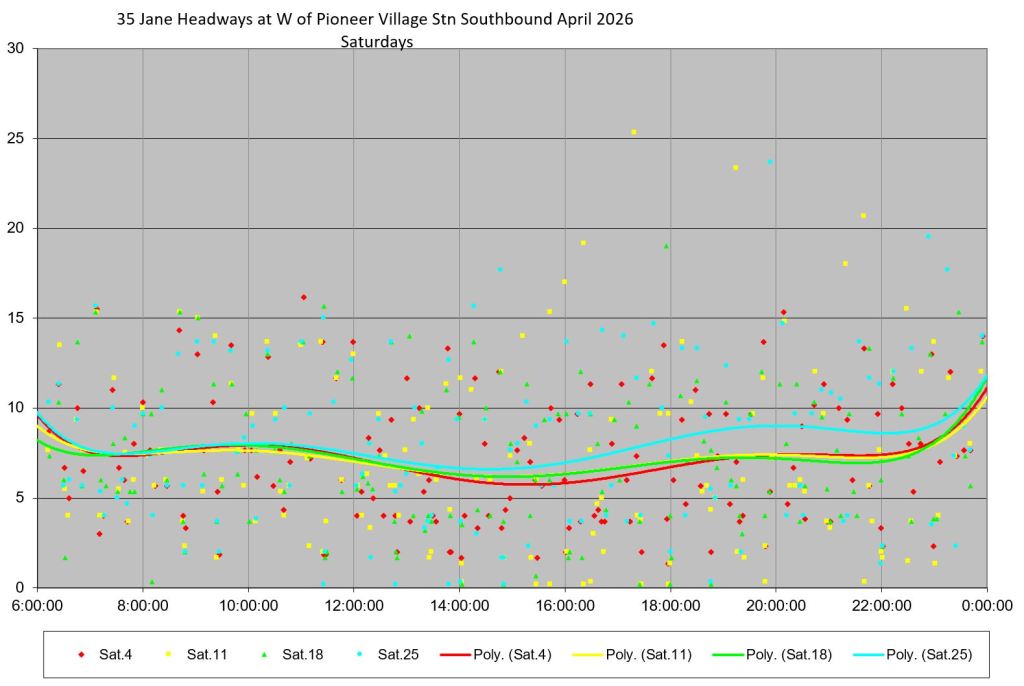
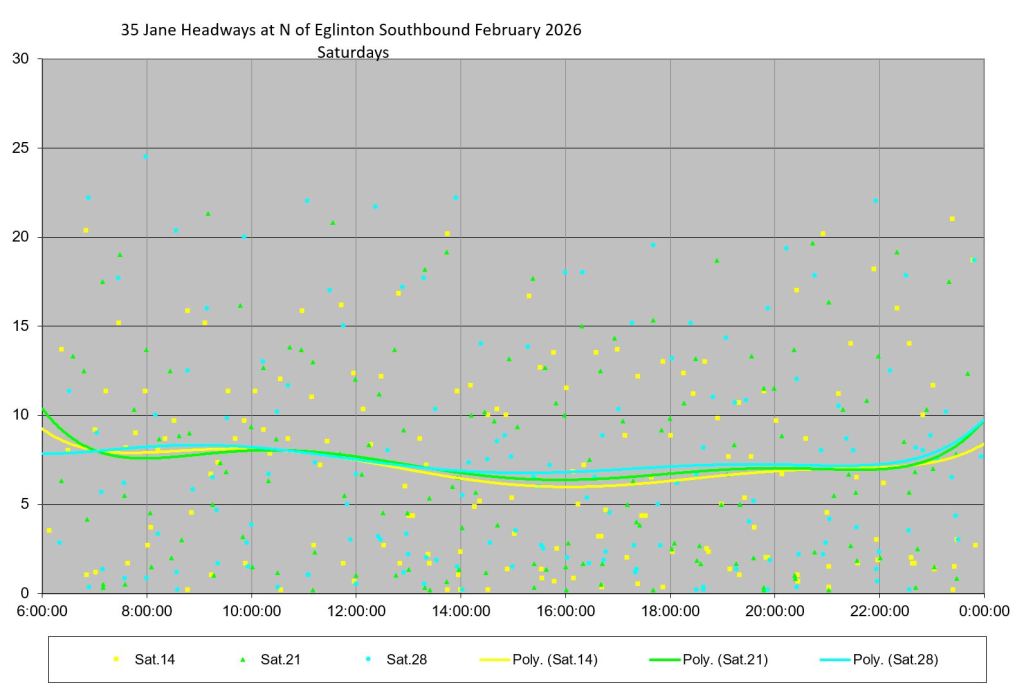
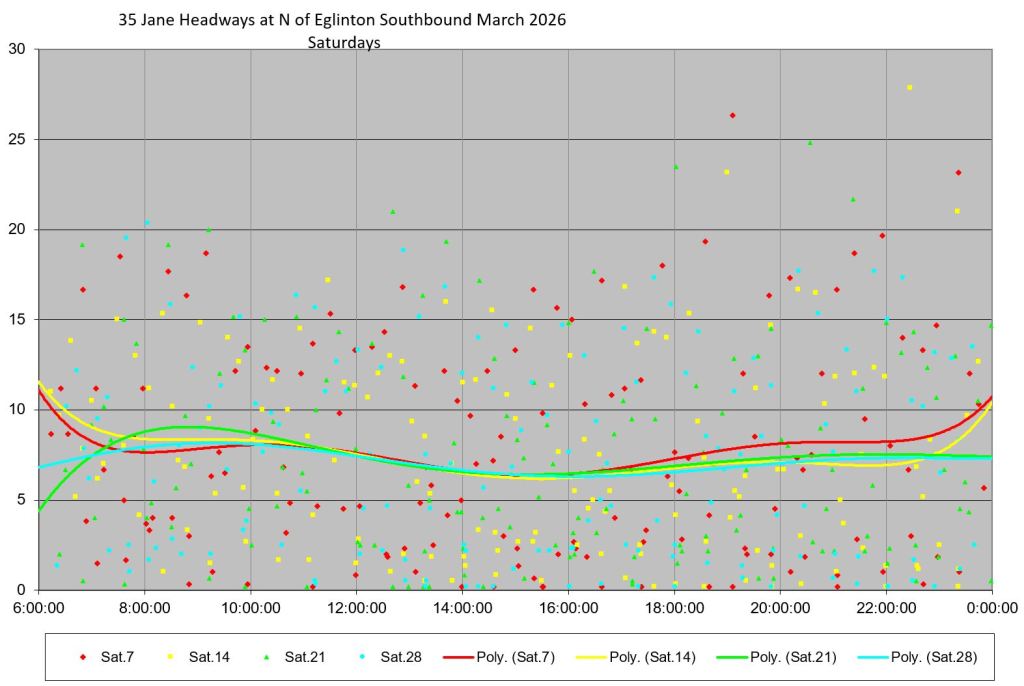
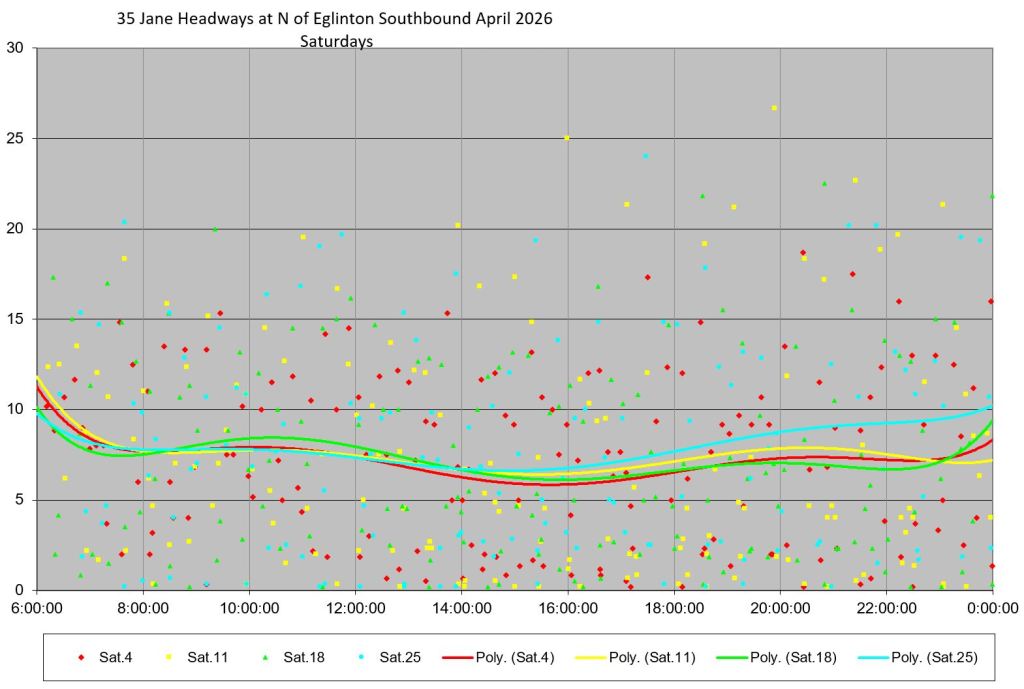
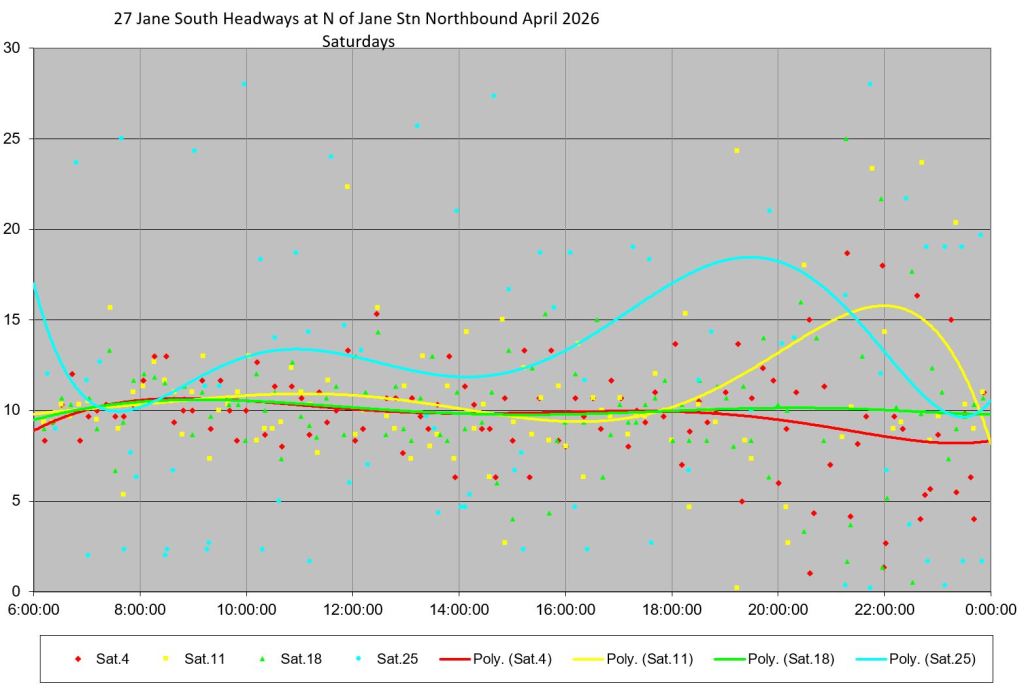
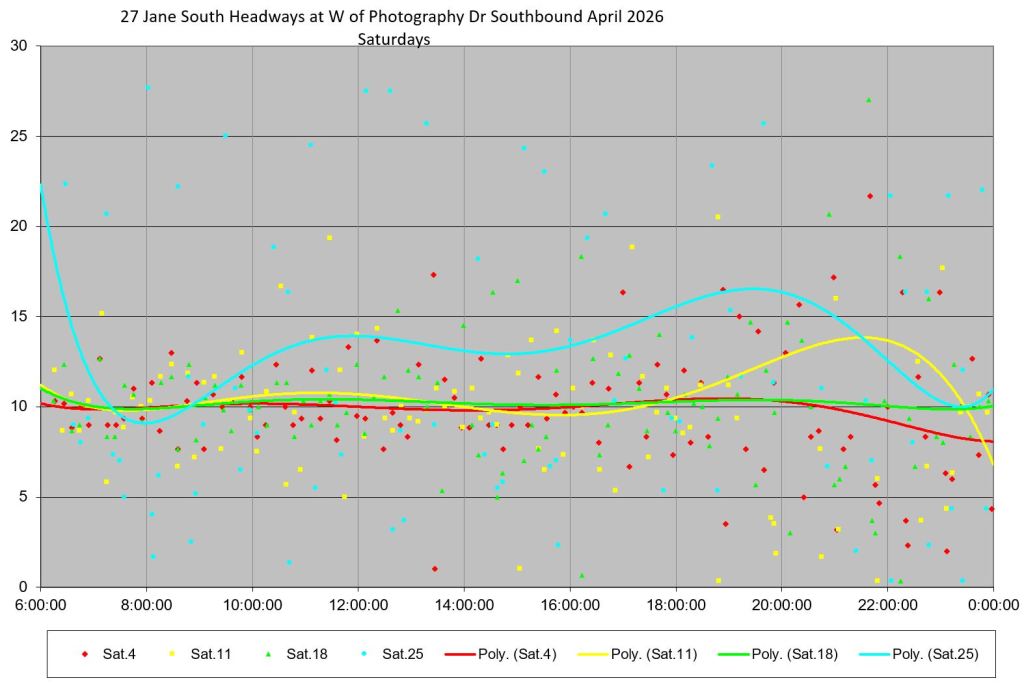
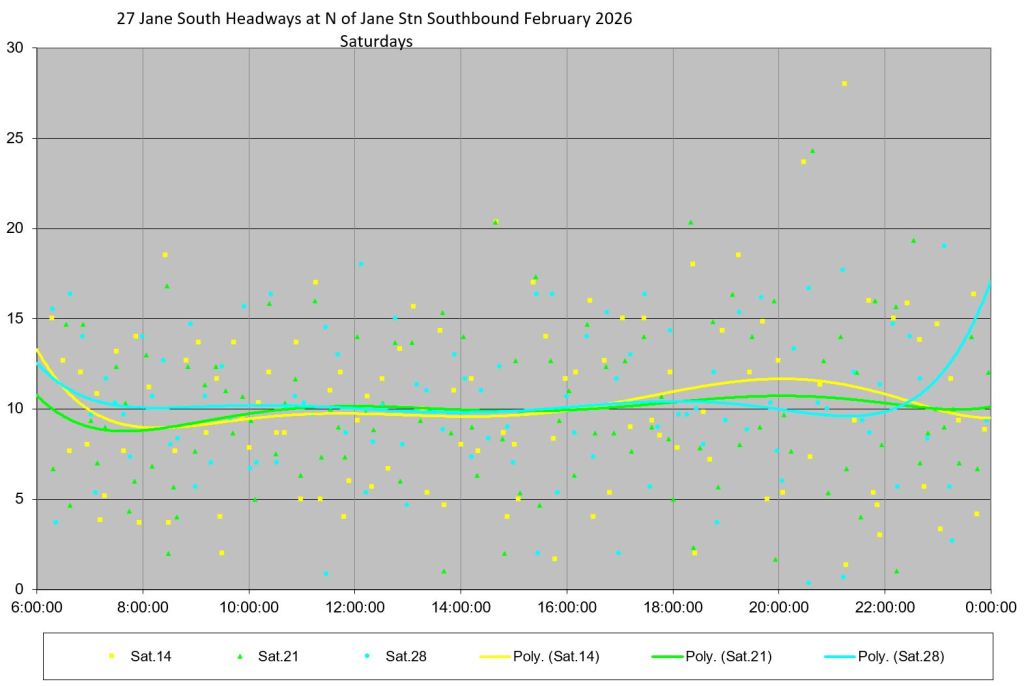
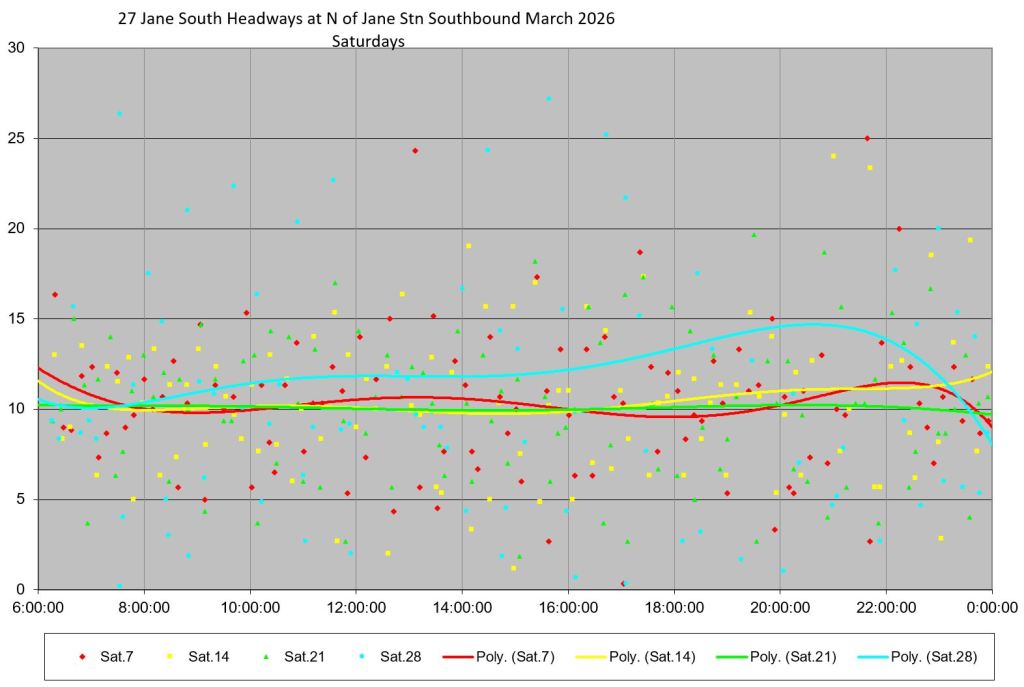
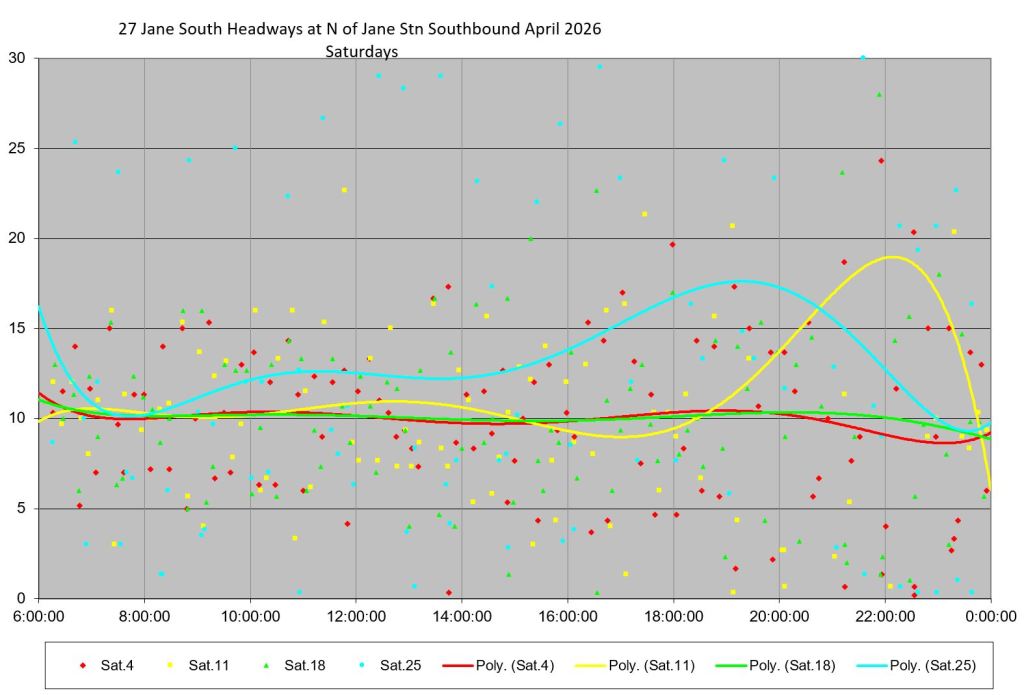
- A detailed chart showing Saturday headways in the same format as the weekday chart.
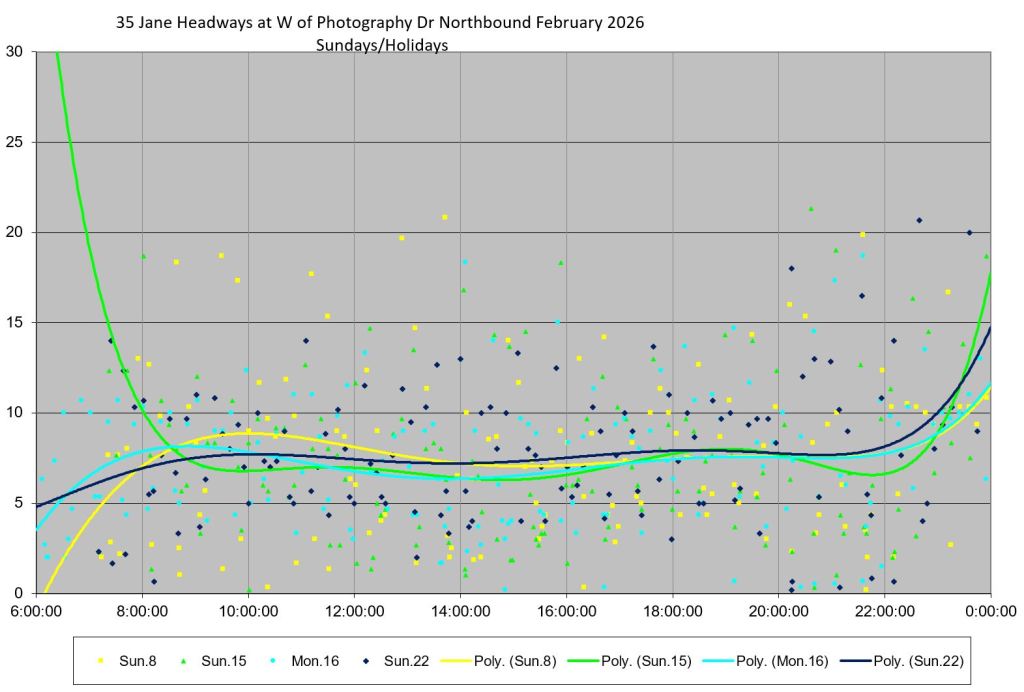
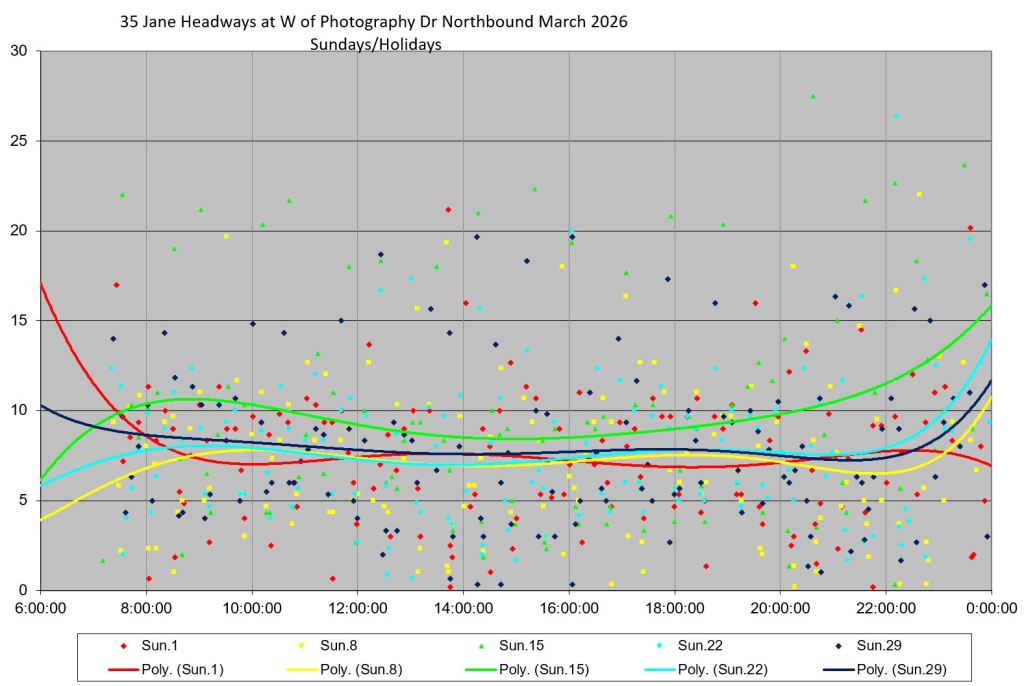
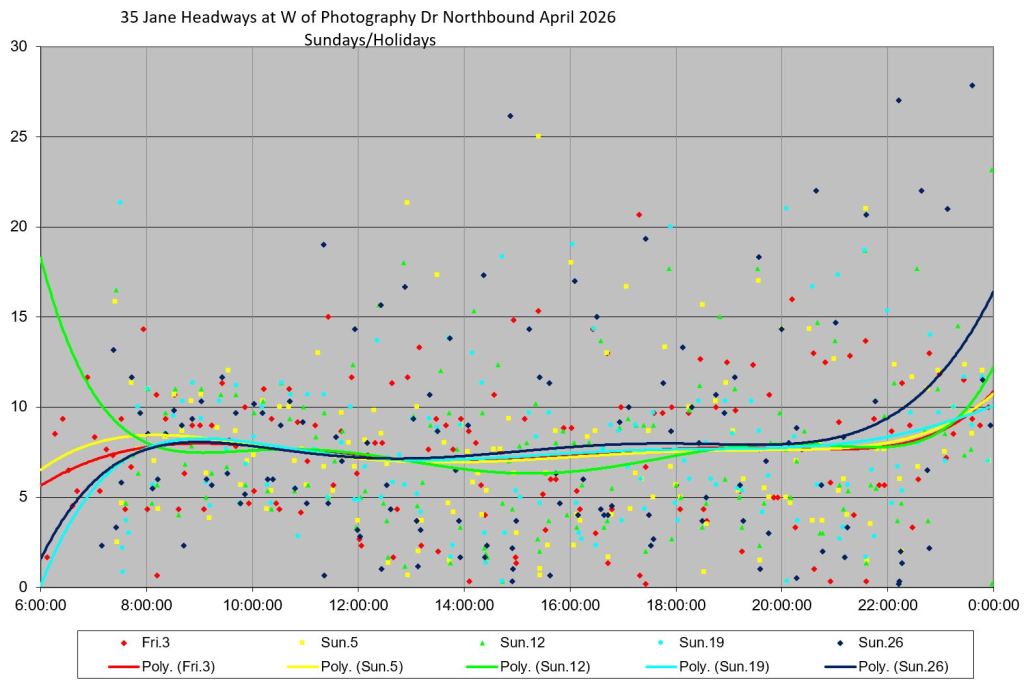
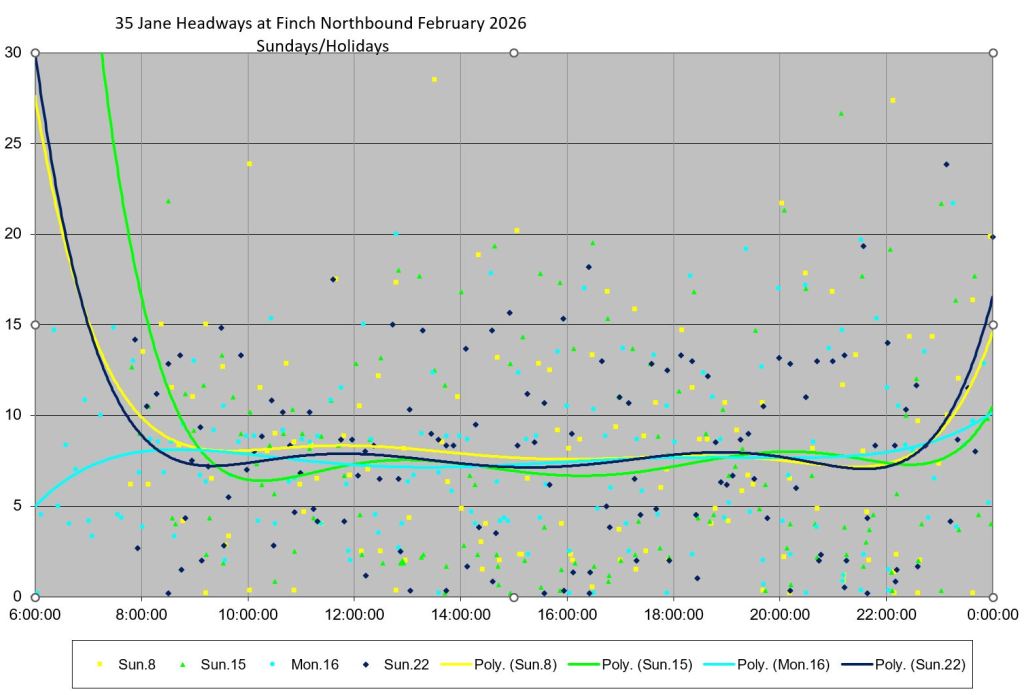
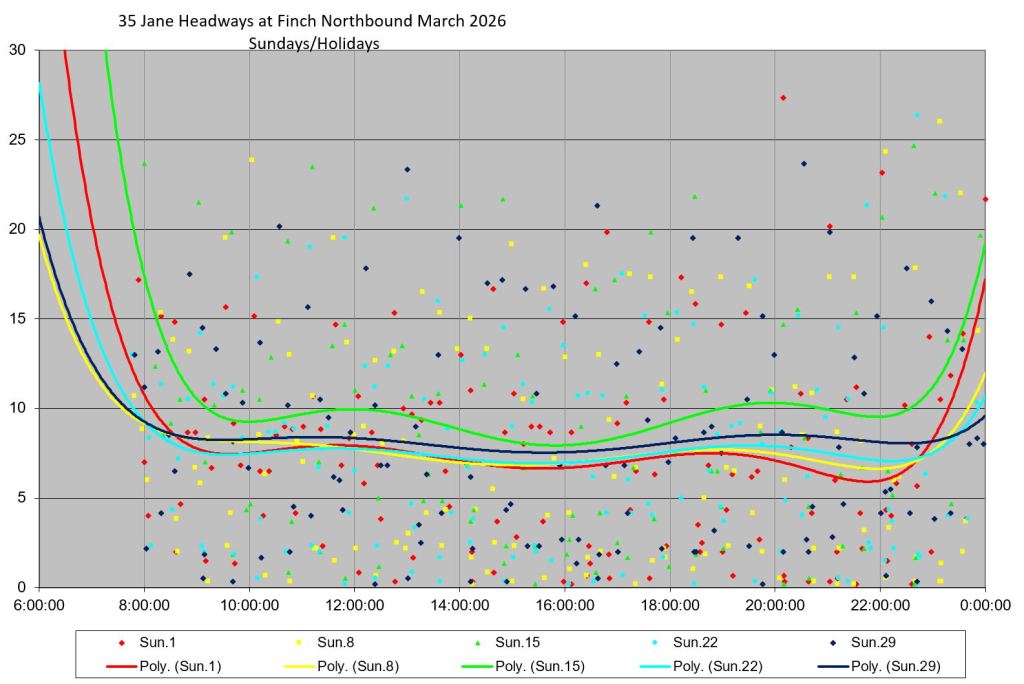
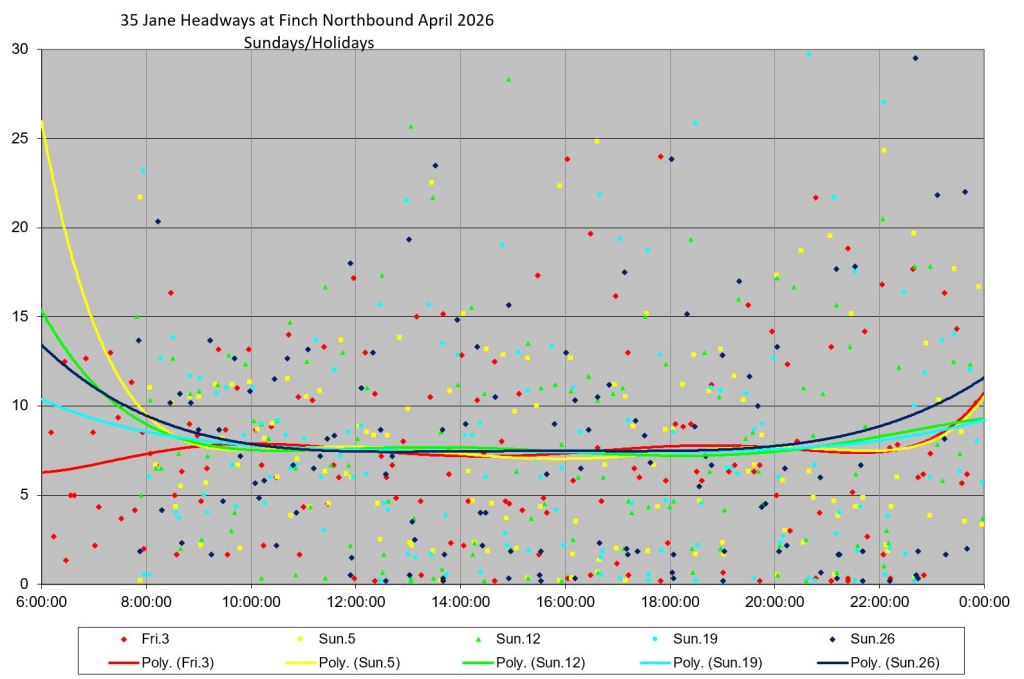
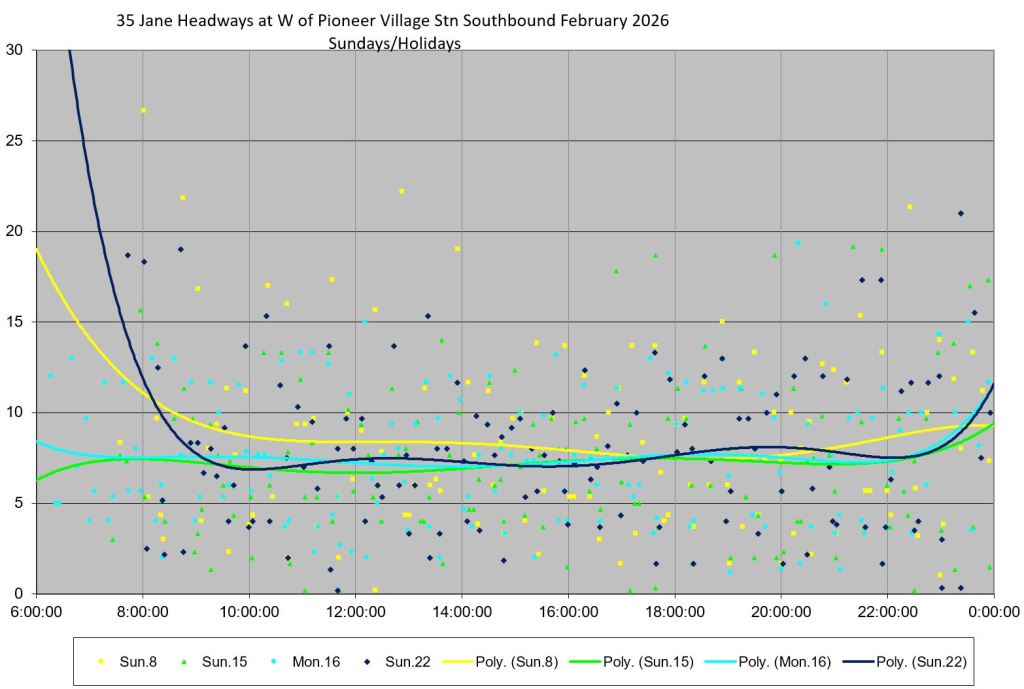
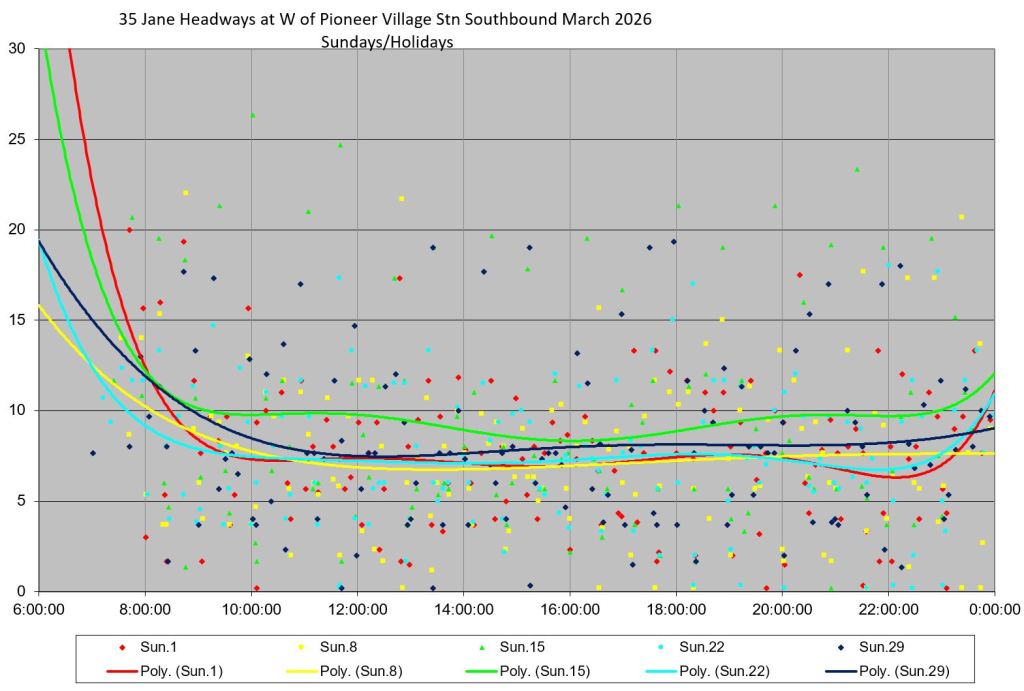
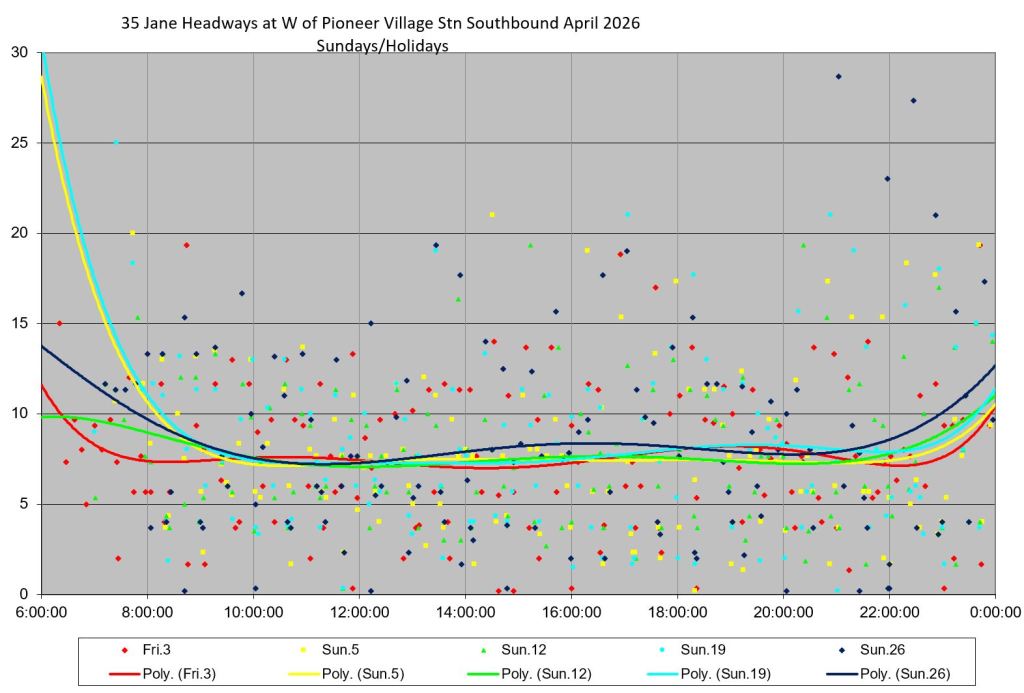
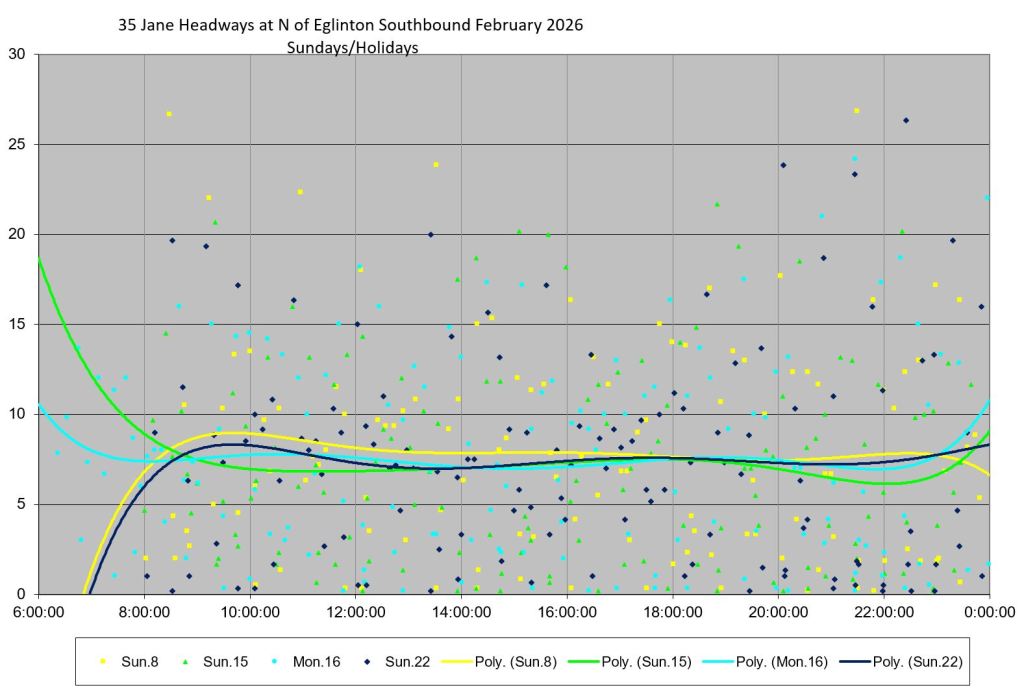
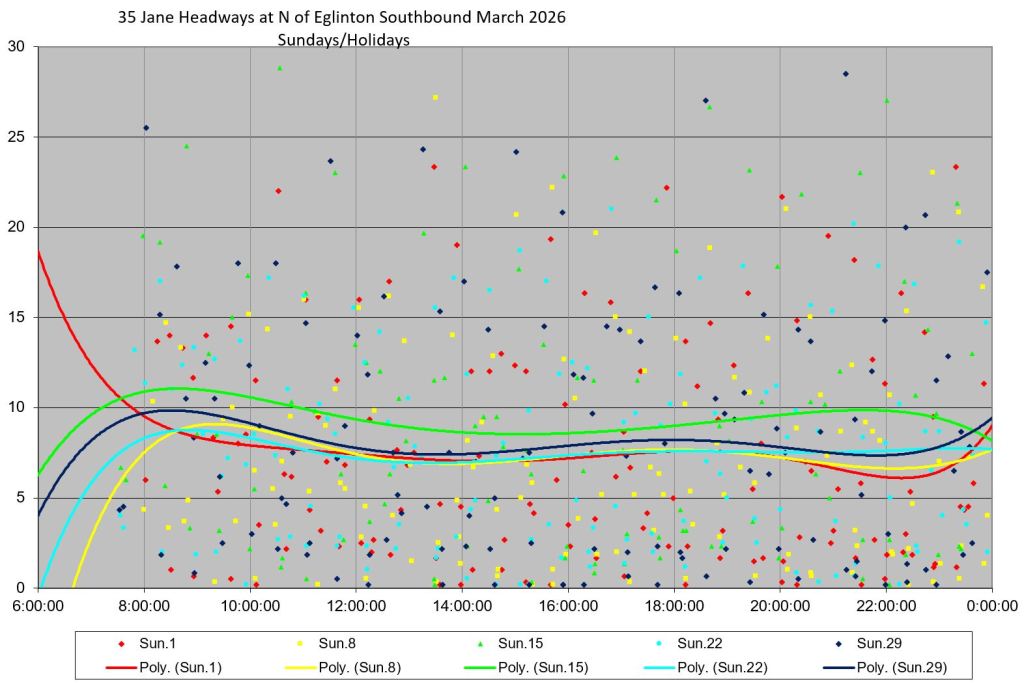
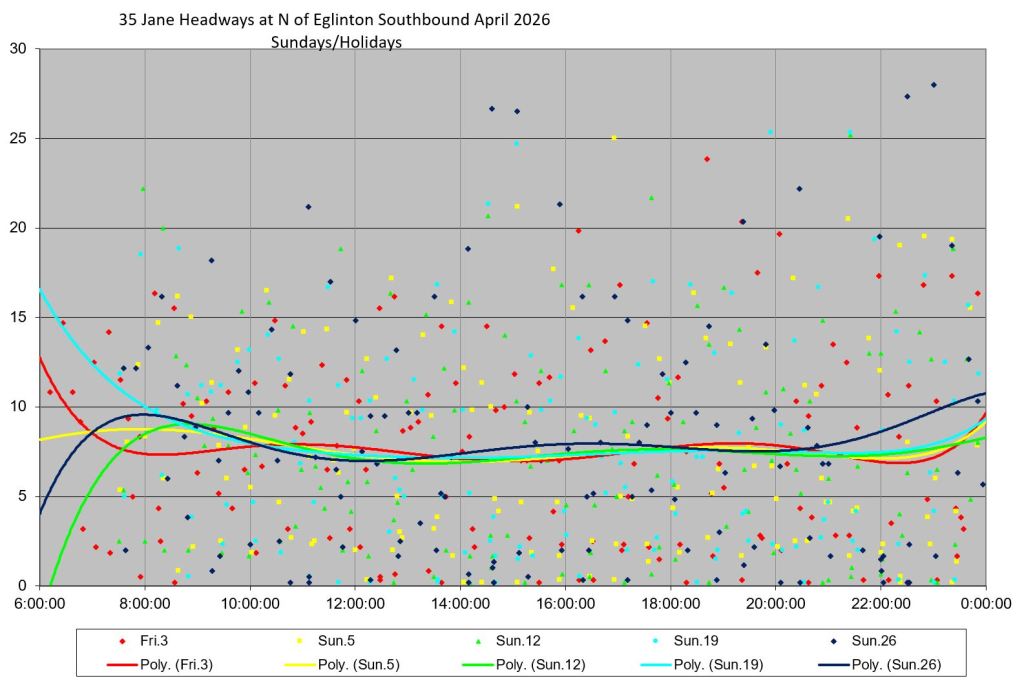
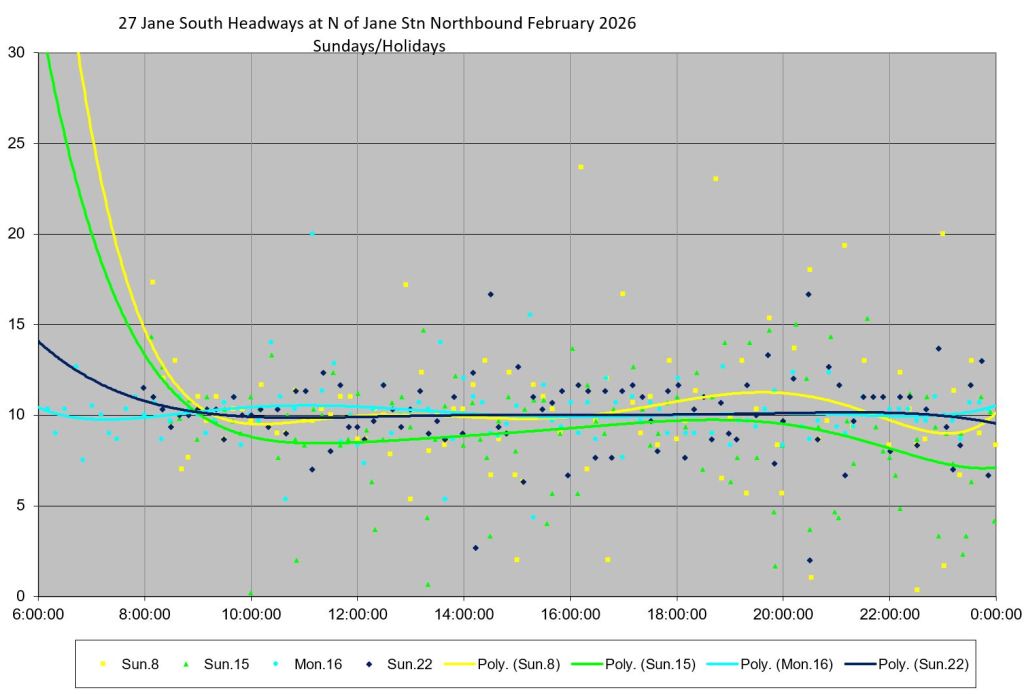
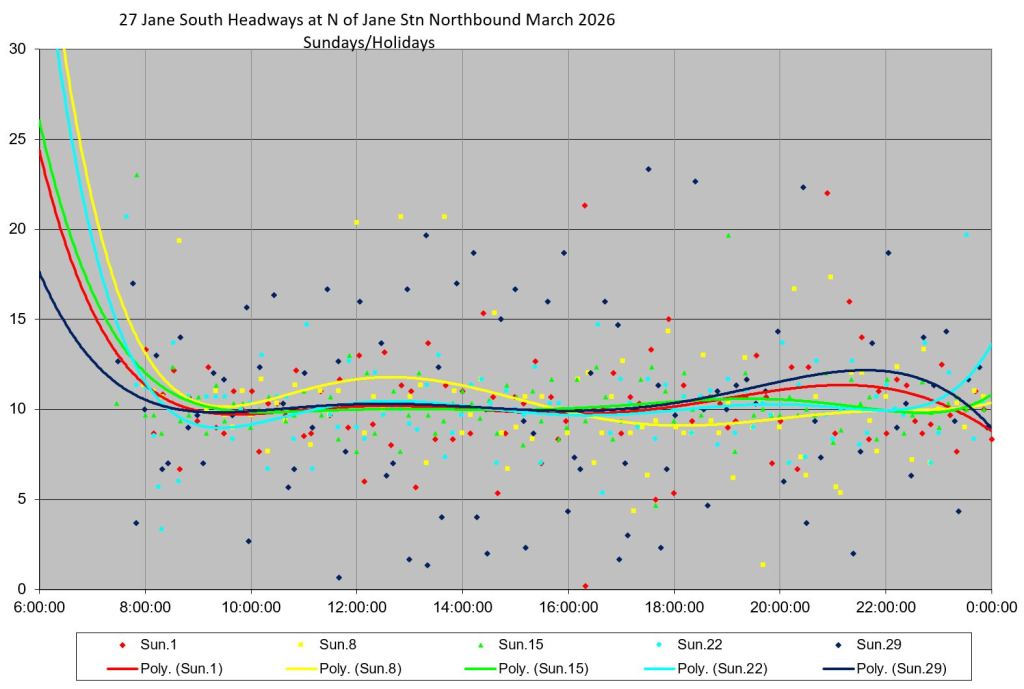
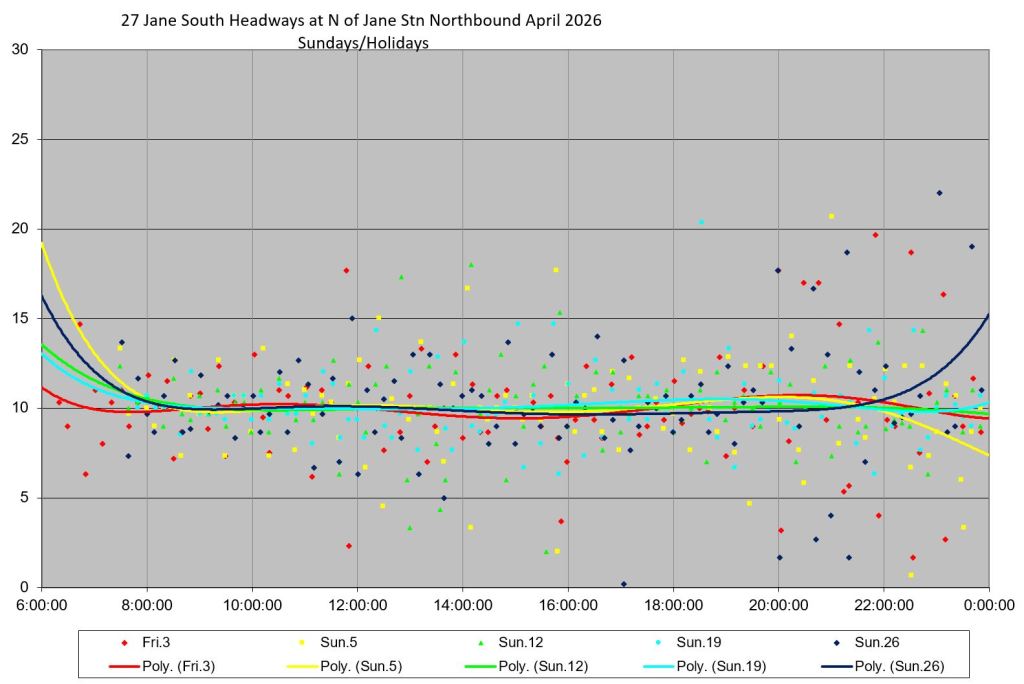
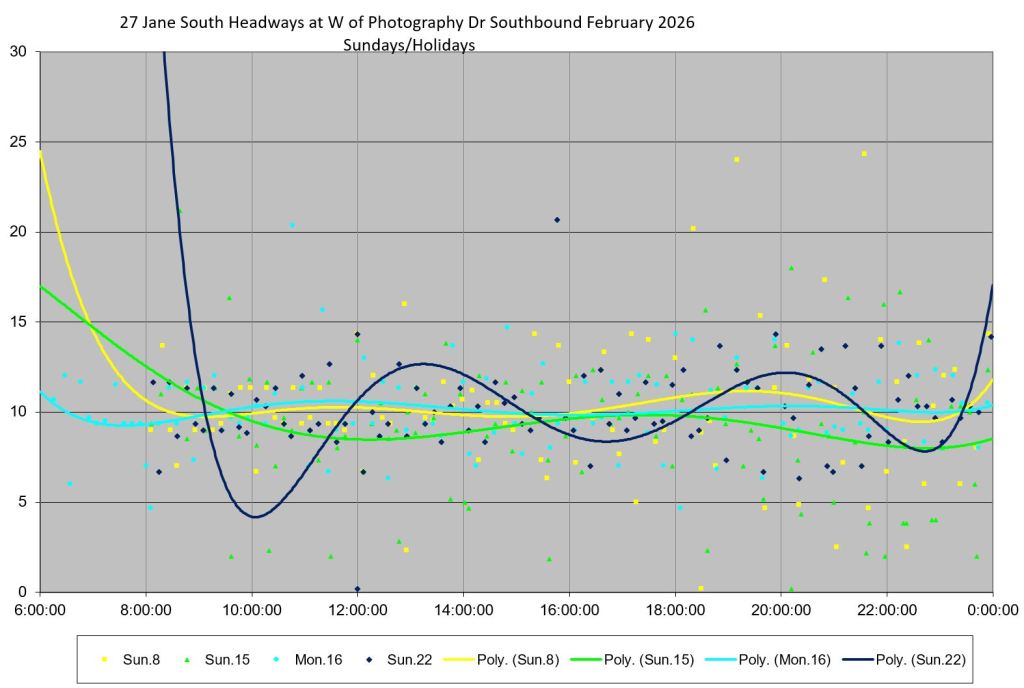
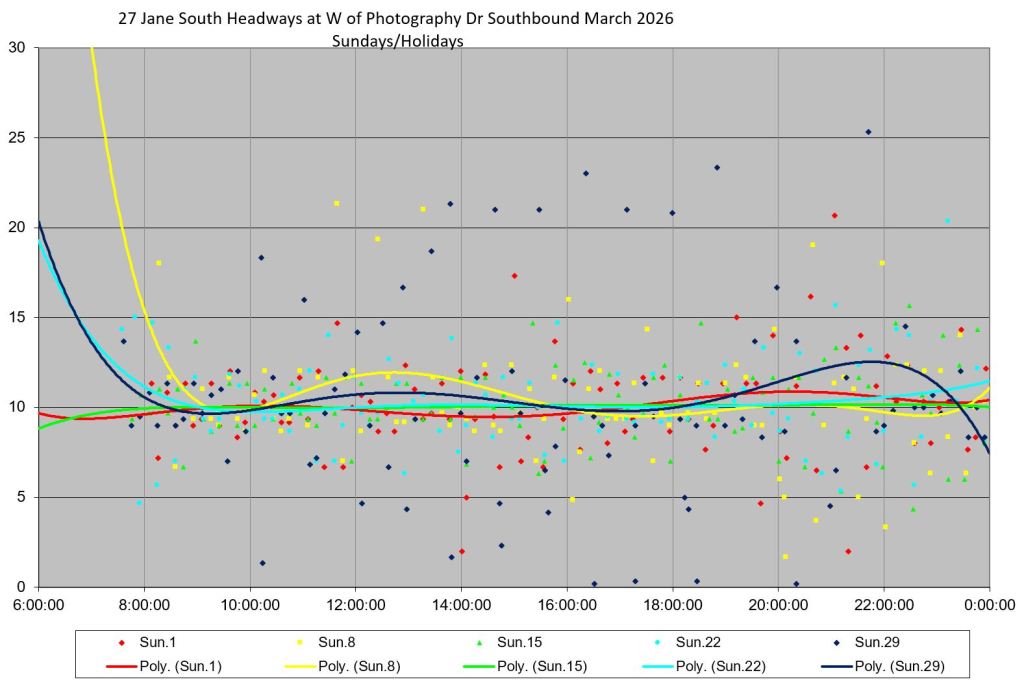
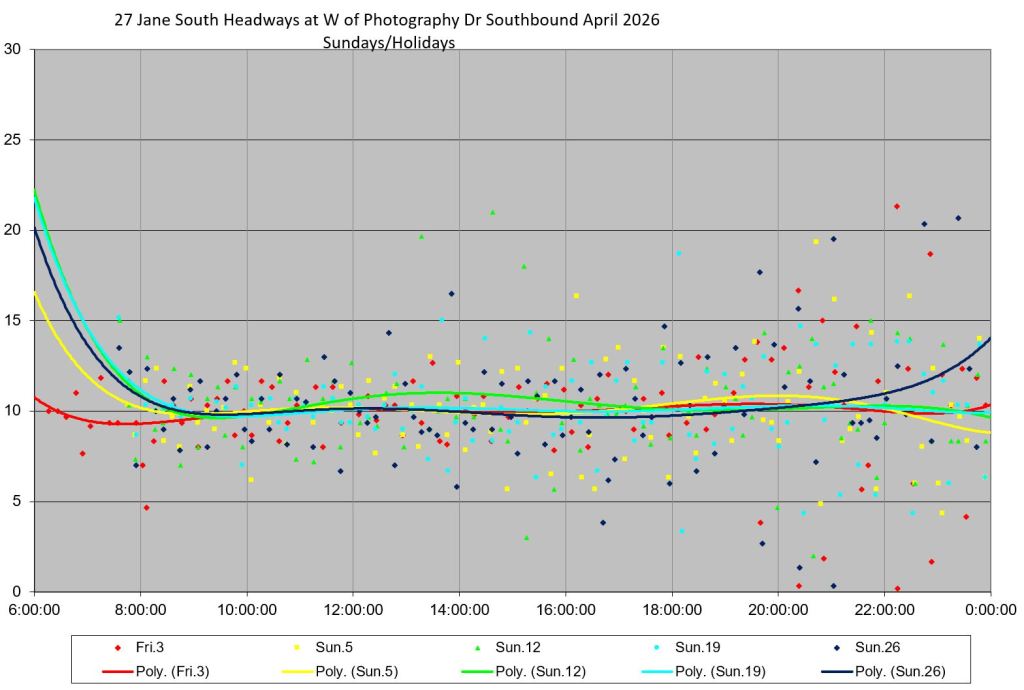
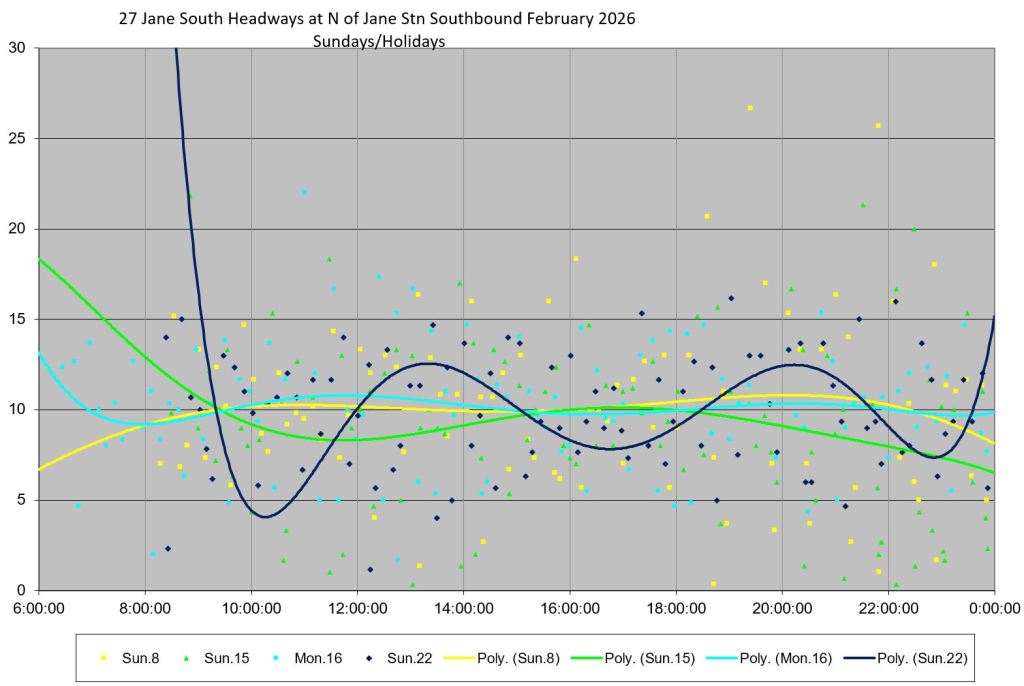
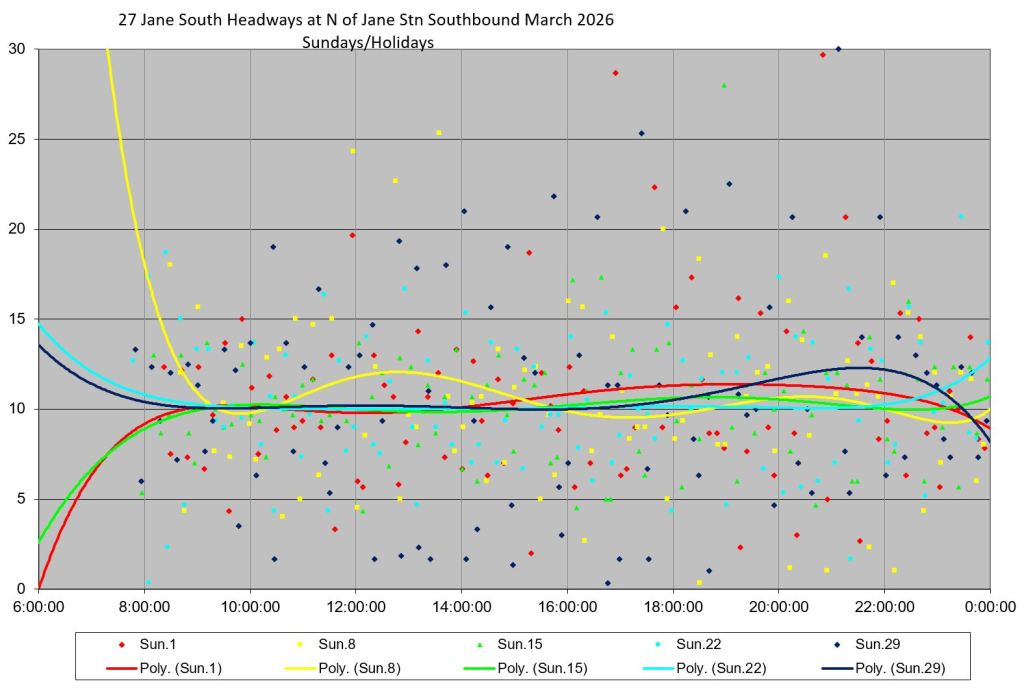
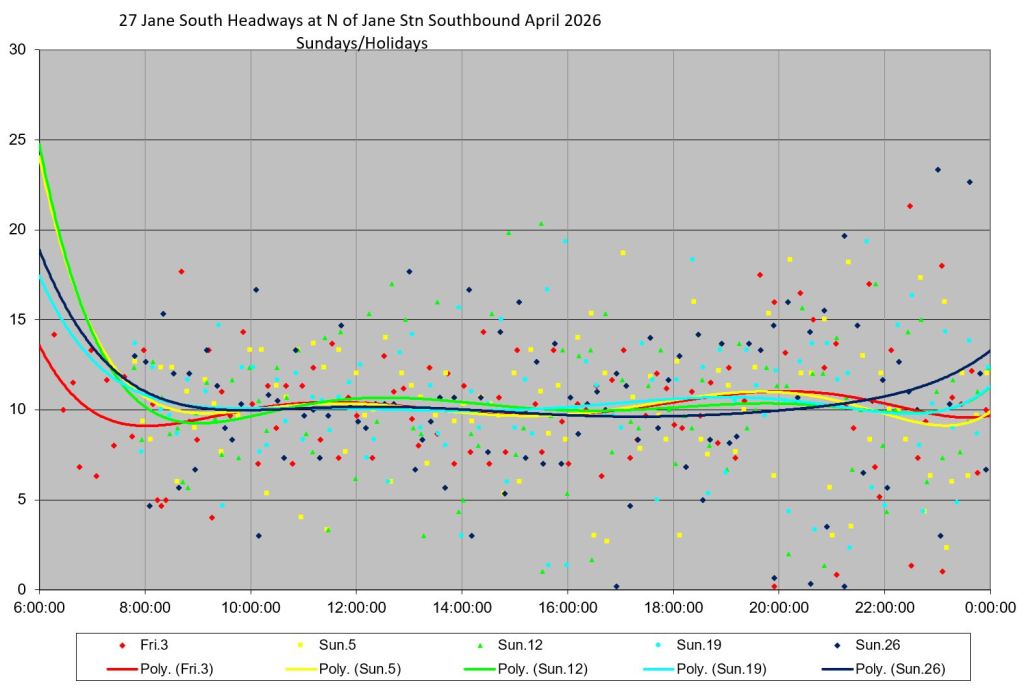
- A detailed chart showing Sunday/Holiday headways.
As a general observation, there is little difference as one moves across rows from February to April data. The measure of scatter in weekday headways, the standard deviation (dotted lines), is high even at terminals, and closes in on the average headway over the course of a journey. This indicates that service is already uneven leaving terminals, and bunching gets worse along the way. The absence of change over three months indicates that this is the accepted behaviour of service on these routes.
The average headways are close to the scheduled values. This indicates that all expected trips actually operated, although not on the regular spacing one might expect from the timetable. (If buses were missing, the averages would be higher than the scheduled service.)
TTC Service Standards dictate that terminal departures can be 1 minute early and up to five minutes late. In practice, the TTC measures itself against a range from 0 minutes early to five minutes late. The intent is to hit this range 90% of the time leaving terminals and 60% arriving.
For a 6 minute headway, this effectively allows a gap of 11 minutes with a bus leaving 5 minutes late behind one that is on time. For a 10 minute headway, a gap of 15 minutes would be allowed.
Headway standards work differently and are based on deviation from the scheduled spacing, not as an “on time” metric as riders on frequent services don’t care about the schedule, only the reliability.
For a 6 minute headway, the gap can range from 3 to 9 minutes. For a 10 minute headway, the gap can range from 5 to 15 minutes. The target is to stay within these limits 60% of the time.
It is self-evident that there is a lot of room here for service outside of the “standard” notably allowing 40% of buses to exceed the maximum allowed gap. In any event, the TTC does not report on headway adherence, and so the standard, such as it is, does nothing.
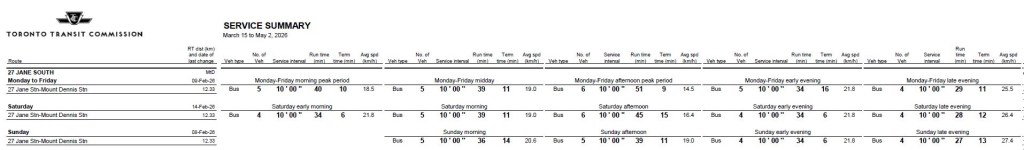
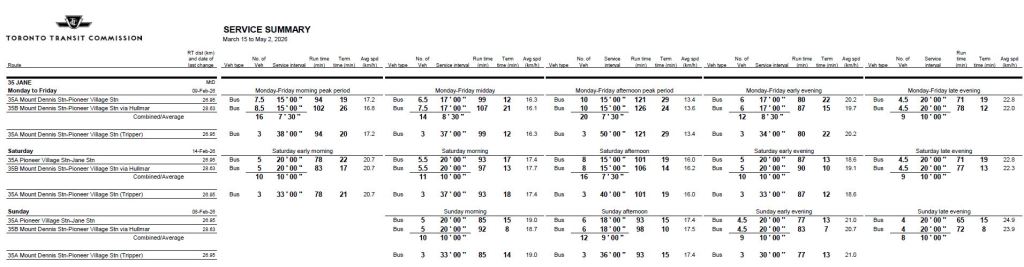
Scheduled Service
Service on 27 Jane South is scheduled at 10’00” at all times. On 35 Jane, service runs from every 7’30” to every 10’00”.
Trippers on 35 Jane are spare buses available for redeployment as shuttles in case of service interruptions on LRT lines. These were changed to 935 Jane Express trippers in May, but that is beyond the scope of this article.
35 Jane Service Northbound From Mount Dennis Stn
Leaving Mount Dennis
The headways leaving Mount Dennis northbound show a quite similar pattern over three months with a fairly uniform scatter of data points between zero and ten minutes all day. It is simply not possible that this meets the +0/-5 window cited by Service Standards. The situation is worse on weekends, particularly on Sundays.
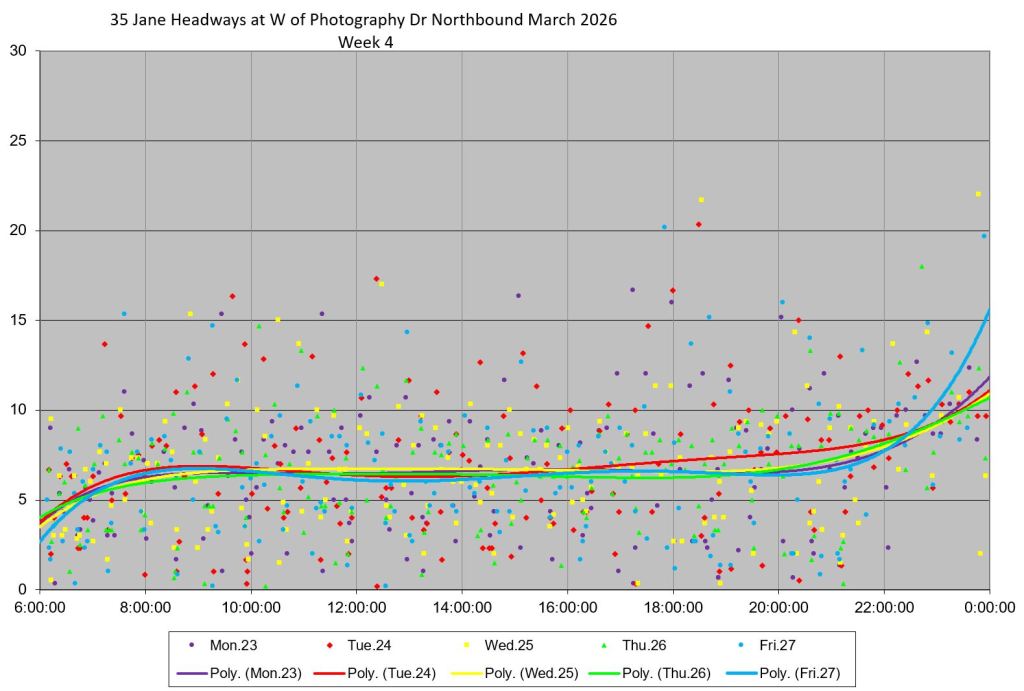
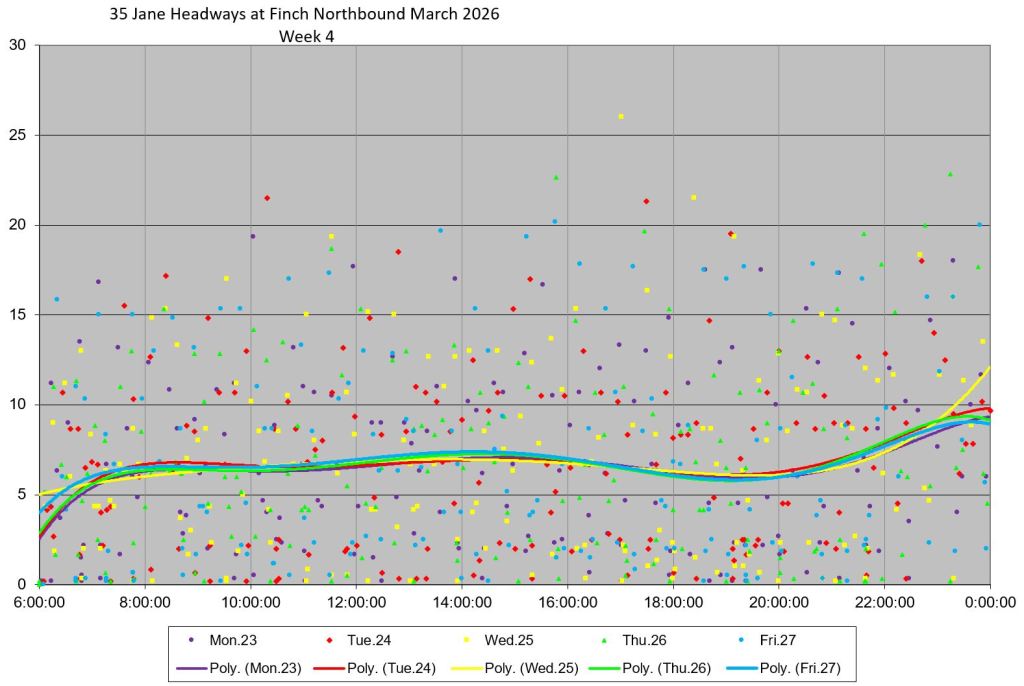
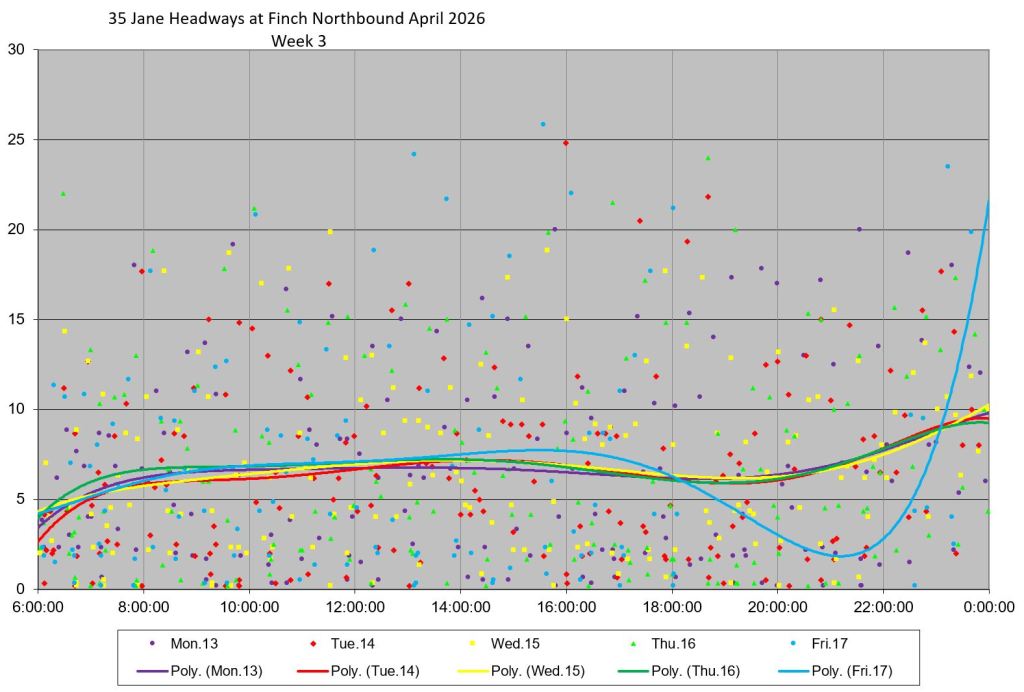
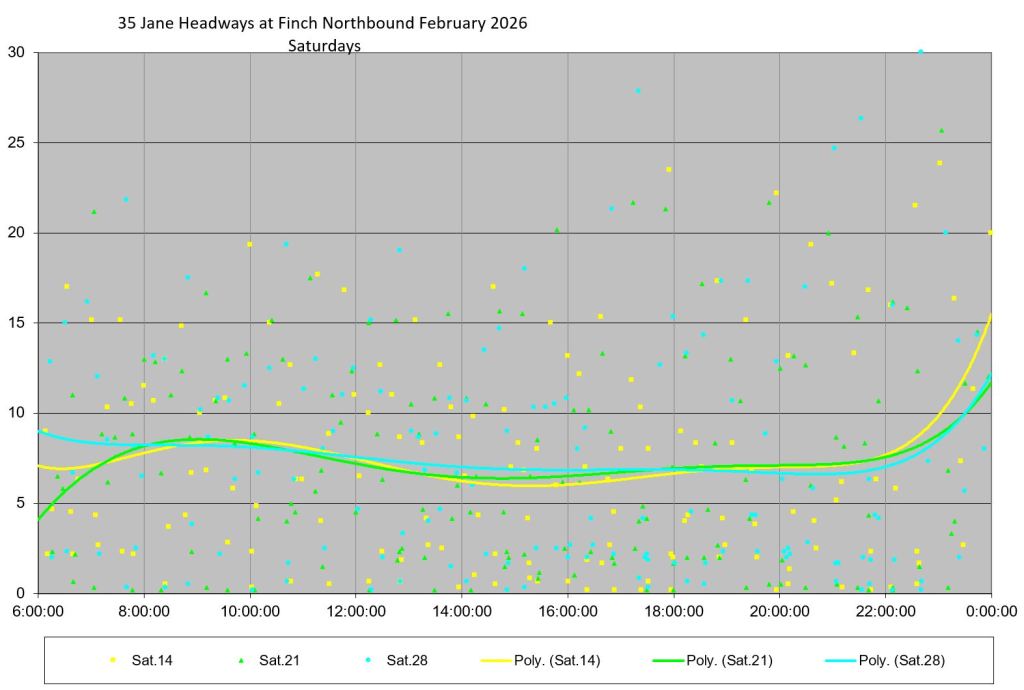
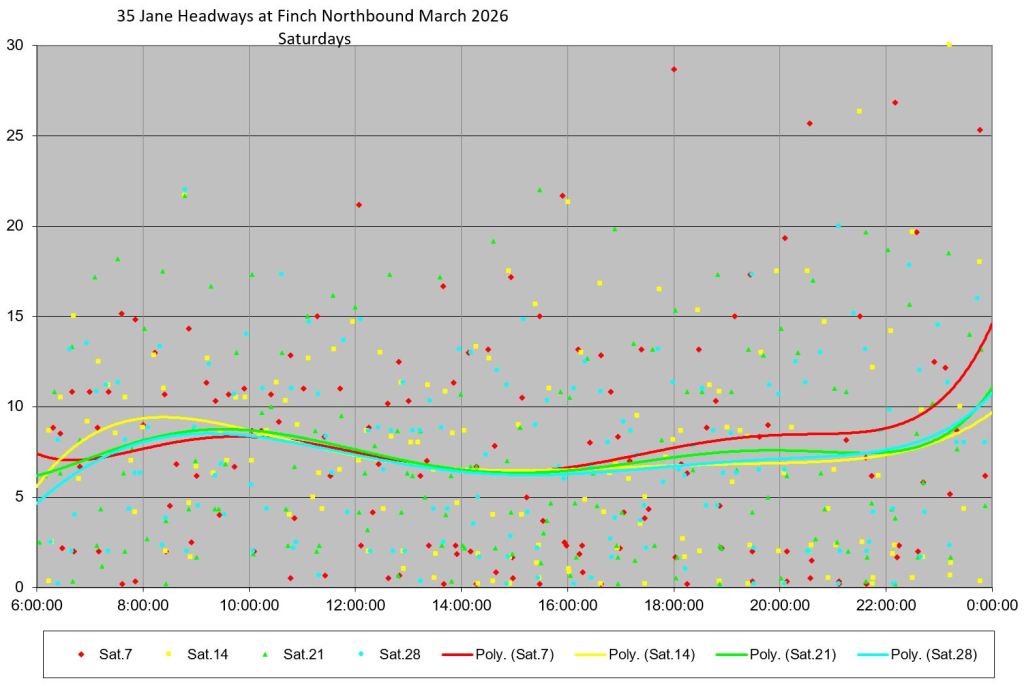
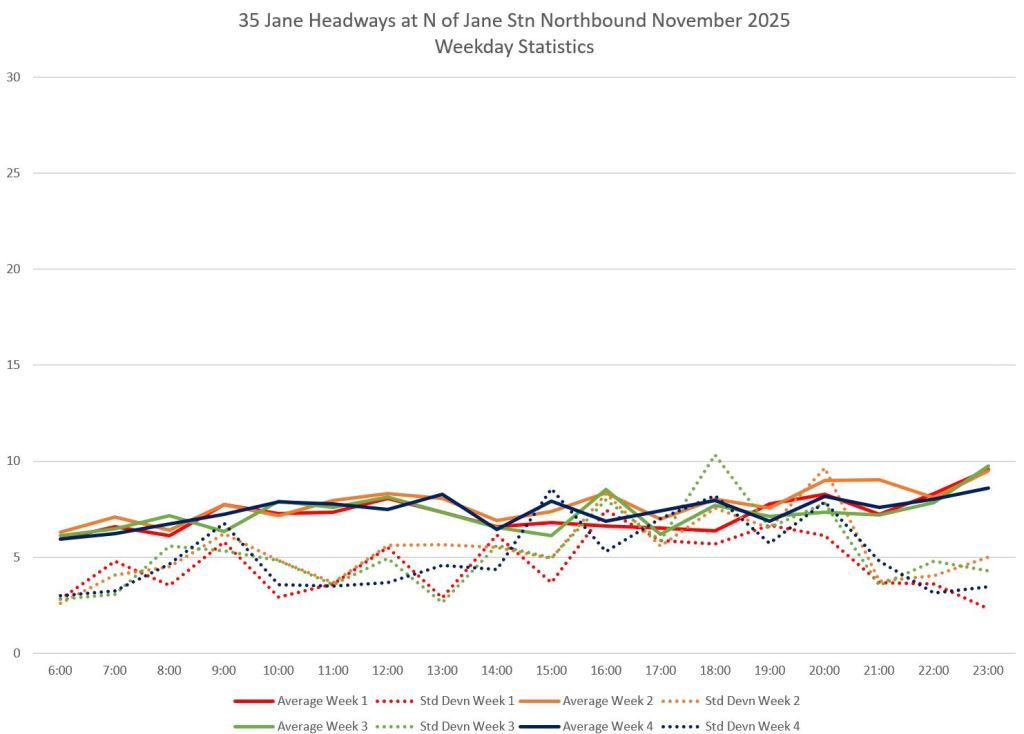
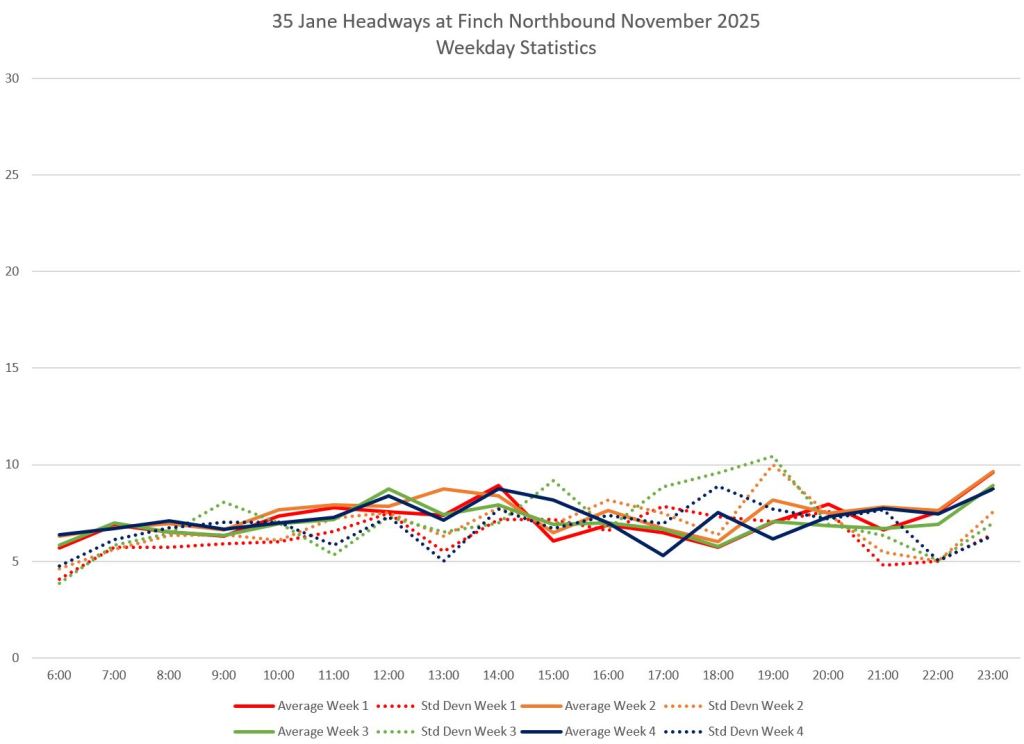
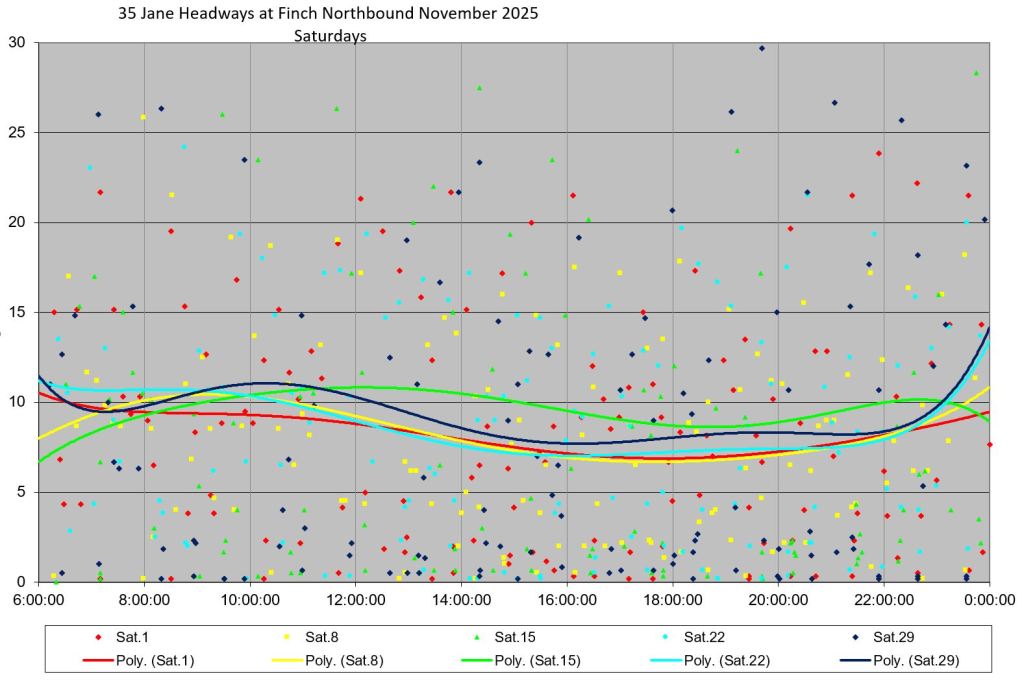
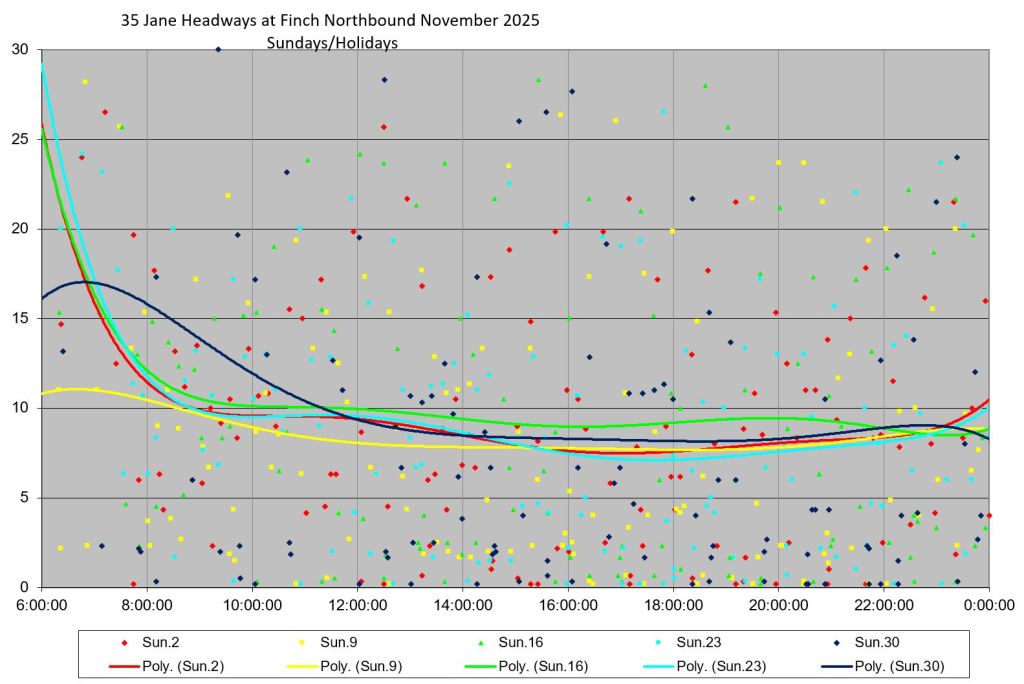
Northbound at Finch
By the time the service reaches Finch (south of the top end split loop), the standard deviation values (dotted) are close to the same values as the average headways indicating extensive bunching. This does not vary by time of day and there is no visible peak period effect in the weekday data. Headway values from 0 to 20 minutes are common.
35 Jane Service Southbound From Pioneer Village Stn
Southbound Leaving Pioneer Village Stn
As with the northbound service, departure headways are already spread over a range of values from 0 to 15 minutes on weekdays, with higher values on weekends.
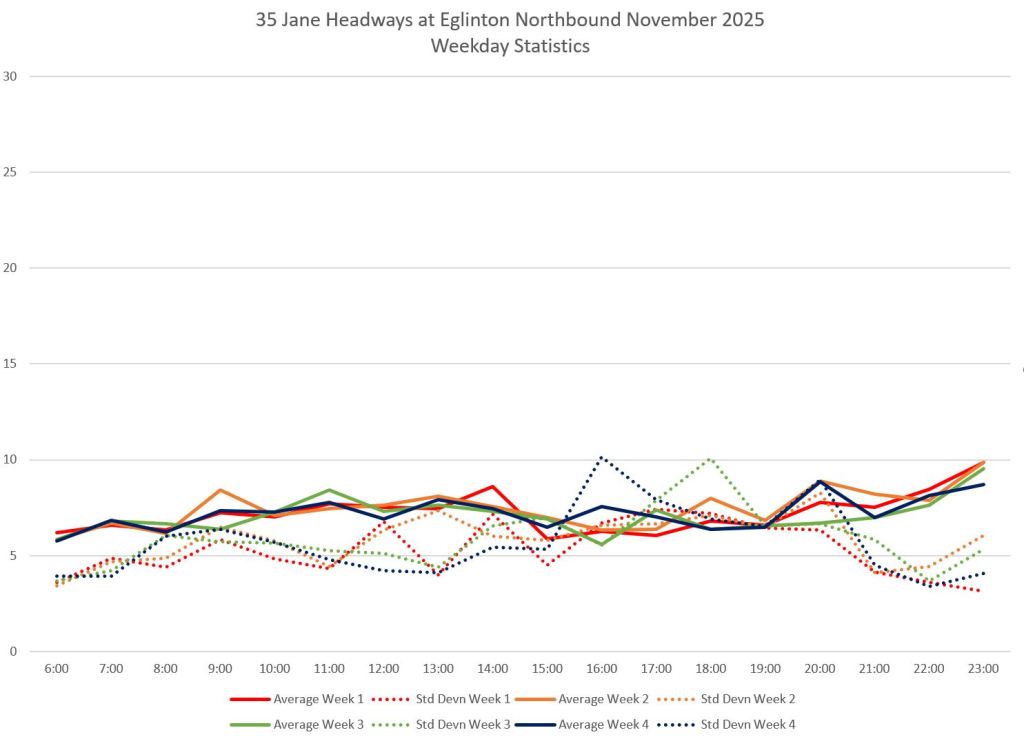
Southbound at Eglinton
Southbound at Eglinton shows the same pattern as northbound at Finch with headways from 0 to 20 minutes all day, and many points in the 20-30 minute range on Sunday.
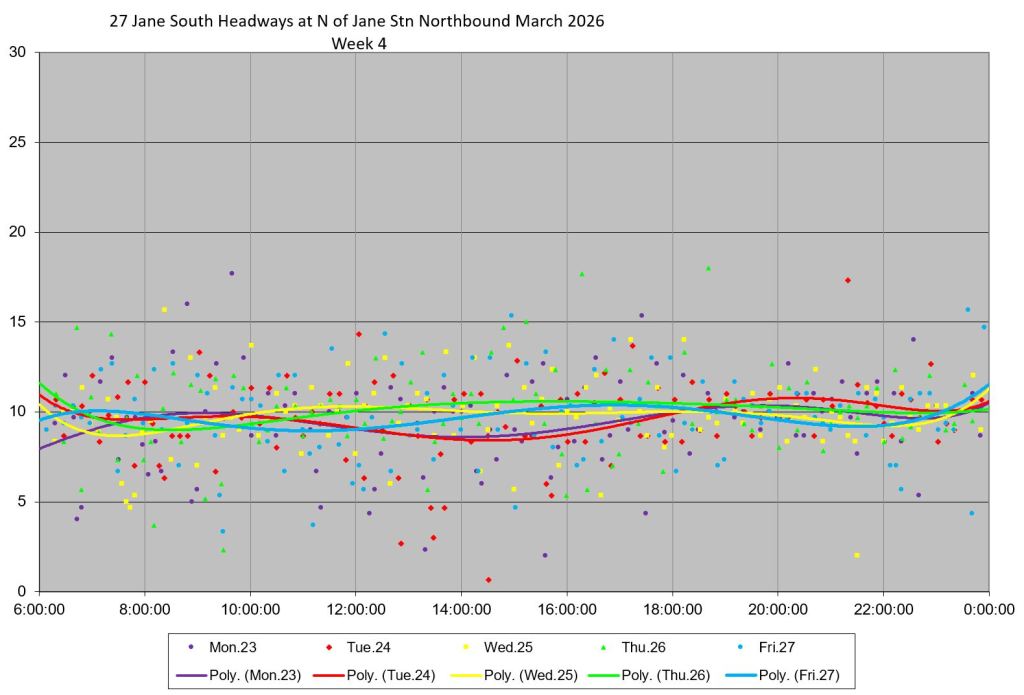
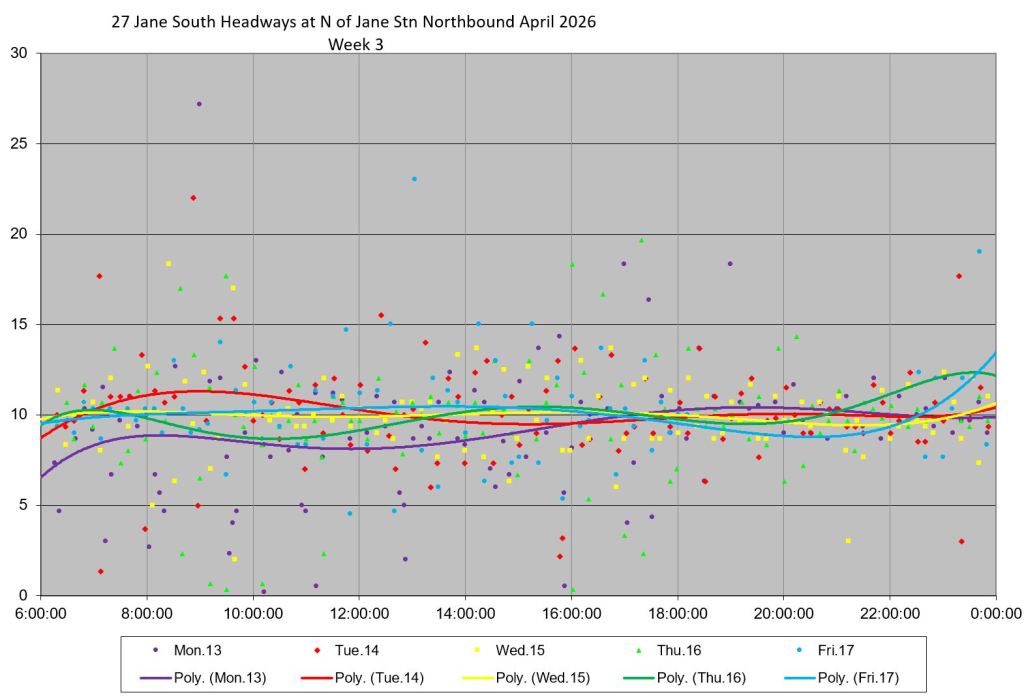
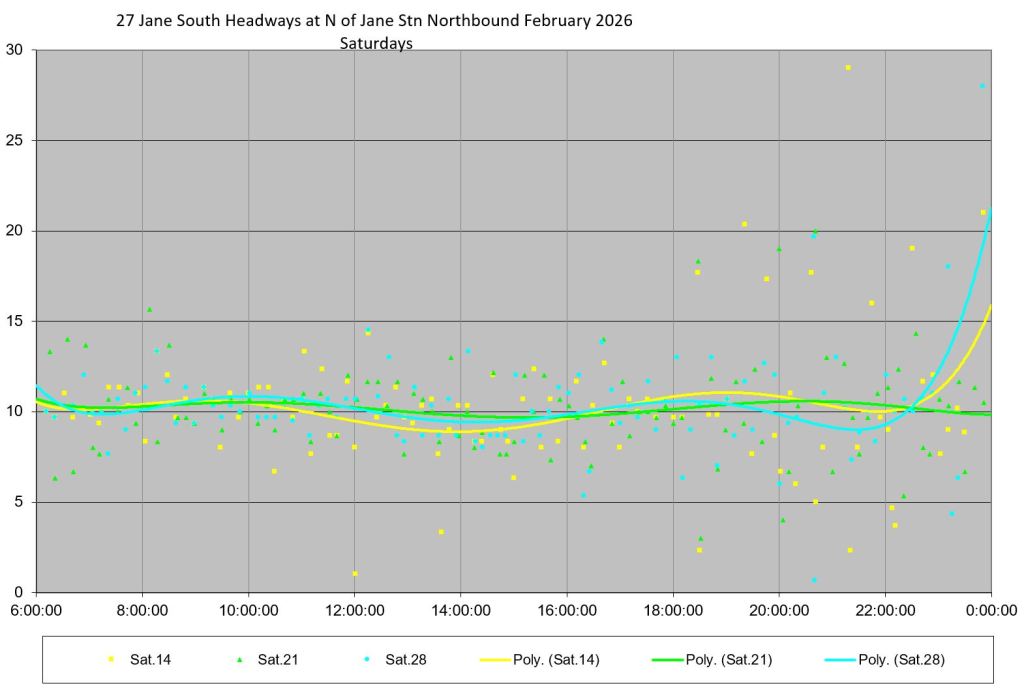
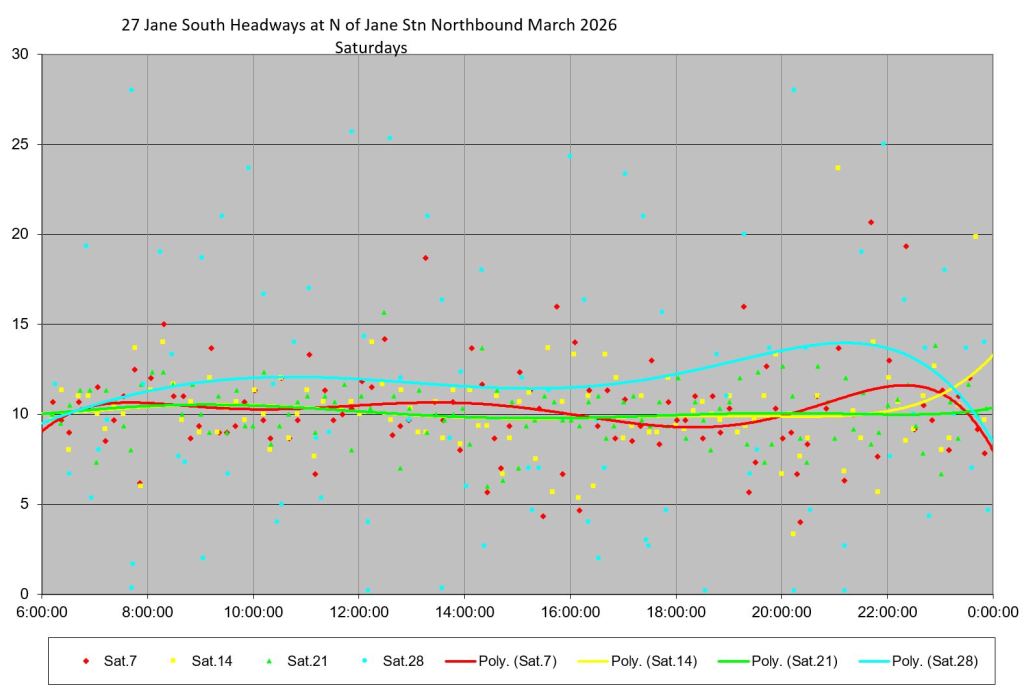
27 Jane South Service Northbound from Jane Station
Northbound from Jane Station
Service leaving Jane Station was noticeable more scattered in February with SD values over 5 minutes. Things improved slightly in March and April, but there remains a fairly wide spread in headway values.
Note that at a 10 minute headway, the Service Standards allow gaps up to 15 minutes. Whether the service shown here would be considered “good” by riders is another matter.
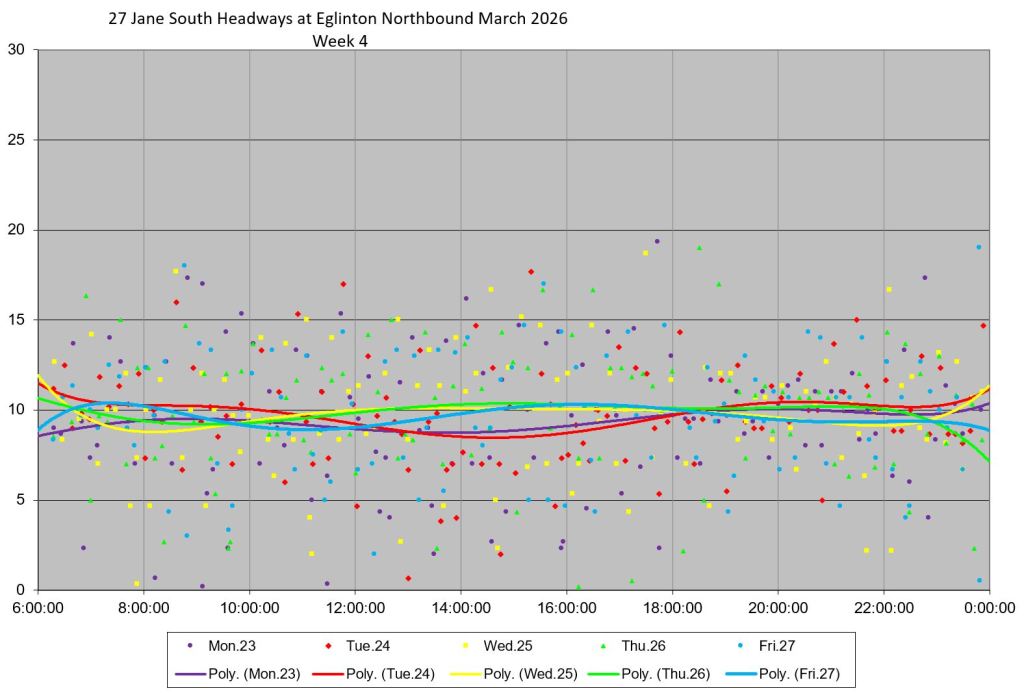
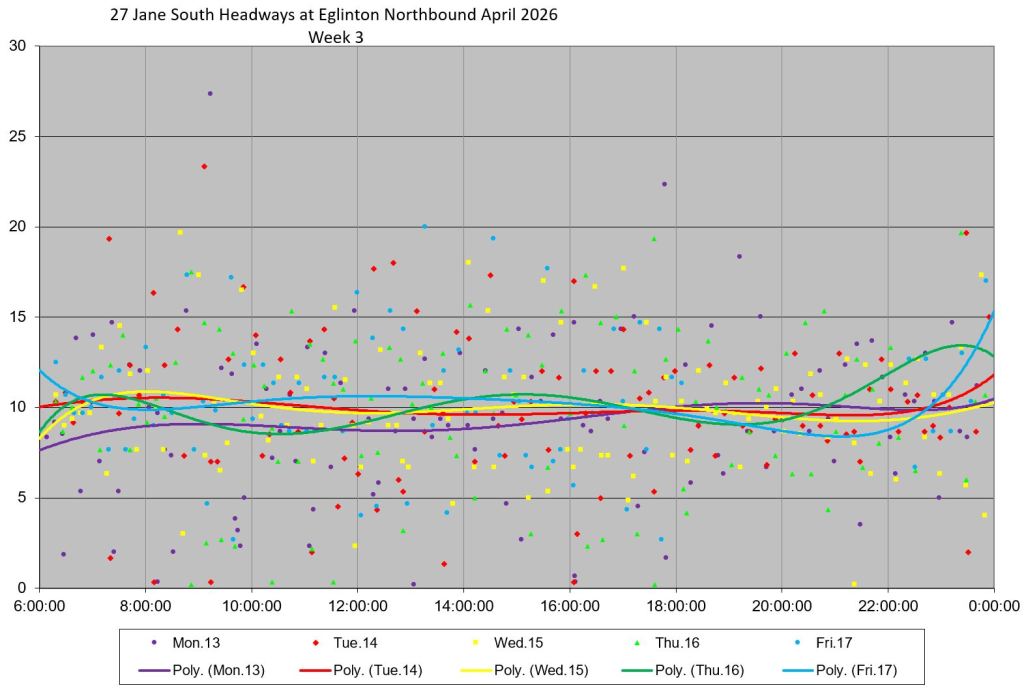
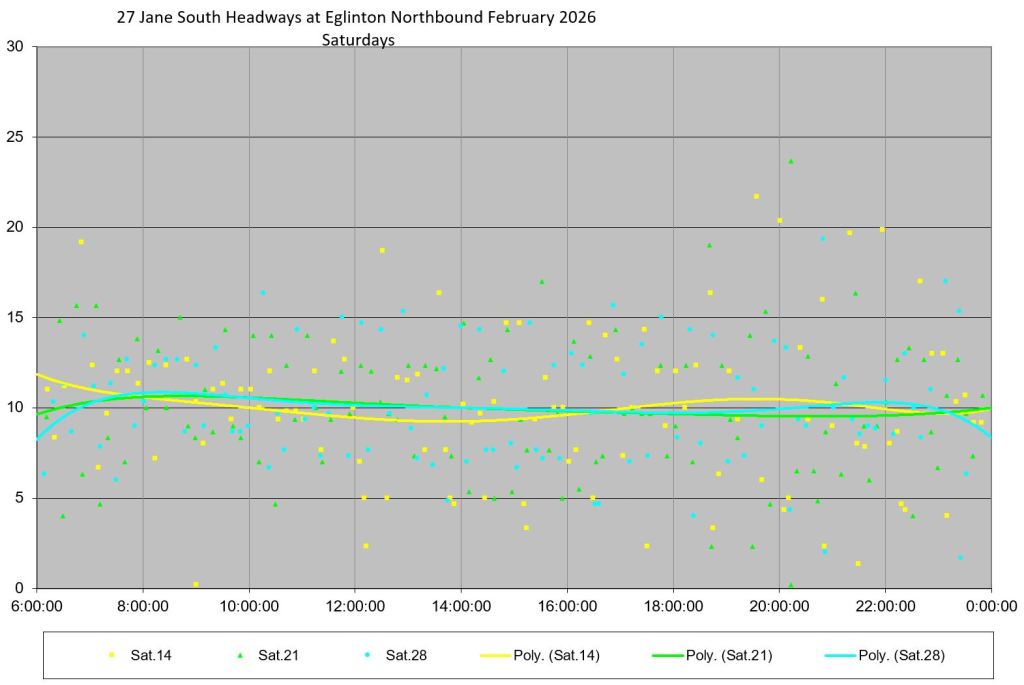
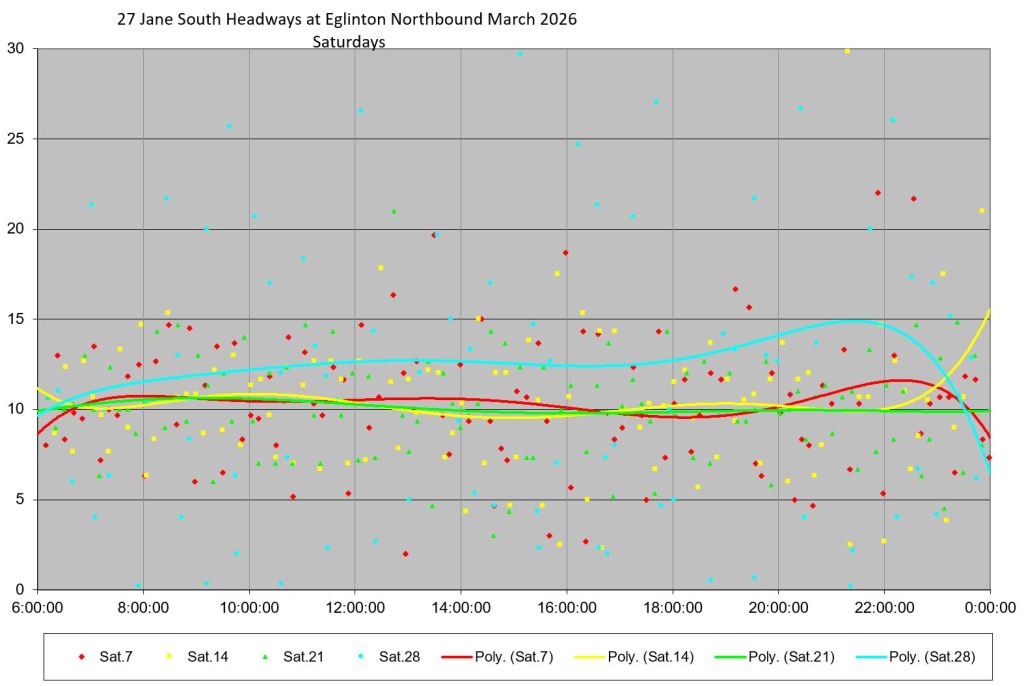
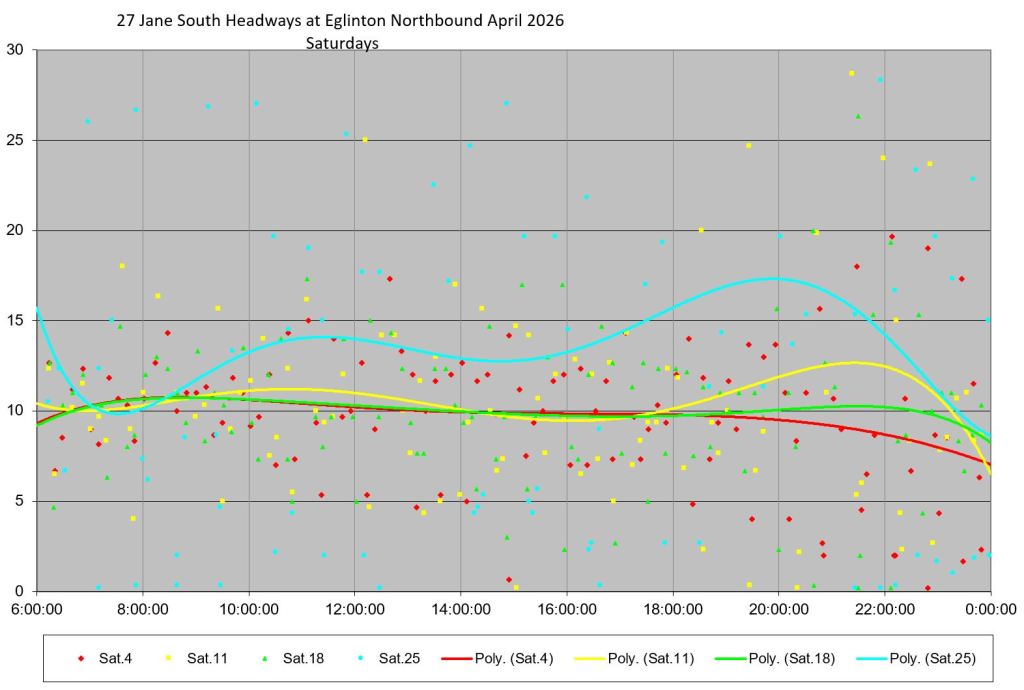
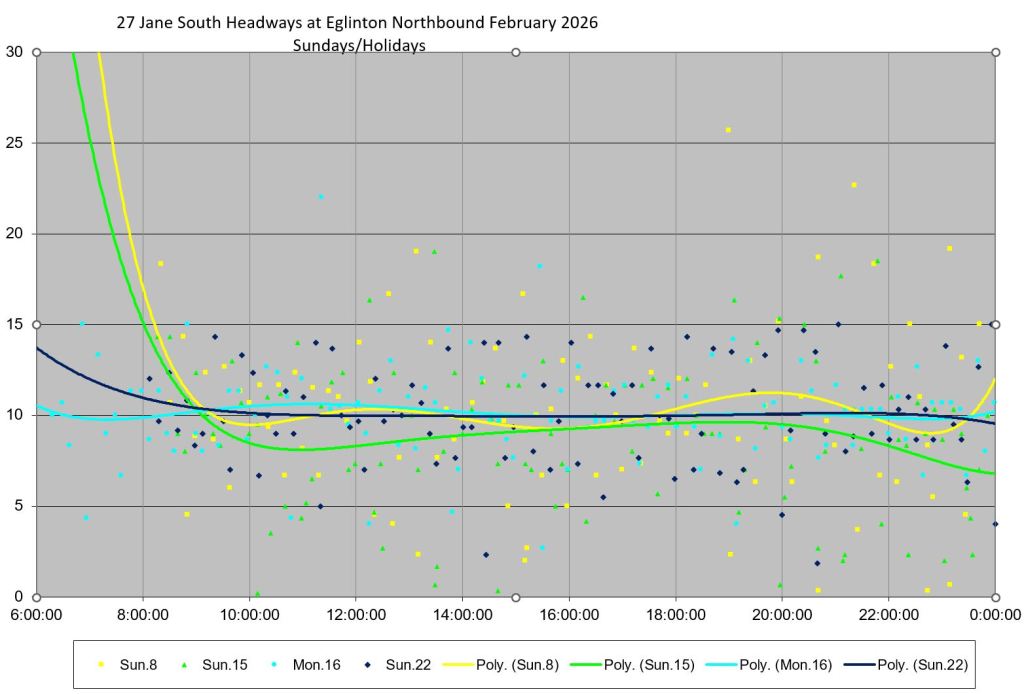
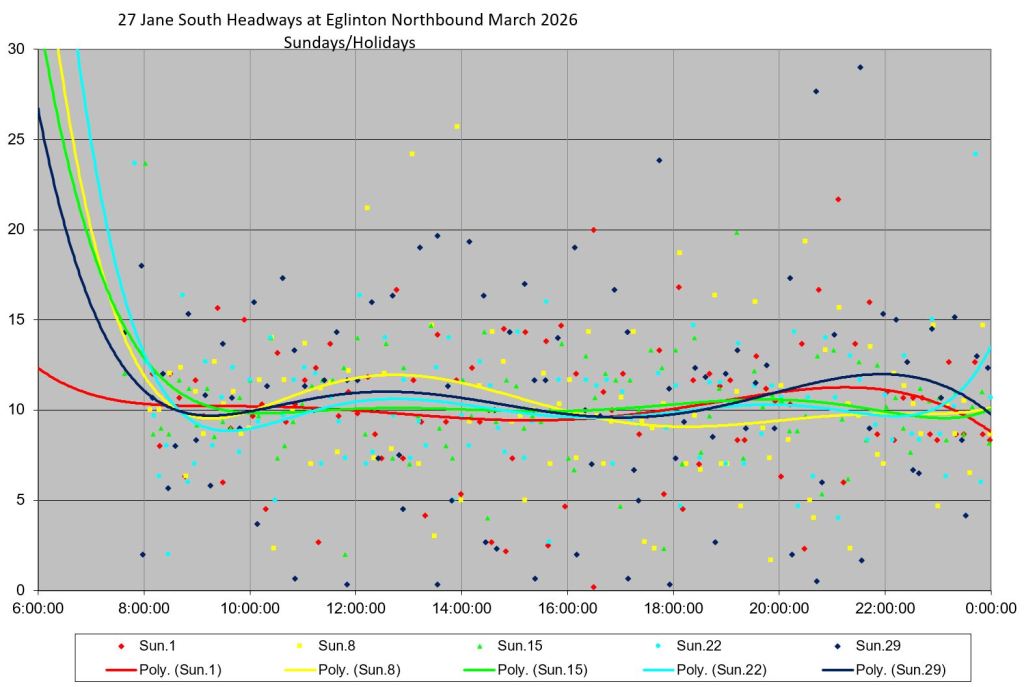
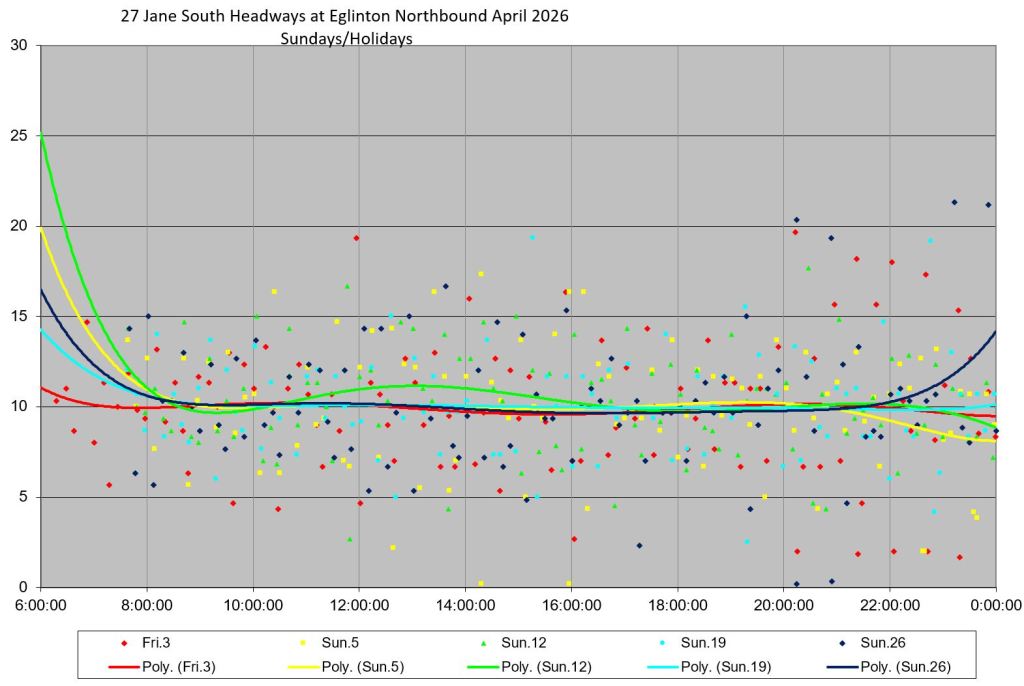
Northbound at Eglinton
At Eglinton, the spread in headway values widens with many points lying beyond the 15 minute bound. However, the target is to only hit that 60% of the time, and this allows much erratic service to be claimed as “within Board approved standards”.
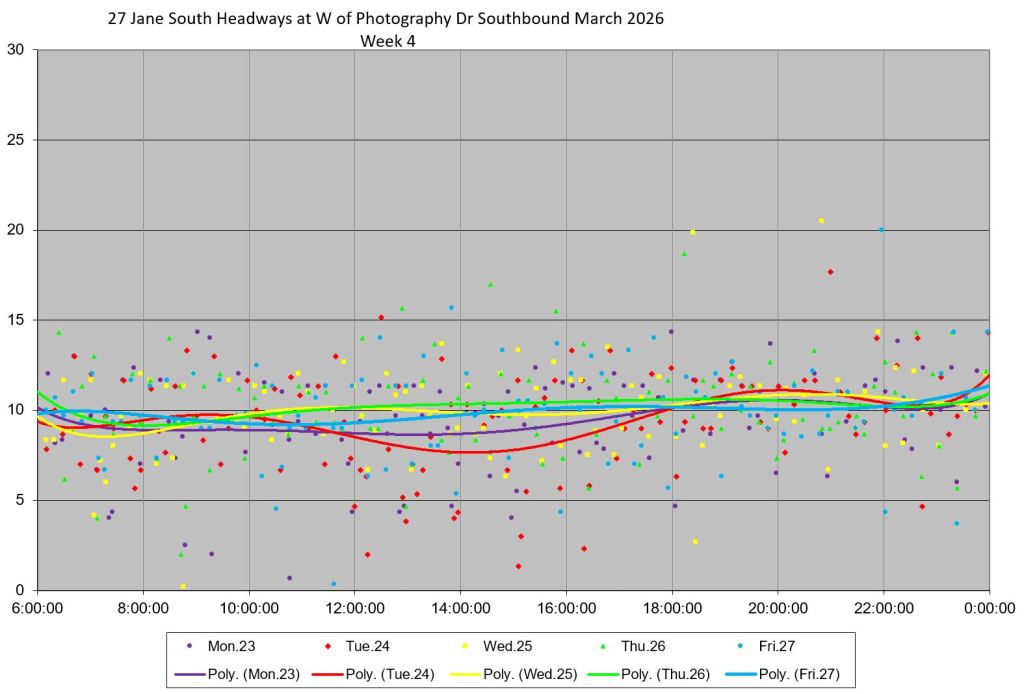
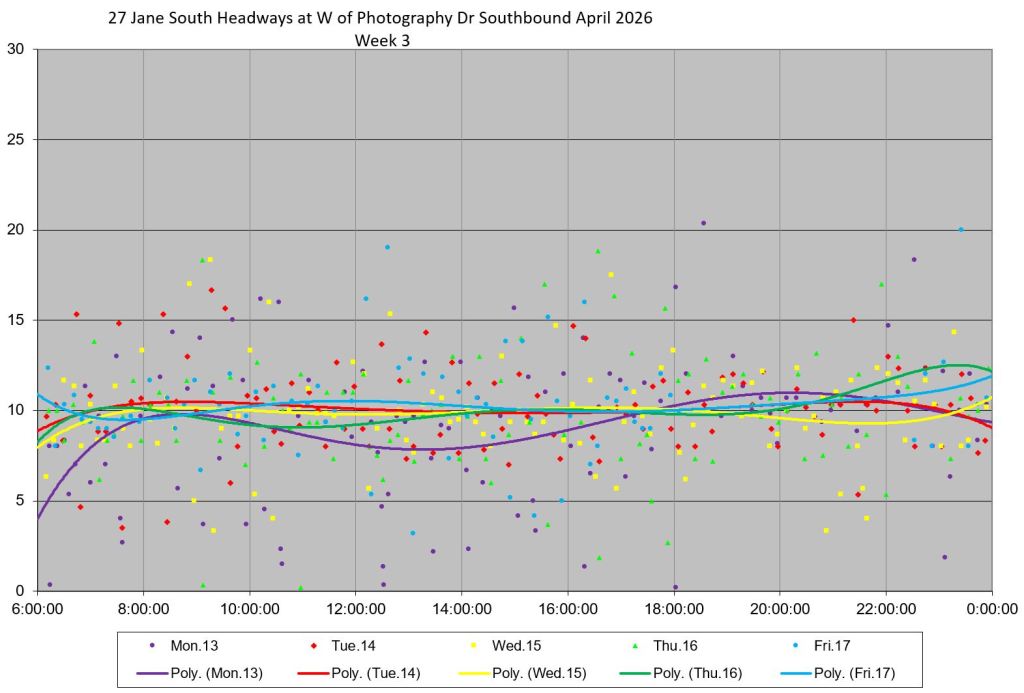
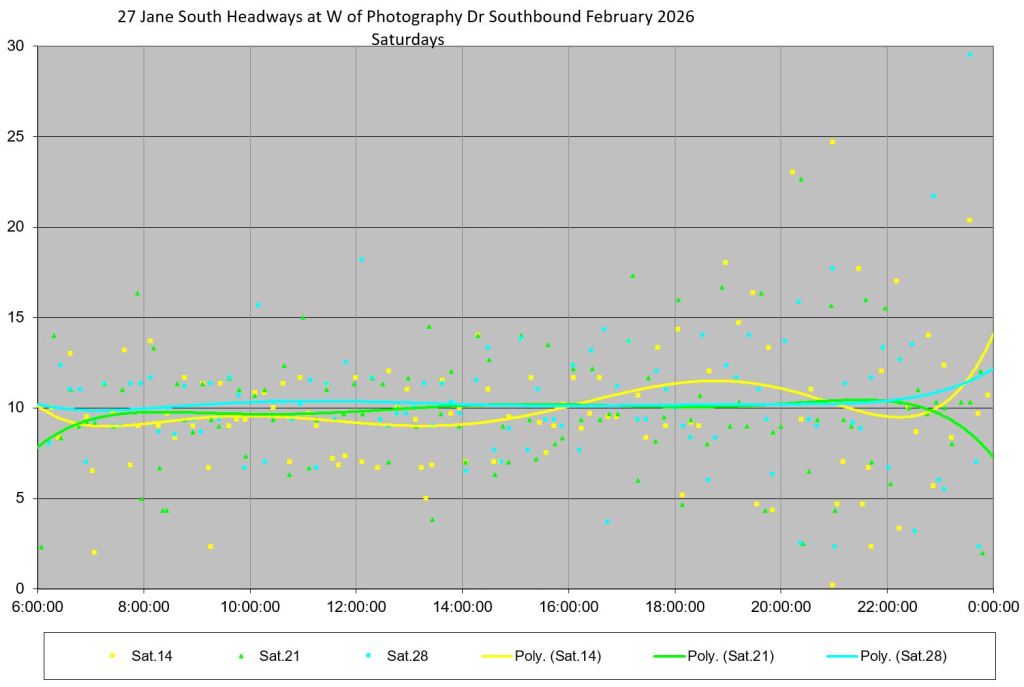
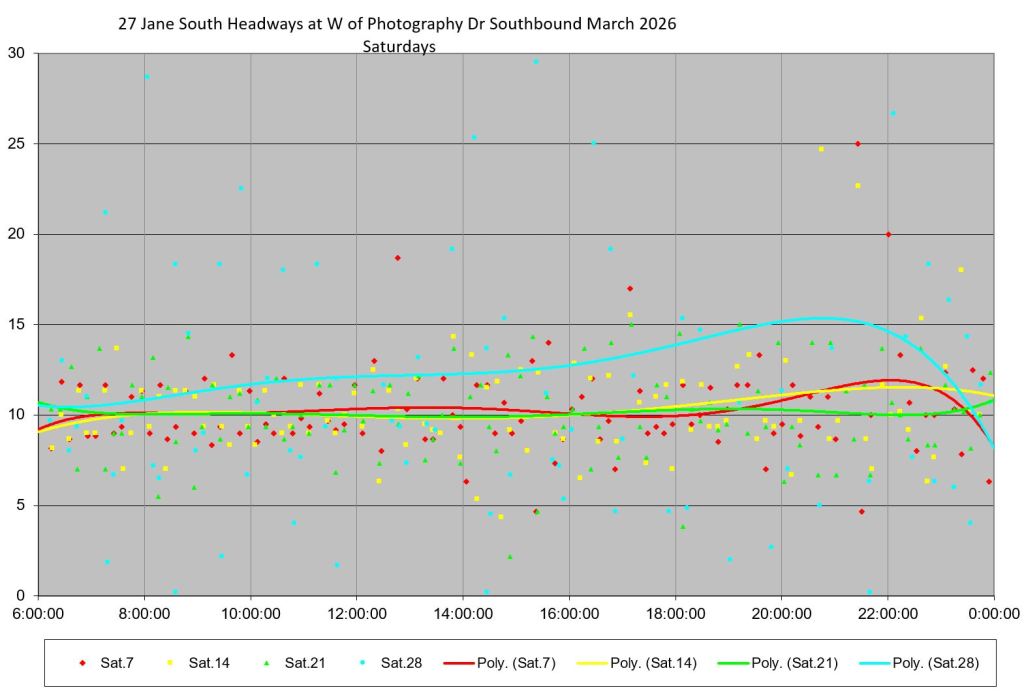
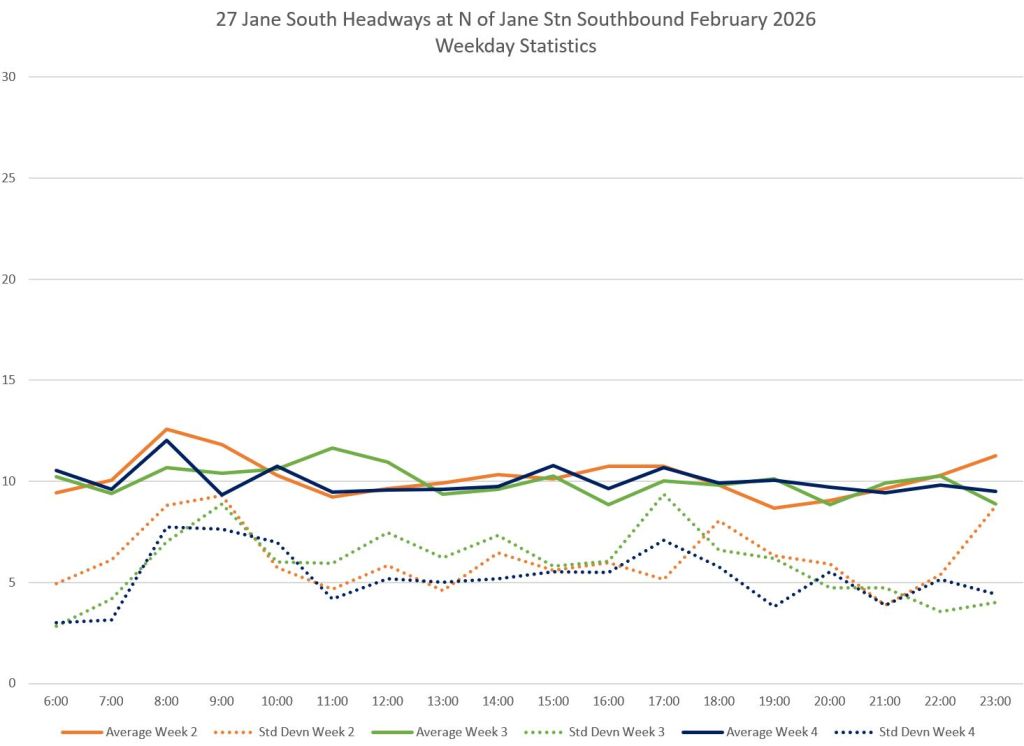
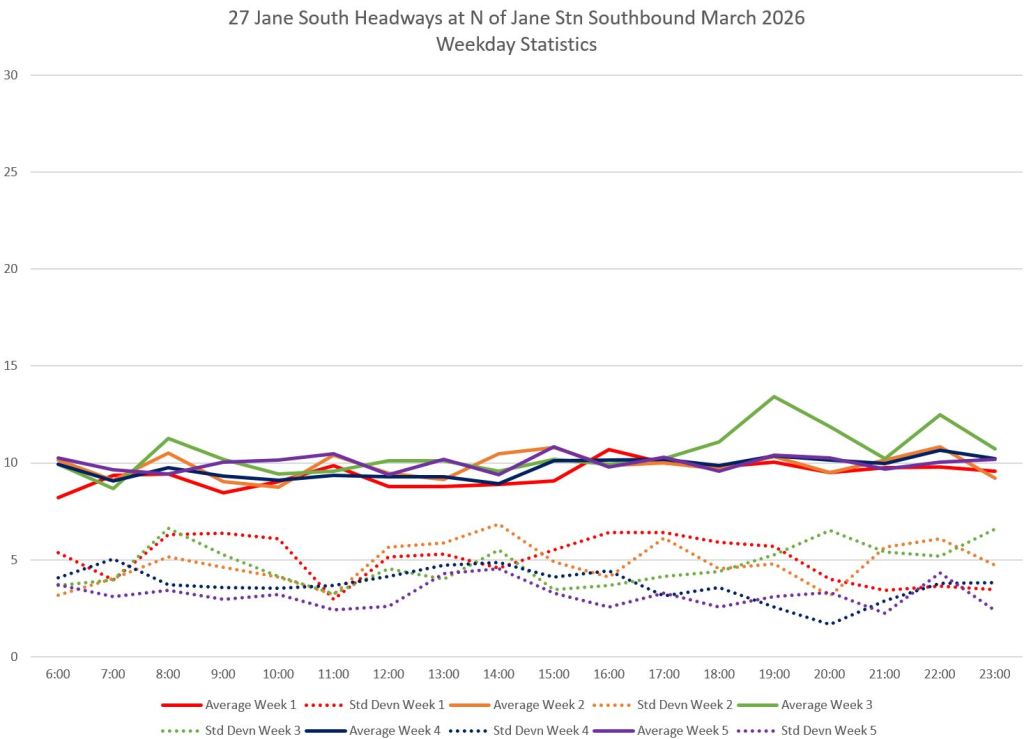
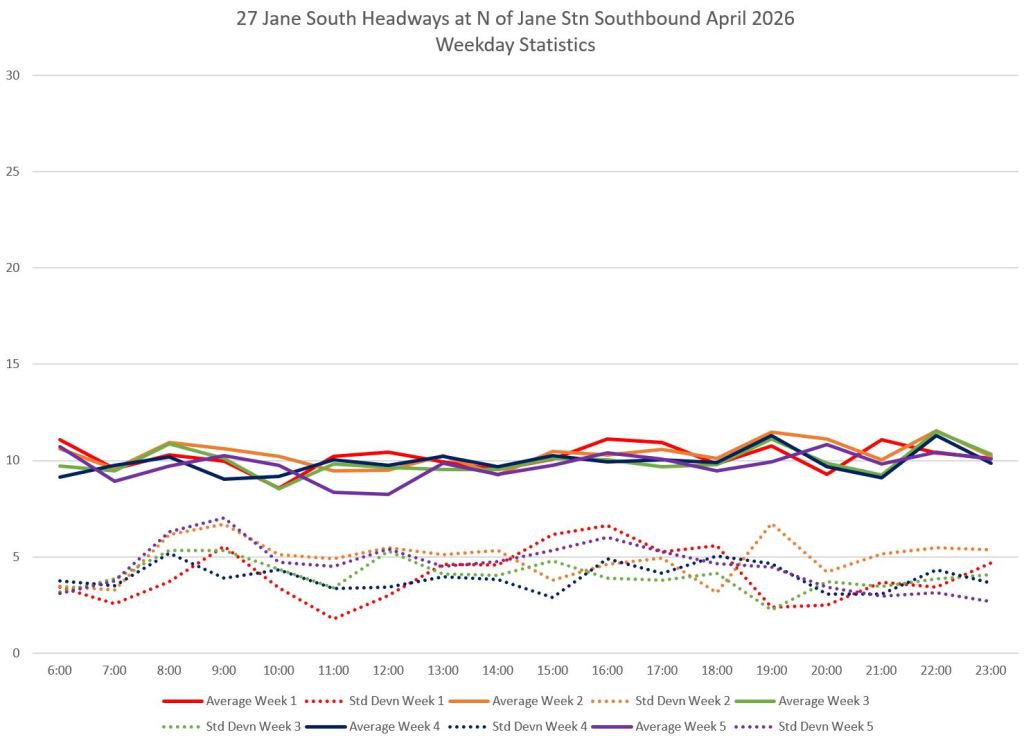
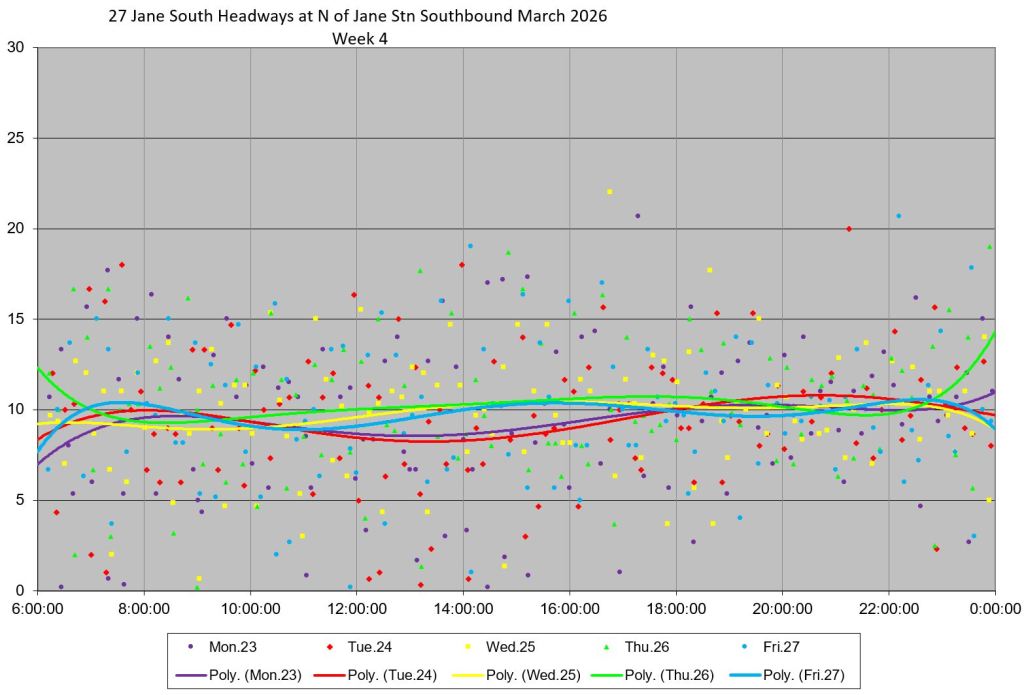
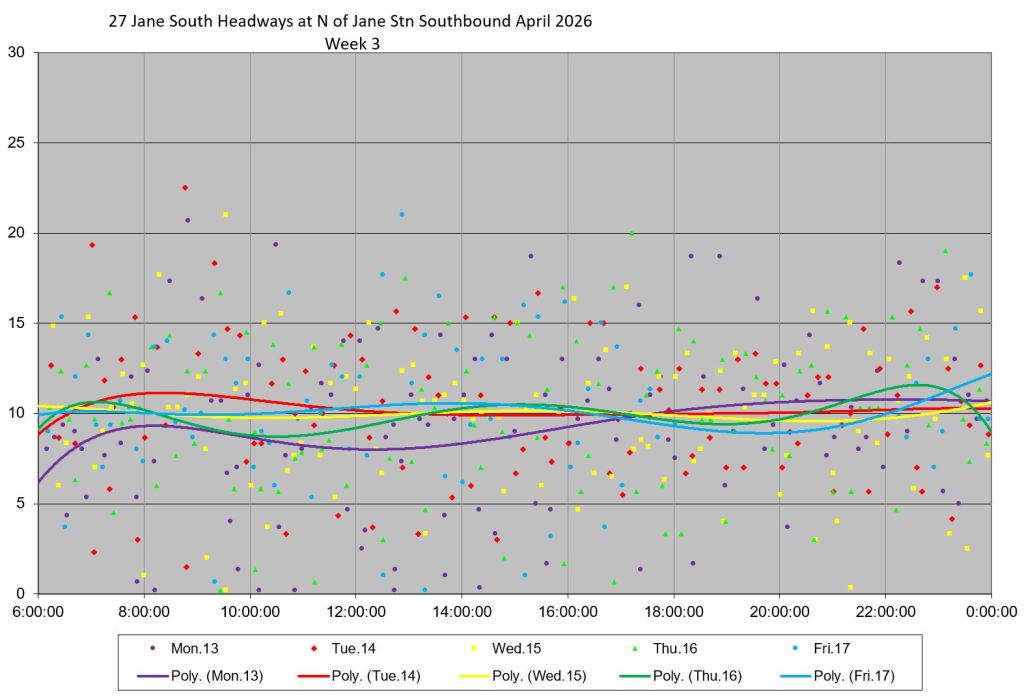
27 Jane South Service Southbound from Mount Dennis
Southbound leaving Mount Dennis Station
During February, service southbound from Mount Denns was extremely erratic with many headways over 15 minutes. Things improved in March and April, relatively speaking, but the spread in values was still high for a point close to the terminus.
Southbound at Jane Station
Service arriving at Jane Station shows a similar pattern to other locations with a wide dispersion of headways particularly on Sunday in March.
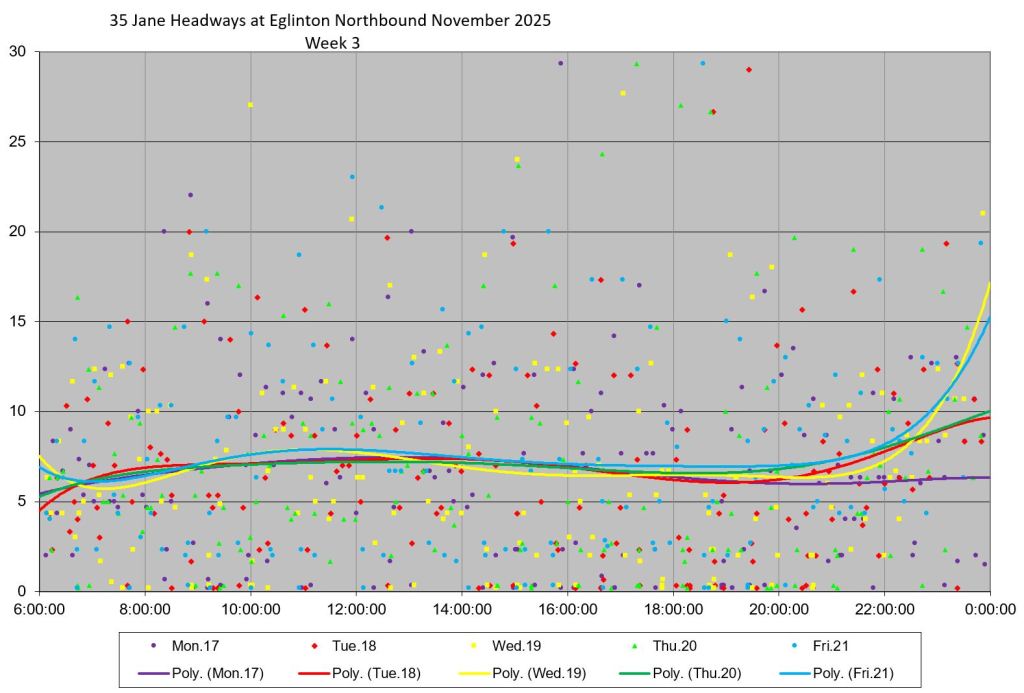
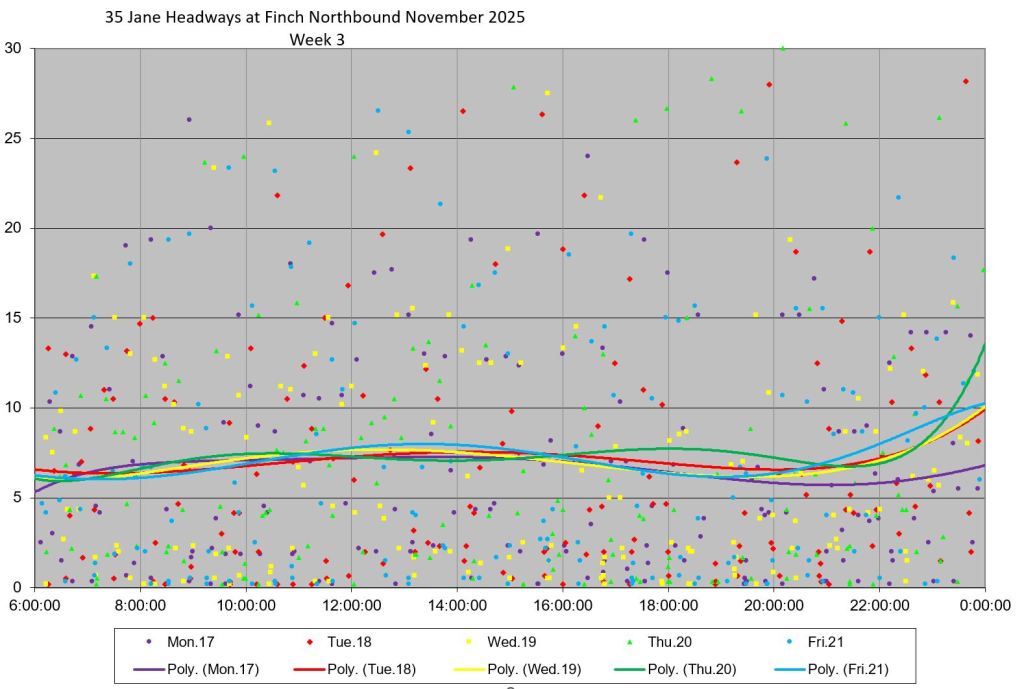
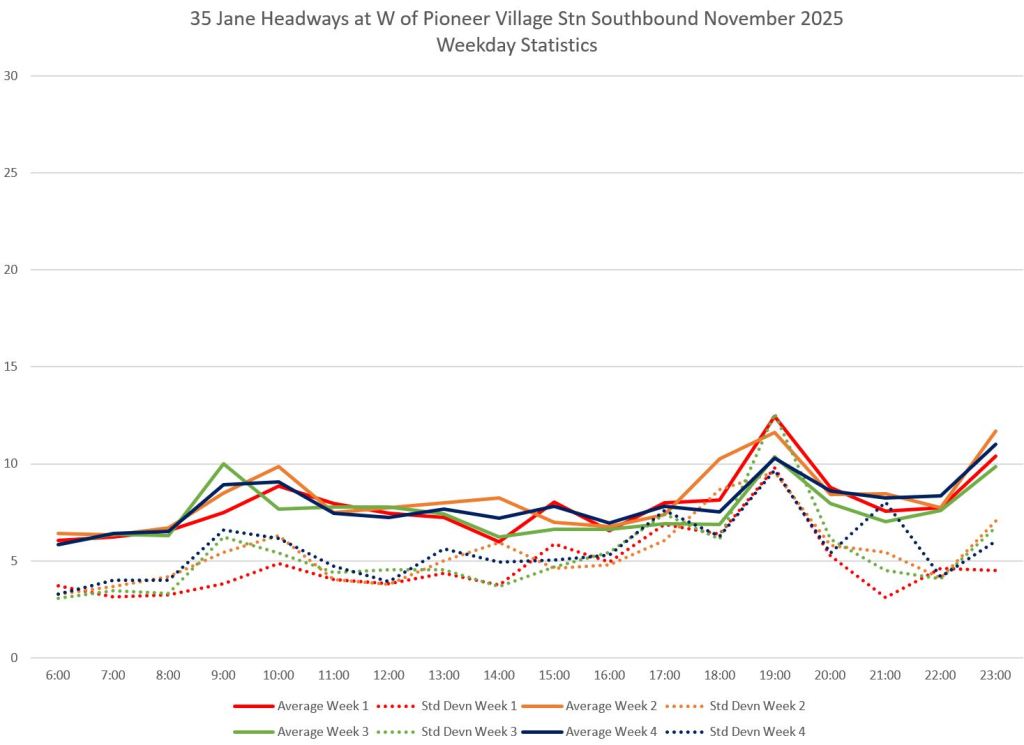
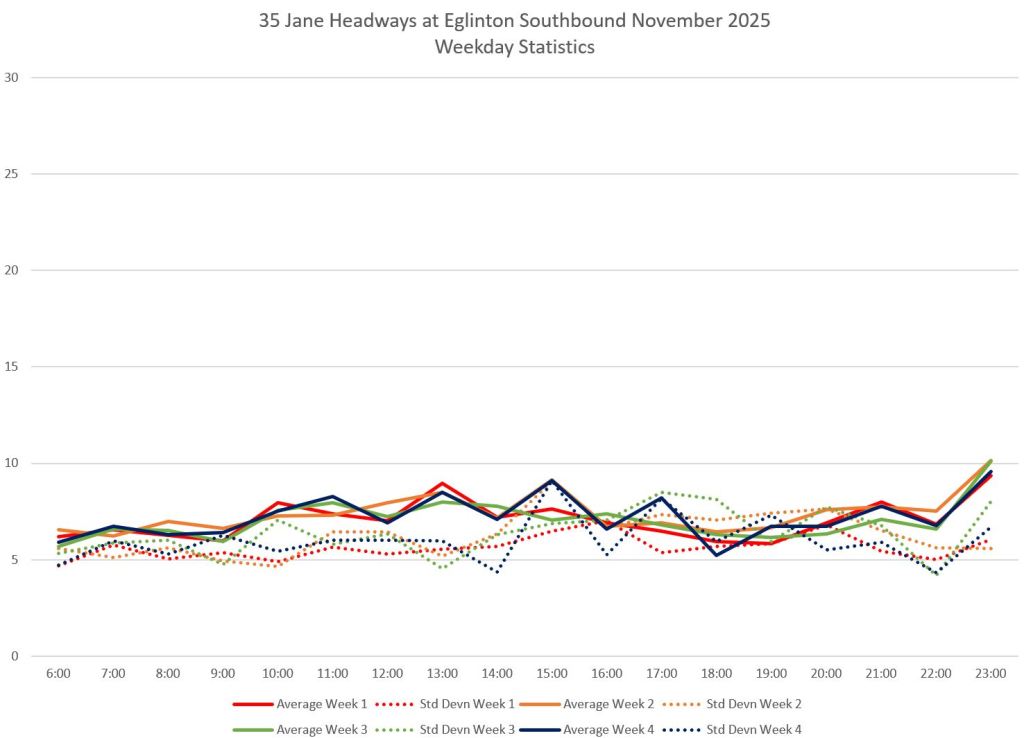
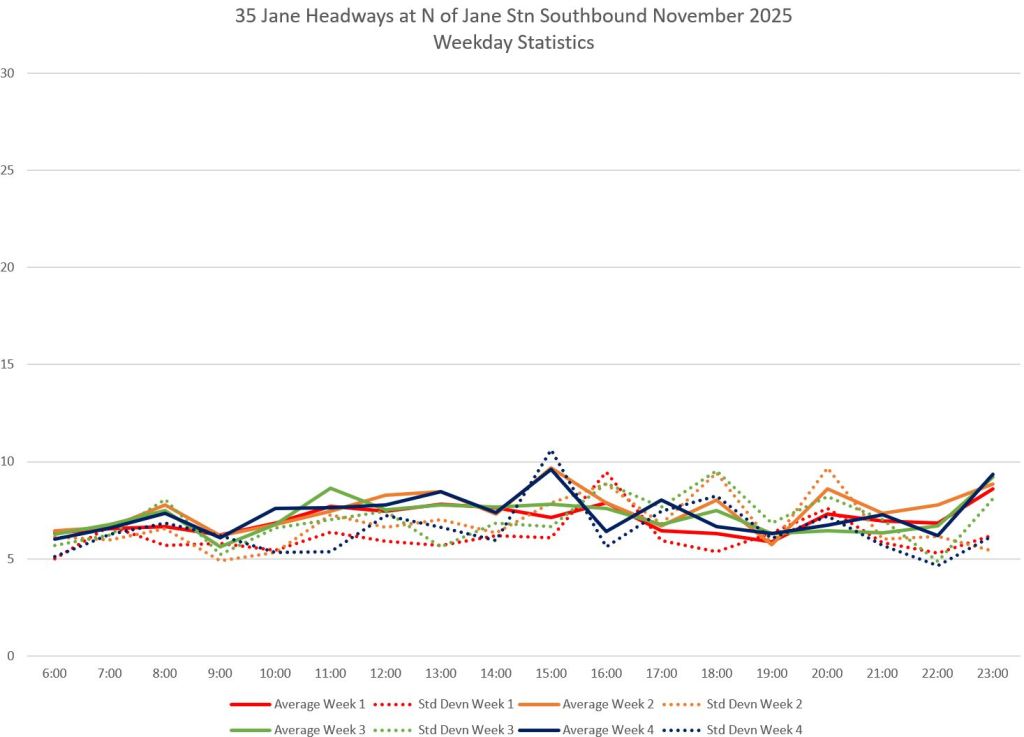
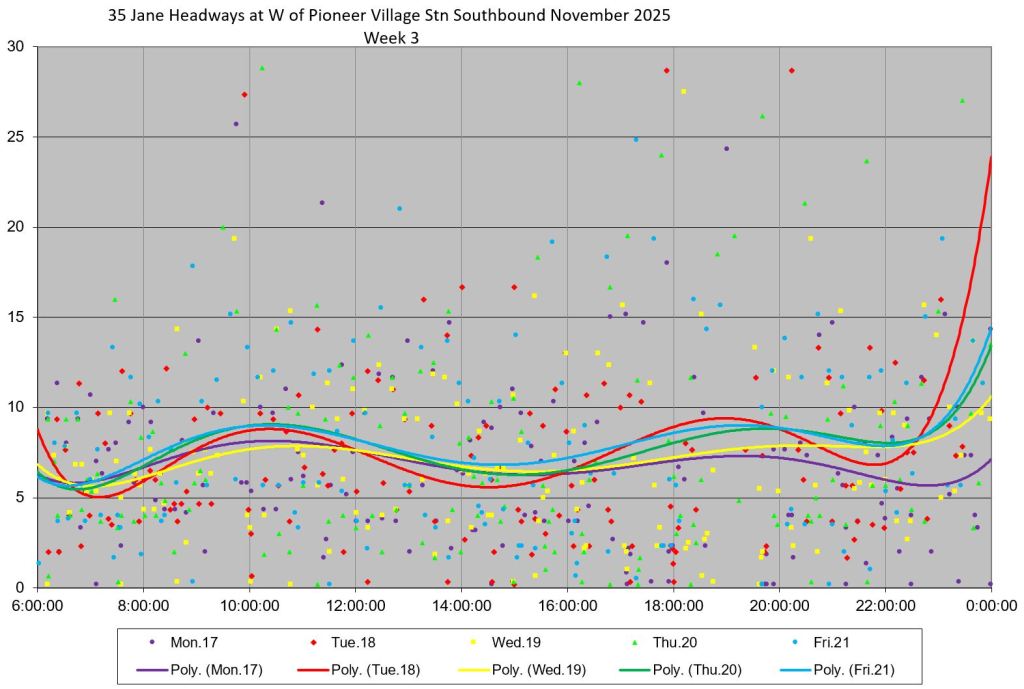
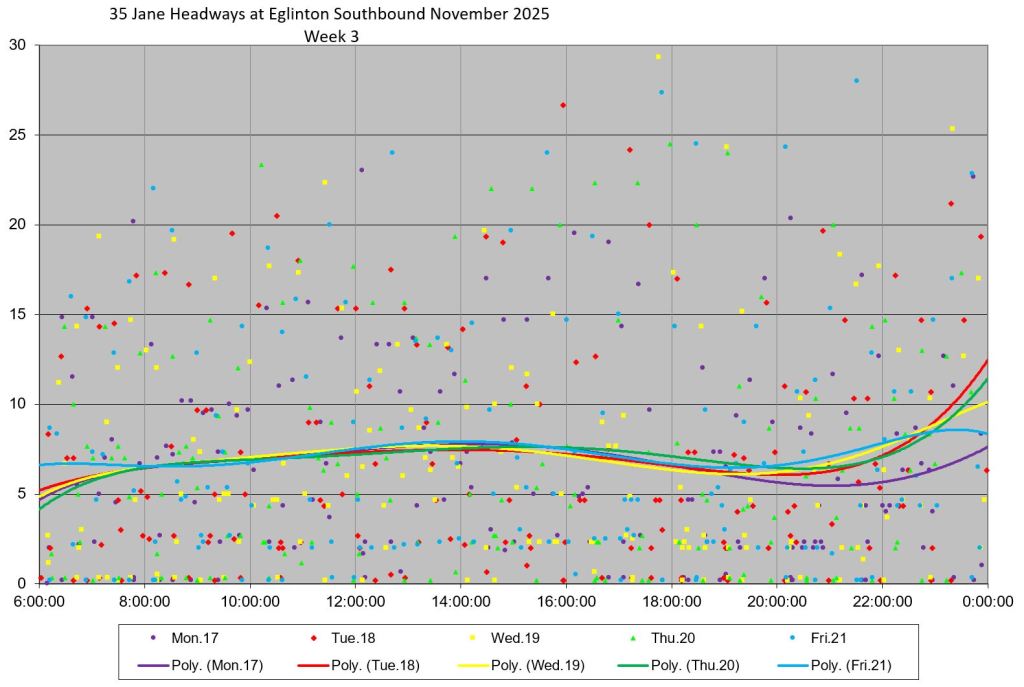
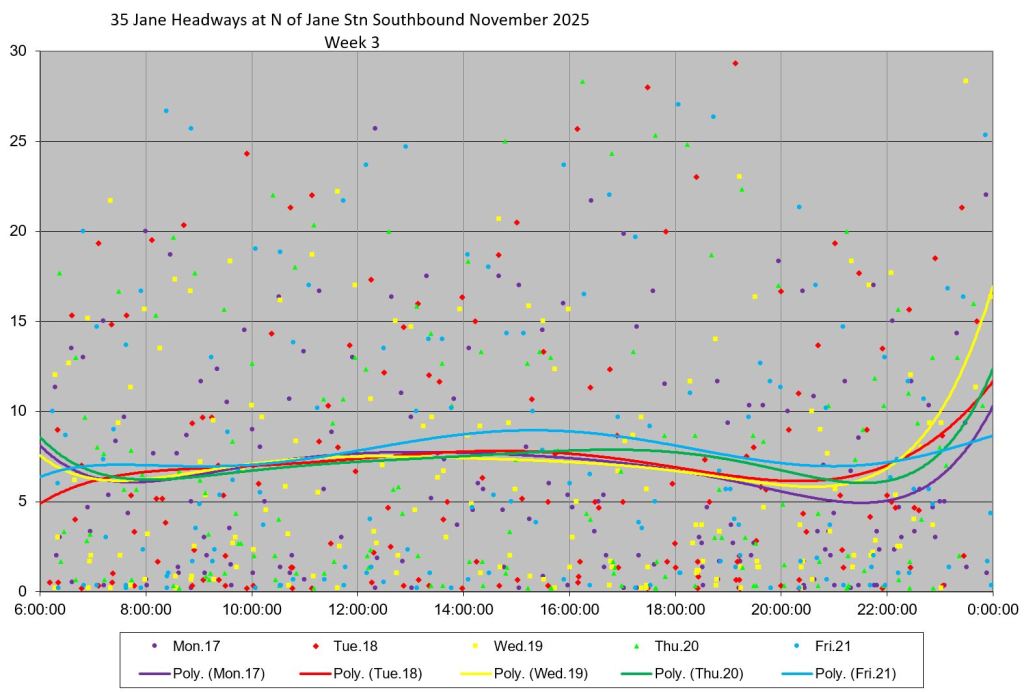
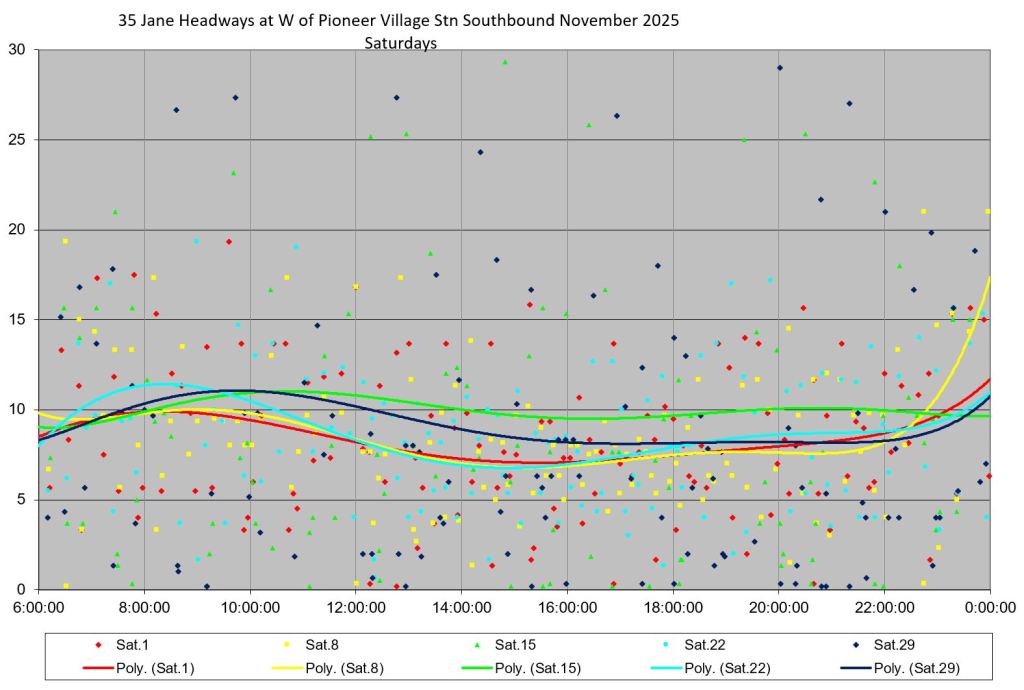
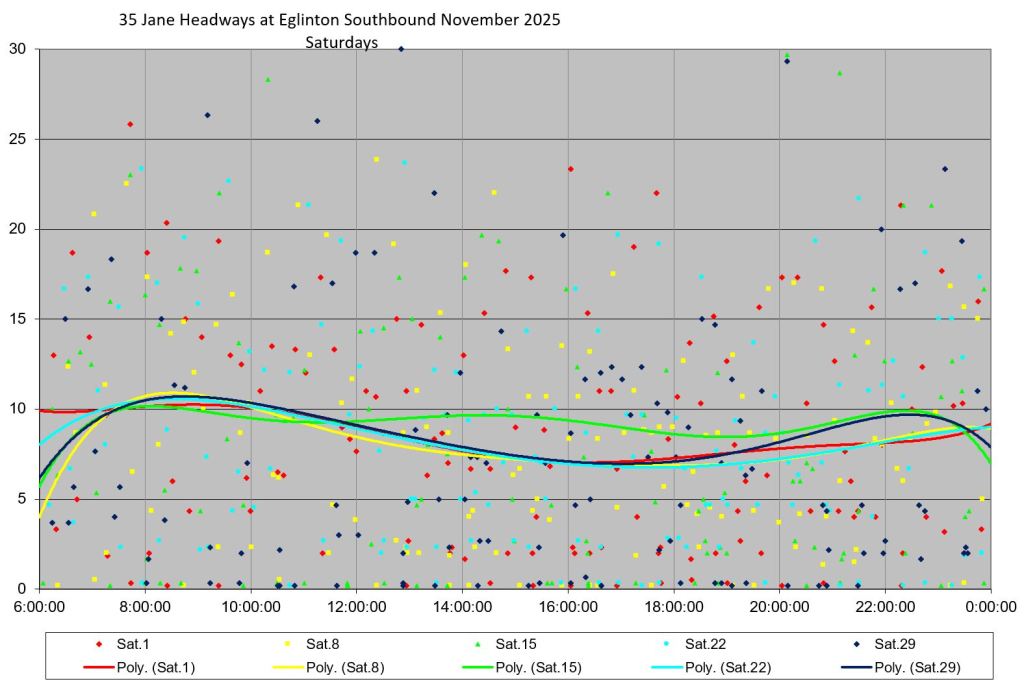
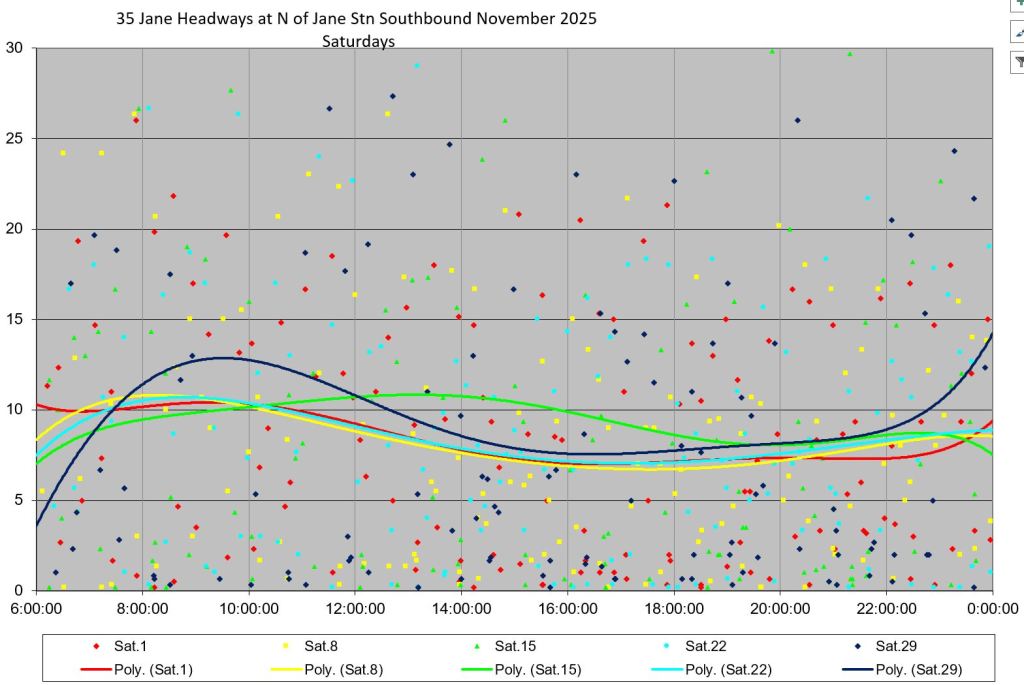
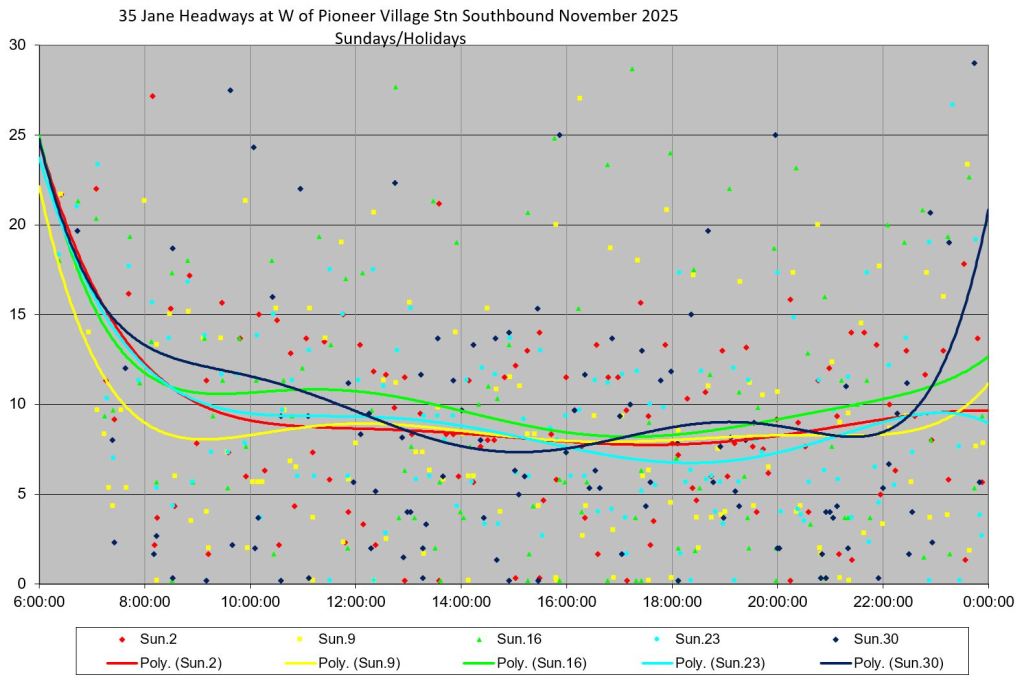
Service on 35 Jane in November 2025
For reference, the charts below show the headway behaviour on 35 Jane when it was still a single route in fall 2025.
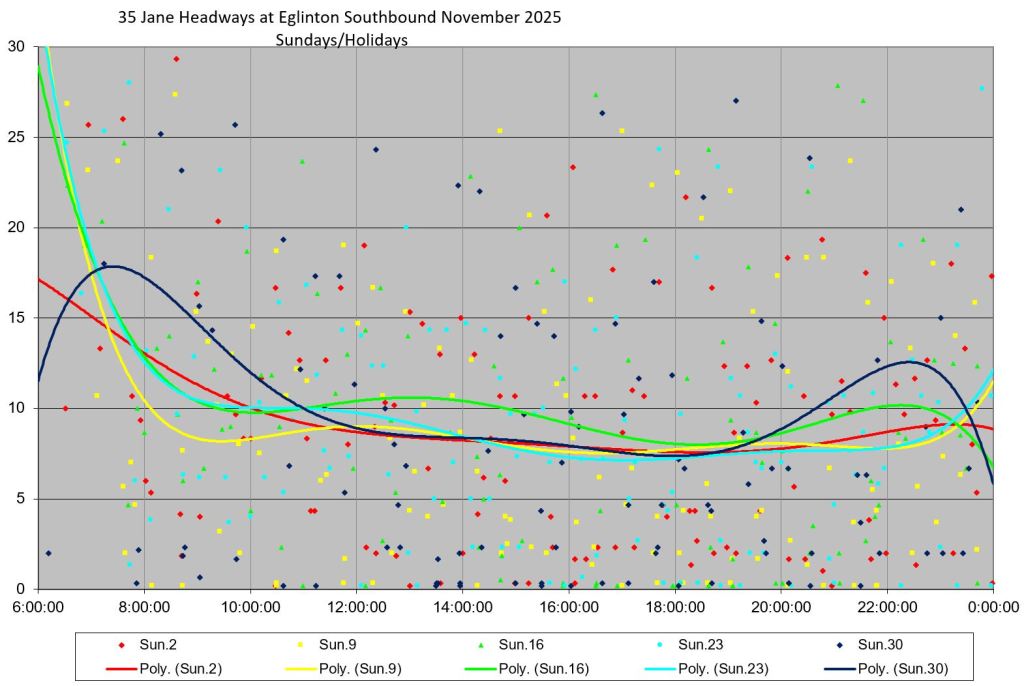
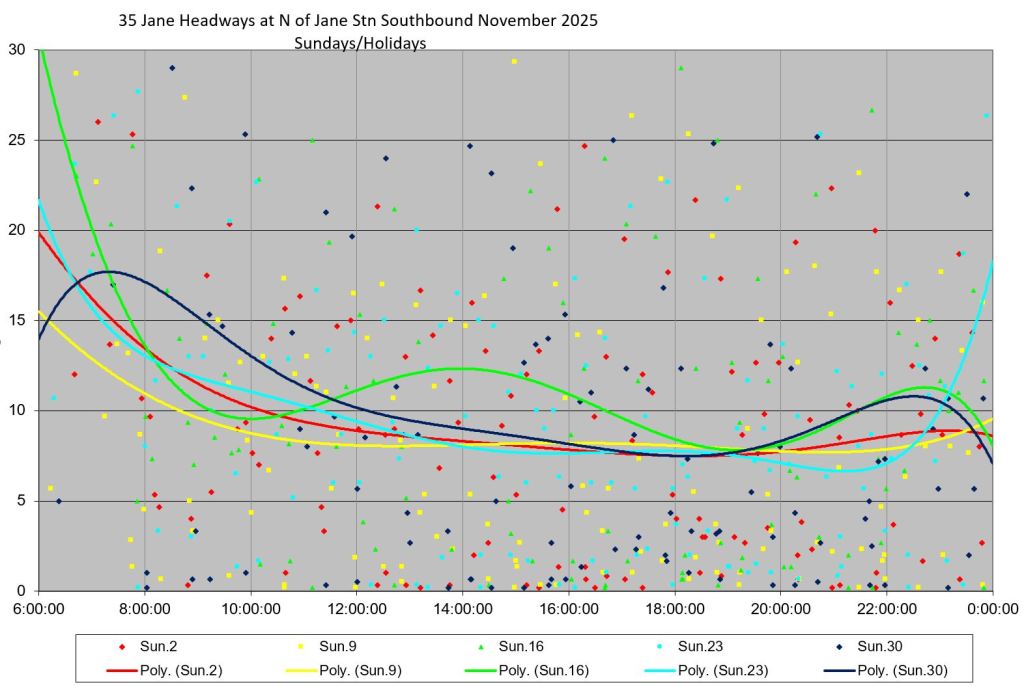
The charts in this section are organized reading across by location. The trip origins are on the left and the near-terminal locations on the right. Eglinton is used as a midpoint in the central column.
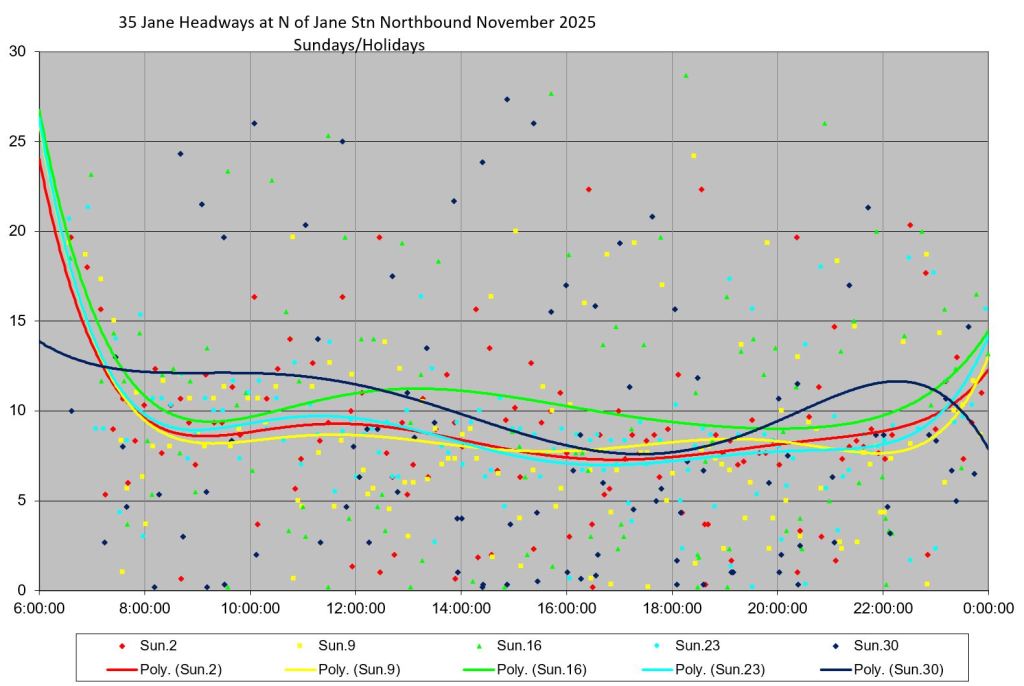
Headways Northbound
Service leaving Jane Station was badly bunched all day long with headways ranging up to 20 minutes and more. Weekend service was even worse with data points above 20 minutes throughout the day.
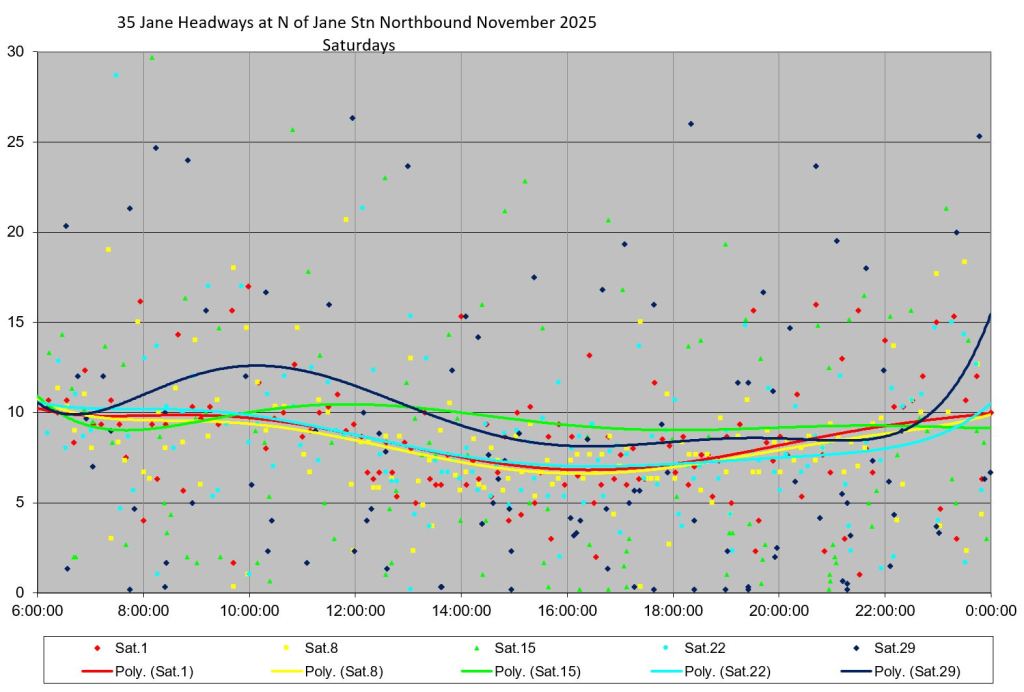
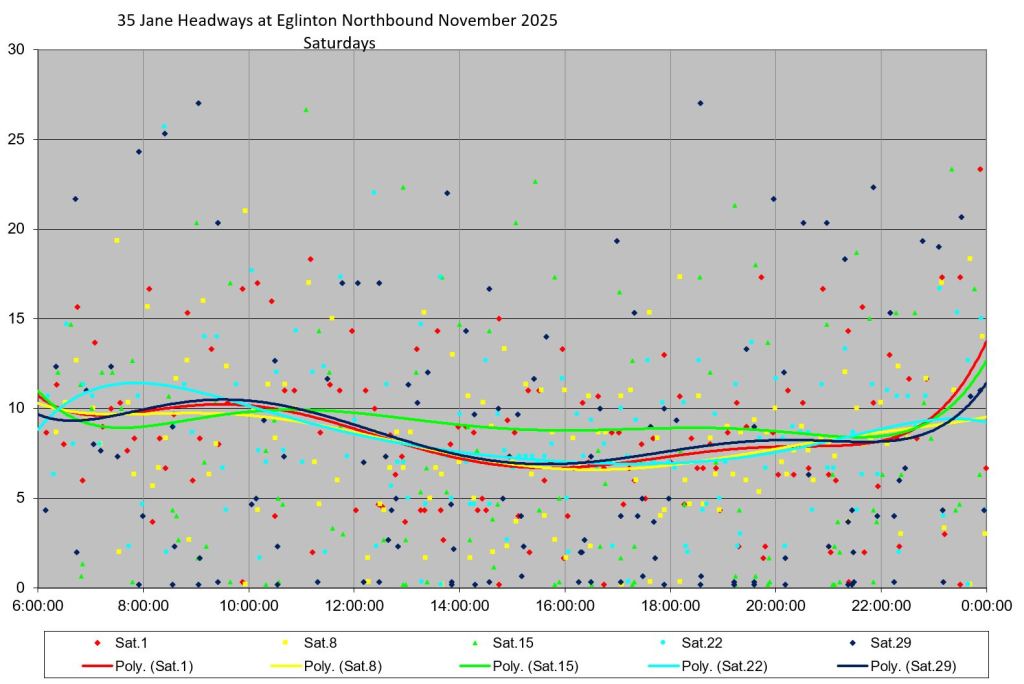
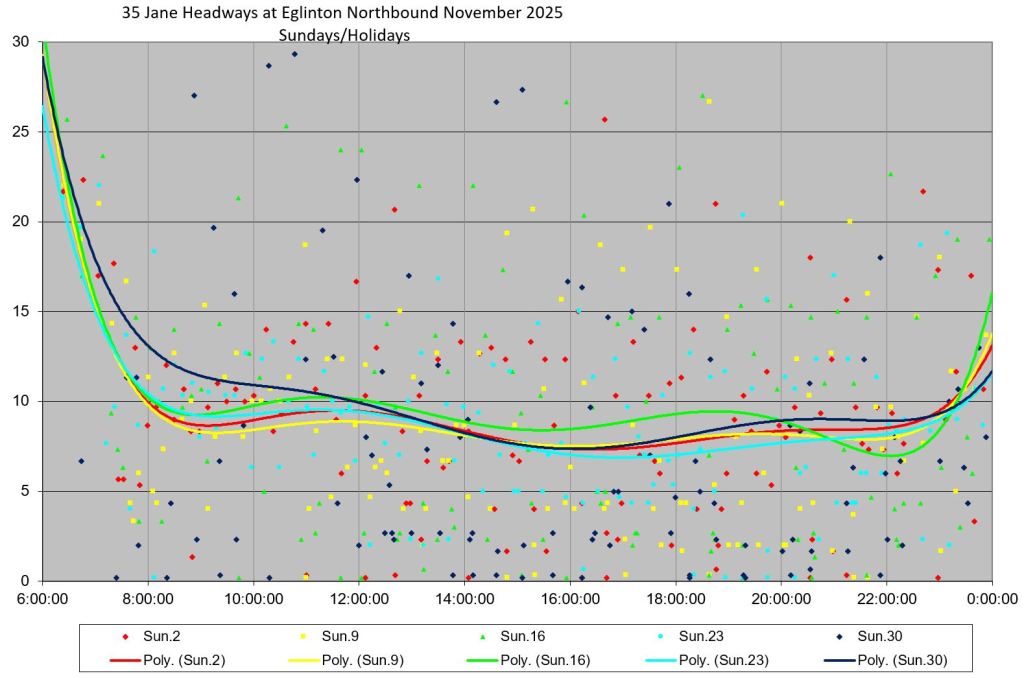
Headways Southbound
Southbound service from Pioneer Villege reflects the pattern sen northbound. Many trips run on very short headways (bunches) and many data points are at and above 15 minutes (gaps).

I have found that I would better off transferring between Jane 35 and Jane South 27 at the Eglinton Avenue West and Jane Street intersection. Staying on to make the transfer at Mount Dennis Station adds many minutes because of the distance and especially due to the Line 5 extension construction. Found that using the Eglinton Avenue West intersection to transfer between the 35/27 and Jane Express 935 might be better. Using my smartphone apps to see when the next bus will arrive is useful… sometimes.
LikeLike