This post continues from Part I, and is broken off from it simply in the interest of keeping each article a reasonable size. For introductory comments please see Part I.
Routes included here are:
65 Parliament 70 O’Connor 72 Pape 75 Sherbourne 83 Jones 87 Cosburn 88 South Leaside
91 Woodbine 92 Woodbine South 111 East Mall 112 West Mall 114 Queens Quay East 154 Curran Hall 168 Symington
Problems seen on many routes in Part I show up here as well including:
Less reliable service on evenings and weekends
Missed trips due to missing buses without an attempt to rebalance headways to eliminate wide gaps
Most readers are only interested in some of the routes here, and that is why I have only published a few charts per route with links to details in PDF sets. Only the truly keen (some might say obsessed) and, of course, those whose job it is to know these details will look at just about everything.
Apologies if I’ve missed your route. I plan to look at others once the Line 5 and 6 changes fully cut in to see how new service designs work.
To those who ask why I publish so many of these route analyses, the answer is, sadly, that it takes a lot of data to make the point that erratic service is not found on only a few routes, nor only on major city-spanning bus and streetcar routes. “Traffic congestion” is too simplistic an explanation too often raised by the TTC, and it simply does not apply in some times and locations where these routes have poor service. TTC has no metric to report on this problem, and therefore no tracking mechanism to flag issues or the result of corrective strategies, if any.
The City of Toronto has announced that work at King & Dufferin is finished and the intersection will reopen to traffic on Wednesday, October 29 after 7pm.
Regular service will be restored on 29/929/329 Dufferin, and the 503 Kingston Road bus will be extended west from Joe Shuster Way (east of Dufferin) to Roncesvalles at 5am on Thursday, October 30.
TTC will test the new track and overhead during the week of November 3 and will restore 504 King and 508 Lake Shore services from their current Shaw/Queen diversion when the intersection is cleared for streetcar operation.
Meanwhile, the TTC CEO’s Report notes that six minute or better service will come to 505 Dundas and 511 Bathurst from 7am-7pm 7 days/week starting November 16.
The 30-day Revenue Service Demonstration for the Finch West LRT is complete, and the TTC will take full operational control of the line no later than Monday, November 3, 2025 according to an announcement by the Ontario Ministry of Transportation. A date for revenue service will be decided by the TTC.
The next planned schedule changes for the TTC are on Sunday, November 17, and Sunday, December 22, 2025. Implementation of any changes for November 17 are already well underway internally, and it would be a stretch to see route 6 Finch enter revenue service that soon unless the TTC had already made provision for this. Service change details for November 17 are not yet public, but should start to emerge both from internal sources and from the posting of new online schedule data used by trip planning apps in early November.
The announcement notes that the Eglinton Crosstown line is currently going through its own demonstration period, but the status of that testing has likely been affected by a collision in the Mount Dennis yard as reported by the Toronto Star.
Also announced are:
November 16, 2025: Opening of Mount Dennis GO/UP Station as well as the passageway under Eglinton Avenue at Eglinton West station to reduce pedestrian crossings at the surface.
The Crosstown stations at Mount Dennis and Eglinton West will not open until revenue service begins on the line, and at that time Eglinton West will make the long-planned name change to “Cedarvale”.
The Ministry touts various changes made based on experience with the Crosstown project that were applied to the Finch project and others:
Using simpler, proven signal and power systems from other LRT projects to reduce design complexity and technical risk, making delivery, testing and commissioning smoother.
Working collaboratively with building partners to identify critical funding for testing and commissioning and ensuring claims and legal barriers do not impact this process.
Onboarding the maintenance provider earlier in the process to ensure the fleet and line are ready for service sooner.
It is not clear what “other LRT projects” might have more complex signal and power systems, but Eglinton is unique in the amount of underground running where trains will be under automatic operation. Problems with premature brake wear on the Flexity LRVs used on Eglinton were traced to incompatibility between the automatic train control system and the braking system on the cars causing them to brake too strongly. This has been corrected, but considering the years the line has been under construction and testing, it is amazing that this problem was only recently found and dealt with.
The points about working collaboratively with “partners” building the line and bringing a maintenance provider “onboard” earlier speak to basic flaws in project design and contract management. A passing reference to the Eglinton line “which began construction under the previous government in 2011” tries to fob off responsibility for issues with Metrolinx that the Ford government had years to correct.
This article will be updated as more information becomes available.
The TTC has an open RFP on the Bonfire site for a Triennial Contract for design services for its streetcar overhead contact system. Much of this document is boilerplate legalese, but the scope of work shows that the TTC plans to address key issues with systems related to streetcar overhead. Five specific tasks are listed in the RFP and more might be added over the term of the contract.
Overhead/Traction Power Supply Study
This involves a review of the existing system that supplies power to streetcars and the demands placed on it as vehicles move through the network. There is no mention of modelling the effect of increasing service, but this should obviously be part of the study to determine where constraints might exist to service growth. (The recent suspension of streetcar service on Bathurst during the busy CNE period thanks to a power supply failure is an obvious incentive for this work.)
Overhead Design for Interections
This task would review existing intersections with a view to improvements where appropriate.
Overhead Design for New and Existing Lines
The title is self-explanatory but it begs the question of why a new design is needed for the existing system, much of which has been rebuilt once for dual-mode trolley pole and pantograph operation, and again for a pantograph-only configuration. The latter work is still in progress, and is responsible for some of the extended bus-streetcar substitutions in recent years. Also notable is the absence of any reference to eBus charging infrastructure.
Streetcar Track Switch
Although track switches are not part of the power supply to streetcars, historically they were controlled through hardware mounted on the overhead wires. The current system uses antennae in the pavement and on streetcars, and responsibility for the system rests with the Streetcar Overhead section.
Streetcar Signal System Alterations
The definition of this task is unclear in that there are almost no signals anywhere on the streetcar system. Moreover, there is no reference to the interface between streetcar operations and traffic signals.
In this article I will address only the last two items as they are both related to issues of streetcar operating speeds, a topic raised in a recent UITP review of the streetcar system. (See The UITP Peer Review: What is the TTC Trying to Hide?) Details from this review might become public at the November TTC Board meeting.
Many of the service analyses on this site concern larger, major routes like the streetcar lines and bus routes crossing substantial distances in the suburbs. The picture of service quality is not a pretty one. Starting with this article, I will review service on several of the shorter routes, many with infrequent service, to see how the TTC fares. Short routes get frequent stops at terminals where headways can be reset, but irregular service can mean long waits for riders.
Many of these routes show very irregular service and one cannot help asking how this affects ridership. The TTC talks about improving service on major routes with interventions such as reserved lanes, but seems incapable of managing headways on relatively minor routes. There is a parallel here with declining maintenance quality where issues with the “little things that don’t matter” start to bleed into the major services and the system drives away as many riders as new services might attract.
Common problems seen on most of the routes reviewed here are:
Headways do not generally stay within a narrow band, but can be badly scattered especially for evening and weekend service.
In spite of this scatter, it is quite possible that the routes meet the TTC’s service standards which merge performance over an entire day, and provide a wide margin for data points outside of the target range (40%).
Review of the detailed tracking data (not included here in the interest of space) shows that some of the widest gaps occur because of missing buses. There is a metric in the service standards for missed trips with a goal to “minimize” them, albeit with no target. Trips can be missed because no operator or vehicle is available, or because of a short turn before a bus reaches the terminal, or because of such extreme lateness that it might as well not have operated. This statistic has never been reported in the monthly service quality metrics.
Bus bunching occurs even on routes with scheduled headways of 20-30 minutes, and this can persist for multiple trips showing little effort to space out service. Where the quality metric is “on time performance”, spacing service to compensate for bunched or missing vehicles can actually work against a “good” score even though what riders see would be more reliable.
31 Greenwood 49 Bloor West 50 Burnhamthorpe 62 Mortimer 64 Main 65 Parliament
An additional 13 routes will be included in Part II of this series.
65 Parliament 70 O’Connor 72 Pape 75 Sherbourne 83 Jones 88 South Leaside
91 Woodbine 92 Woodbine South 111 East Mall 112 West Mall 114 Queens Quay East 154 Curran Hall 168 Symington
After the “more” break, data for one route, 8 Broadview, are shown in detail as an introduction. Further routes are shown only in summary, but with links to PDFs containing all of the charts for readers interested in them.
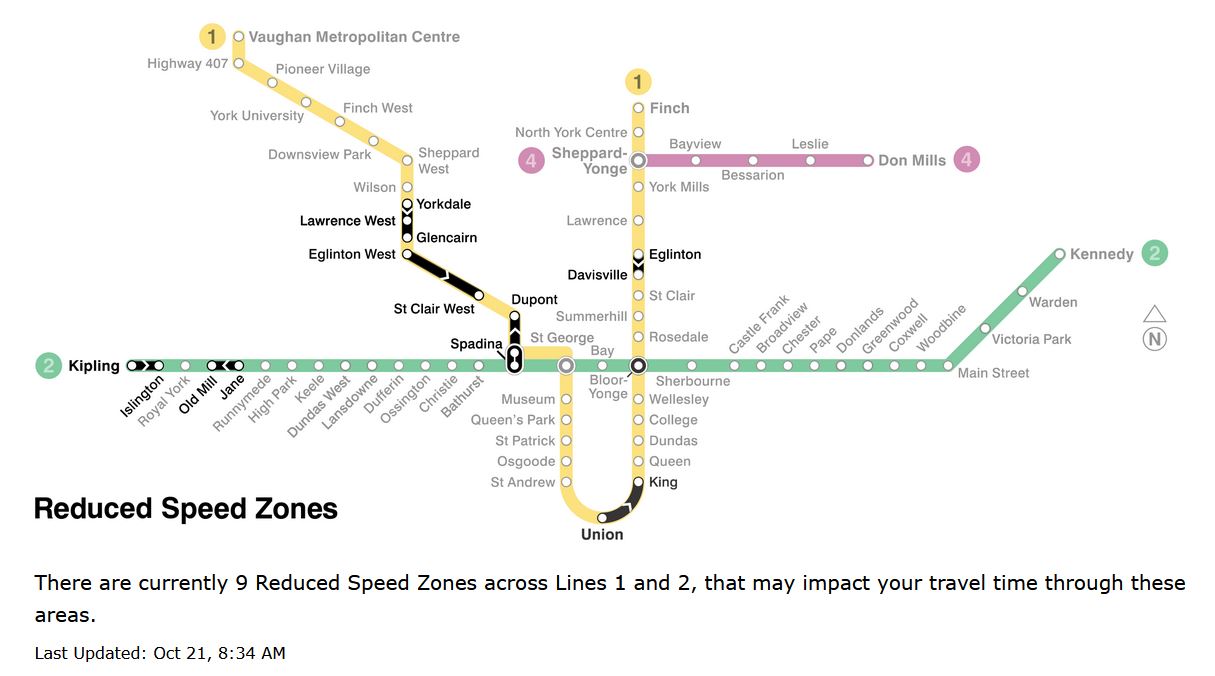
Updated October 21 at 4:20pm: The TTC posted an updated map and table of RSZs dated today. Information on the map and tables now match. There are only 9 active slow zones with target removal dates through to late November. The October 21 versions have been added to the end of this article.
Updated October 17 at 11:00pm: The TTC posted an updated map and table of Reduced Speed Zones dated October 17, but the info on the map is still out of sync with the info in the table of slow zones. The revised version is at the end of the article.
In previous articles, I have reported on the number, location and longevity of reduced speed zones on the subway. See:
A recent problem with the TTC website page where these are reported is that information is inconsistent between the map showing problem areas and the tables explaining each problem and its expected resolution.
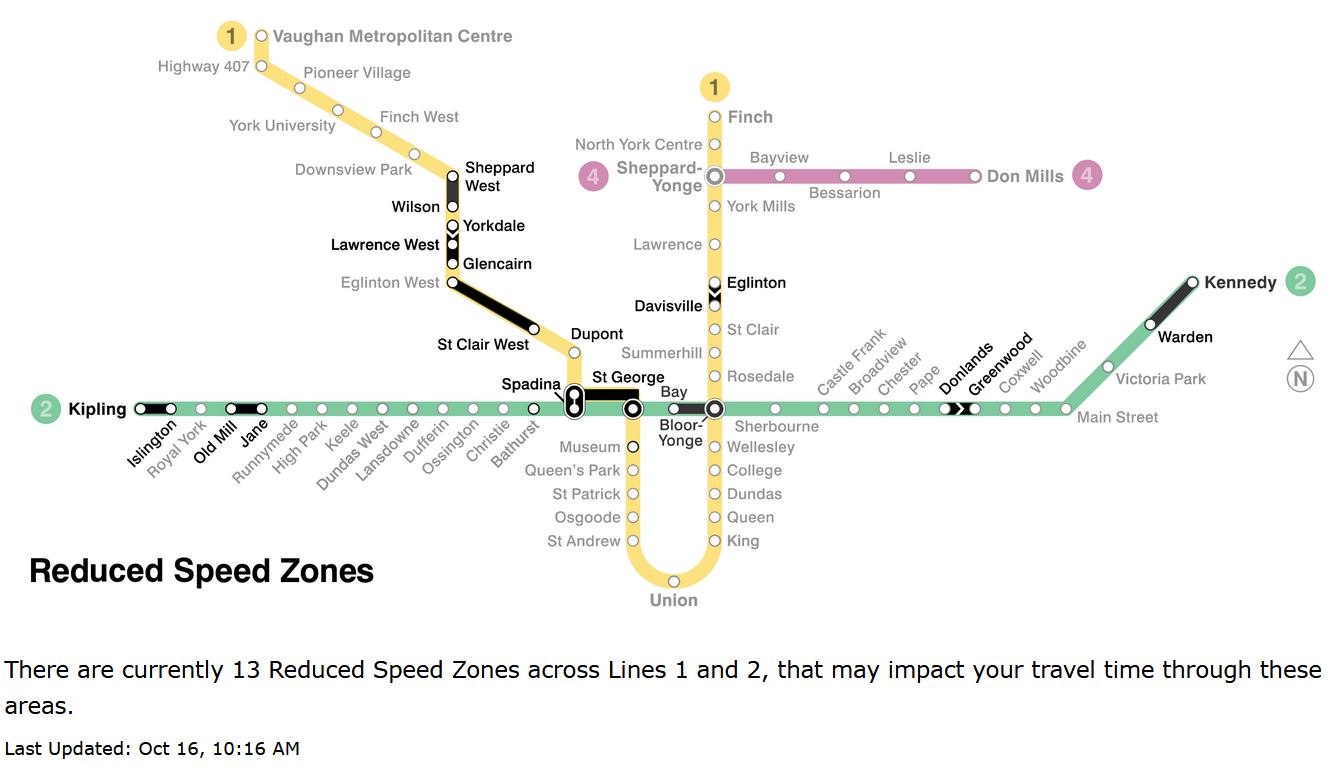
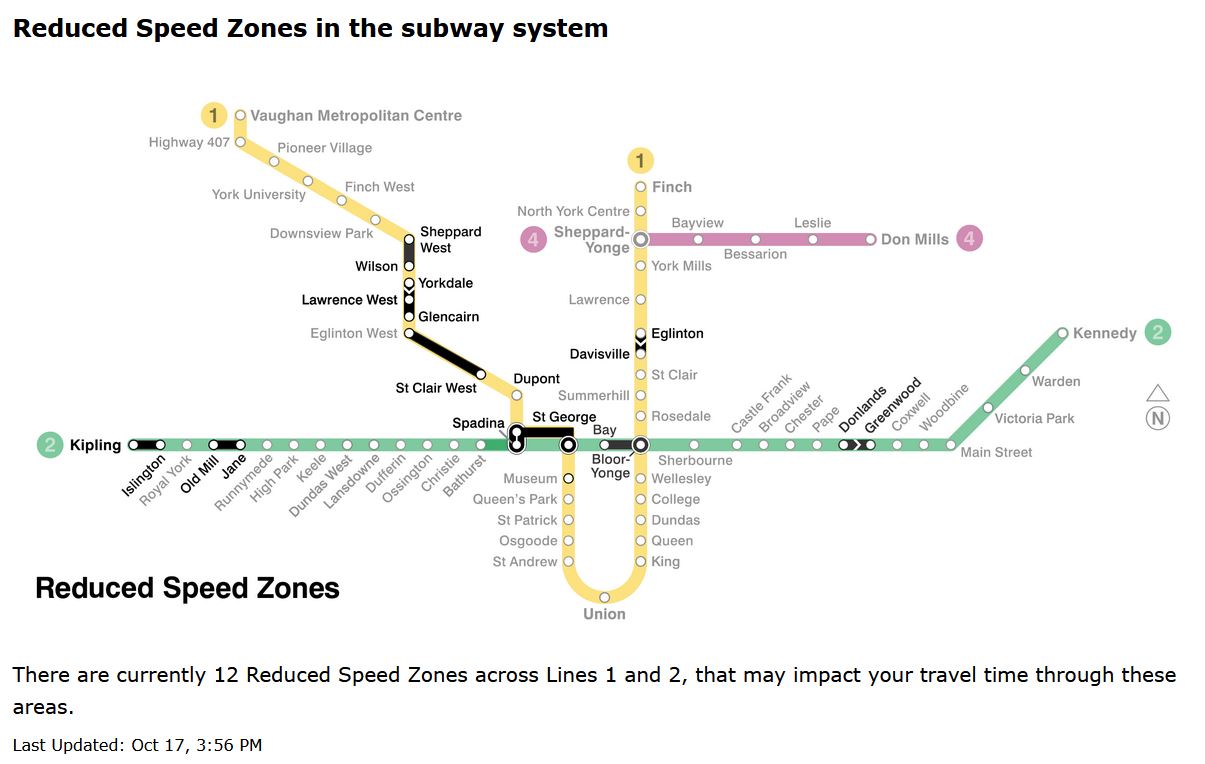
Here is the current version of the RSZ map dated October 16 at 10:16am.
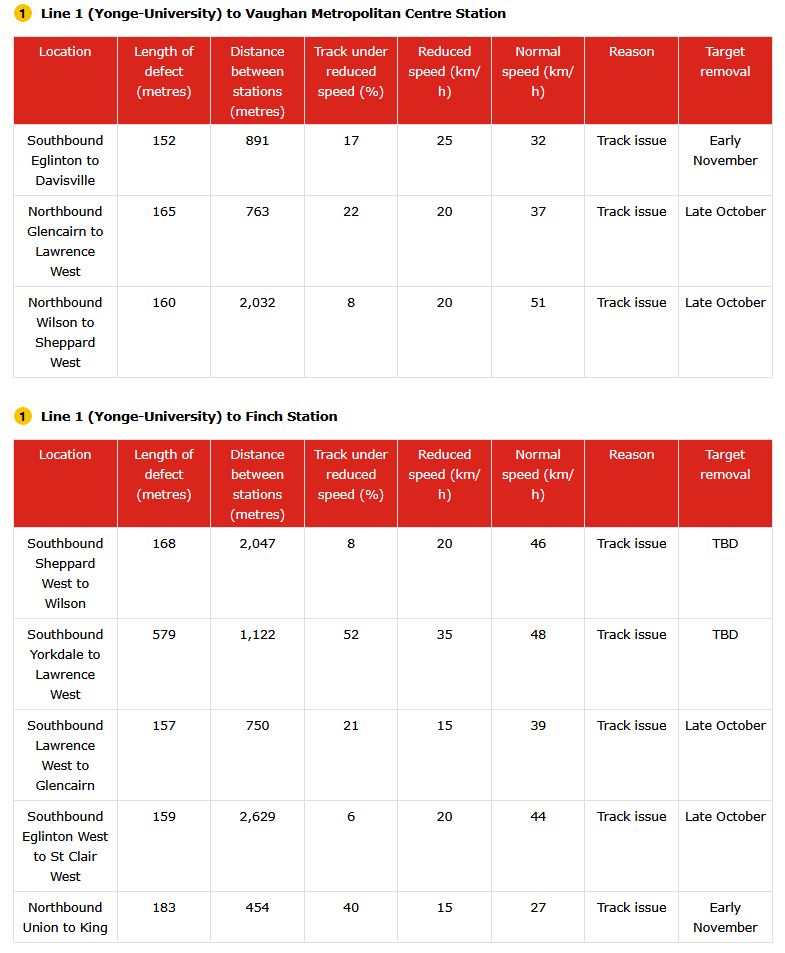
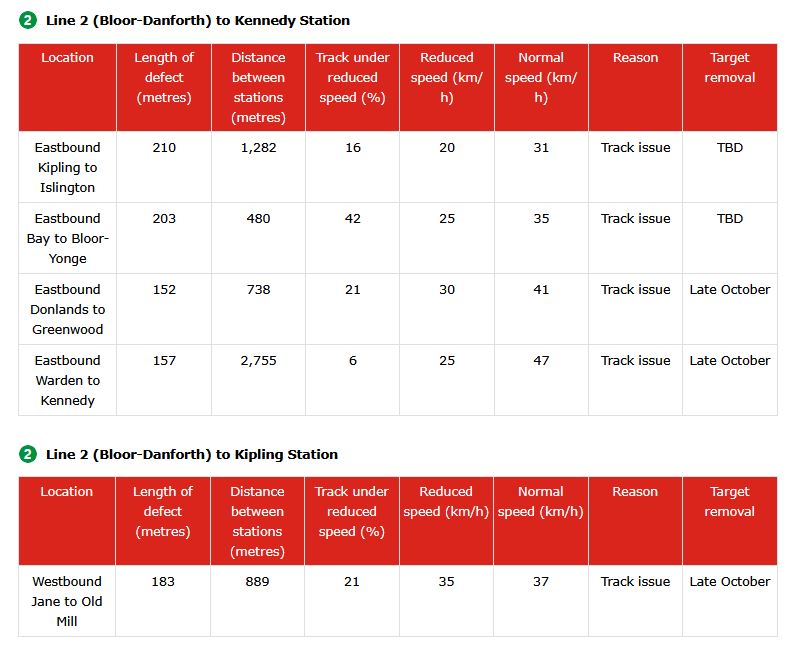
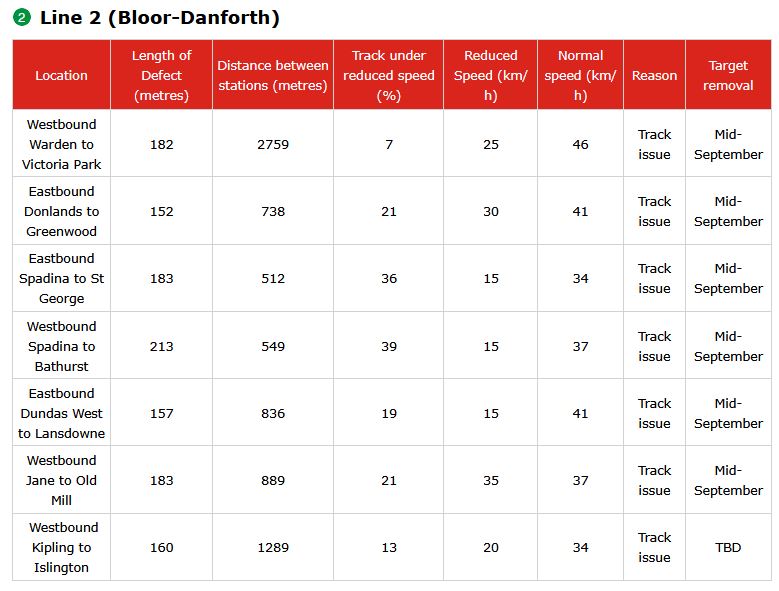
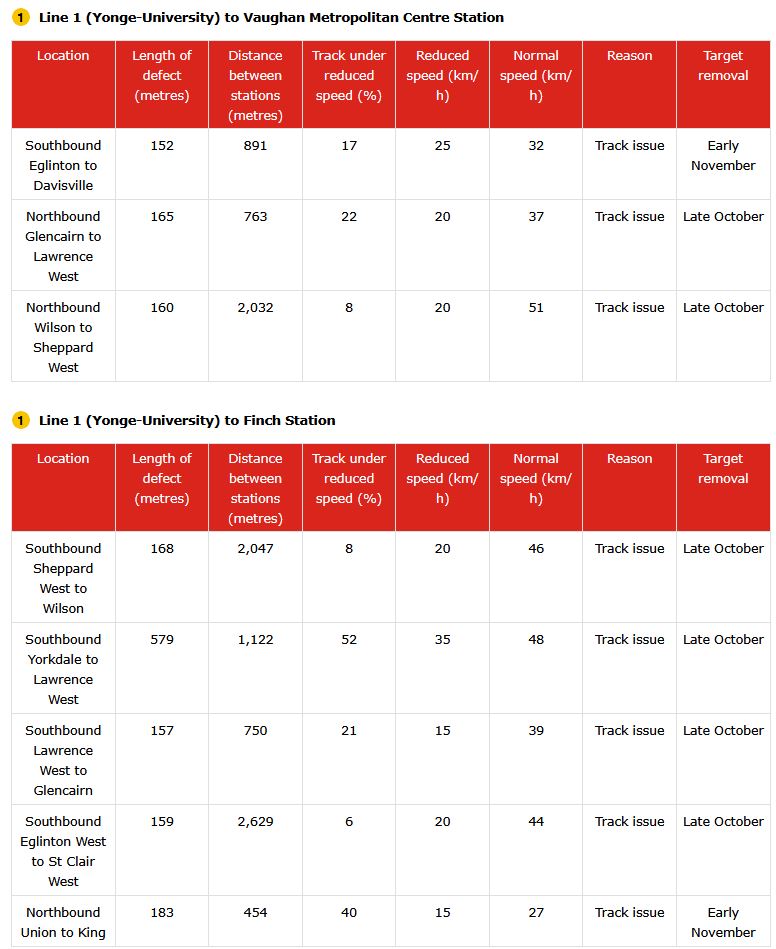
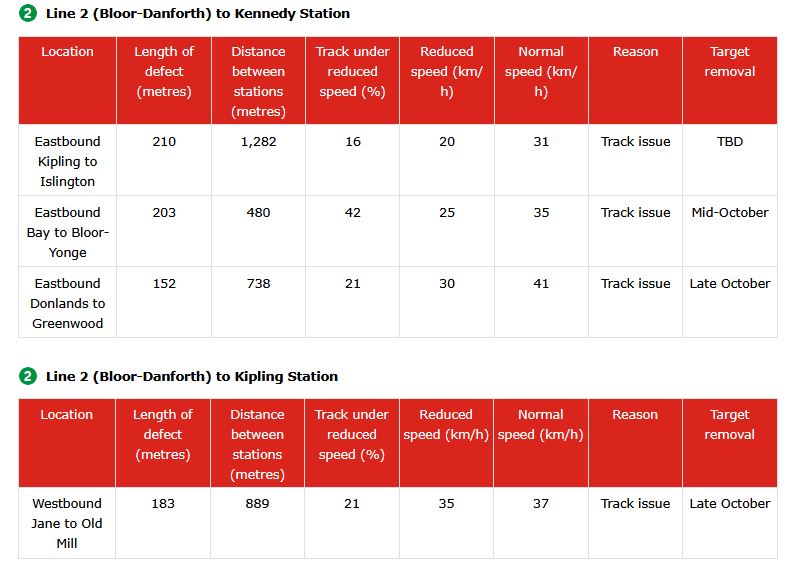
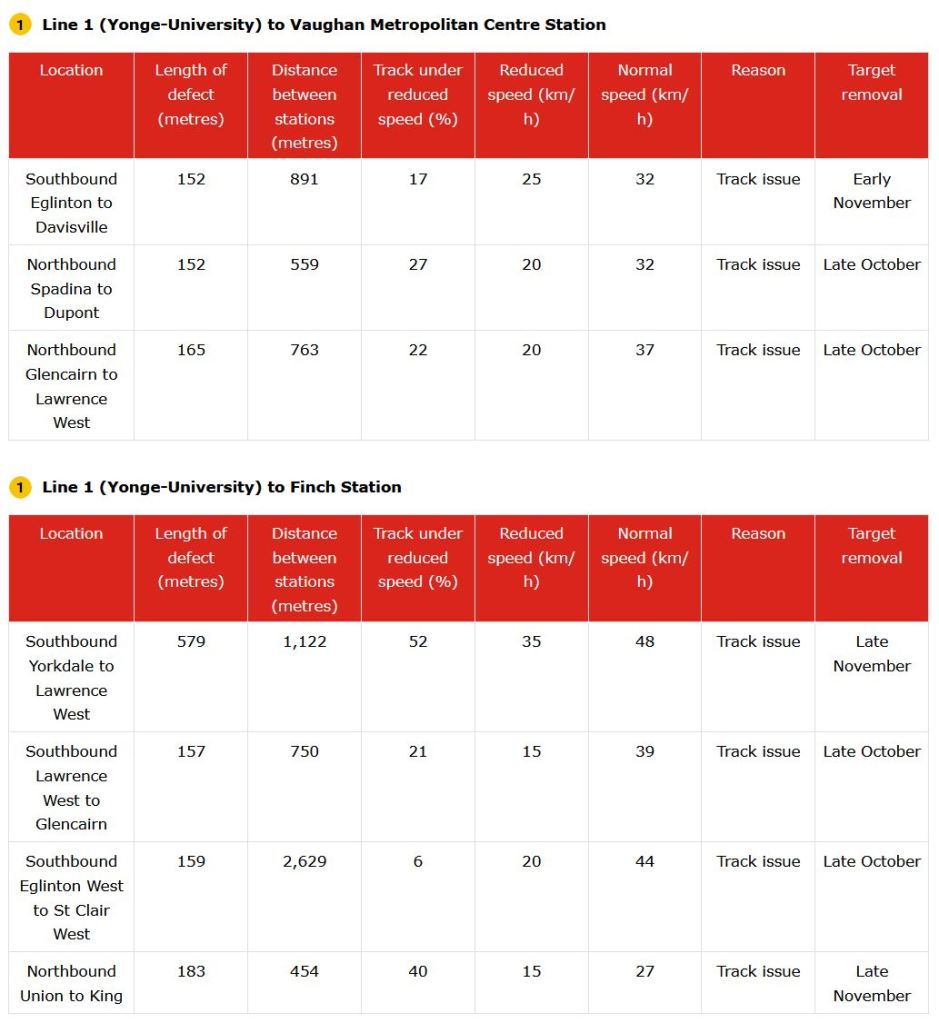
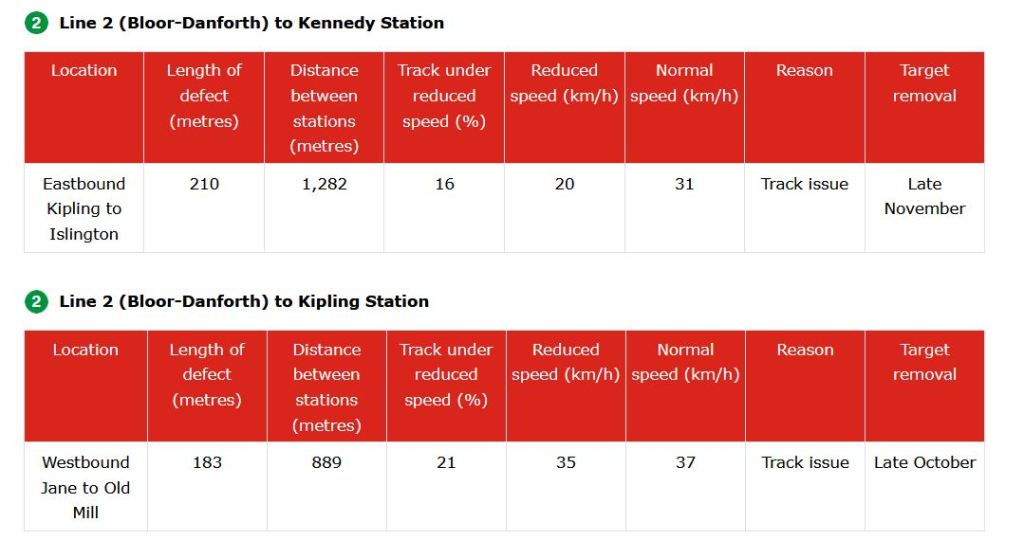
Here is the text describing these zones:
There are several inconsistencies between the current map and tables.
The statement that there are 13 zones appears to be based on the count of table entries. Note that for a “bothways” restriction, they count as two. Listing only a single direction in the table undercounts the number of locations. In this case the count, based on the same premise, should be 18 not 13.
In past versions each direction has counted independently, and in some cases more than one location was flagged in a track section (marked “X2” below).
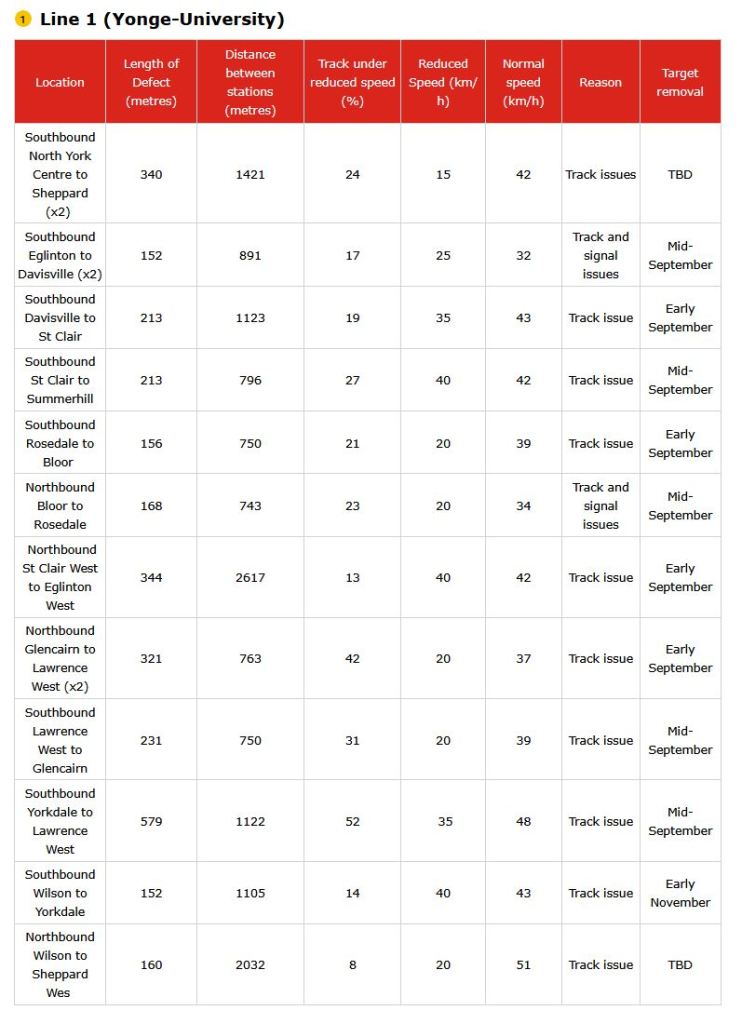
There is a further problem if we compare the claimed completion dates with information shown on September 5.
There are definitely more entries in September than in mid-October, and so the TTC has been working away at these issues. However, the projected dates have drifted in many cases.
Location
On Map
In Table
Target as of Sept 6
Target as of Oct 16
Yonge SB Eglinton to Davisville
Yes
Yes
Mid Sept
Early Nov
Yonge NB Union to King
No
Yes
Early Nov
University BW St. George to Spadina
Yes
No
Spadina BW St. Clair West to Eglinton West
Yes
SB Only
Early Sept (NB)
Late Oct
Spadina BW Glencairn to Lawrence West
Yes
Yes
September
Late Oct
Spadina SB Yorkdale to Lawrence West
Yes
Yes
Mid Sept
TBD
Spadina BW Sheppard West to Wilson
Yes
Yes
TBD
TBD
Bloor Kipling to Islington BW
Yes
EB Only
TBD (WB)
TBD
Bloor Old Mill to Jane BW
Yes
WB Only
Mid Sept (WB)
Late Oct
Bloor Bay to Yonge BW
Yes
EB Only
TBD
Danforth Donlands to Greenwood EB
Yes
Yes
Mid Sept
Late Oct
Danforth Warden to Kennedy BW
Yes
EB Only
Late Oct
The TTC needs to adopt a consistent way of reporting reduced speed zones, counting how many are active and projecting credible target dates for remediation. As thing now stand, the information in the maps and text differs, and the count of RSZs appears to be lower than what is actually in effect. In turn, this allows management to “hit” a lower target by under-reporting problems, and this is precisely the sort of behaviour that has bedevilled the TTC’s performance metrics for years.
Updated October 17 at 11:00pm: Here are the October 17 versions of the RSZ map and tables. The TTC still appears to be incapable of posting consistent data. On the bright side, some of the zones that had “TBD” target dates on October 16 now have October or November dates.
Updated October 21, 2025
Here are the current versions of the map and tables with the information now back in sync.
Major Update October 10 at 12:50pm: Additional information on bus bay assignments at various stations, on street stop arrangements pending Line 5 opening, and service changes not mentioned in earlier versions of this post. Also added are various tables and charts of fleet allocations and other information.
Updated October 10 at 11:30pm: The spreadsheet showing detailed before and after service designs for affected routes is now available.
The service changes planned for October 12 include four major groups:
First stage of route reorganization for Line 5 Crosstown opening.
Construction begins on Queen Street between Broadview and the Don River.
Construction begins on College Street at McCaul.
Construction ends in November at King & Dufferin.
History of This Article
As I publish this on Thursday, October 9 at 10:45am, the TTC has still not issued its usual detailed memo of pending service changes although the information has been floating around for weeks in various sources.
On October 9, there was a press release accompanying Mayor Chow’s media appearances, but this release only gives a hint of what is happening beyond the headline announcement of improved Line 2 subway service. That release includes a link to a page with more details, although regular TTC site readers would never find it.
Updated 5 pm October 9: A separate press release has been issued with the details of changes omitted from the first one. There are now separate pages for each modified route linked from a common page regarding the Line 5 changes.Maps showing the revised routes have been added to the end of this article.
There is an “Updates” page, separate from the regular “Service Changes” page, which can be accessed through the “Riding the TTC” page assuming you know it exists. It includes a link to the service changes, but there is no link from the TTC home page to this information. The Service Changes page gives details, but only for a handful of routes. Automatic links from route schedule pages are generated only for Service Changes items, and so the information on the Updates page is not linked for riders looking at route schedules.
Updated 10:50am October 9: The TTC Home Page now includes a link to the Updates post.
Updated 9:30am October 10: There are now route-level pages detailing the changes on the “Service Changes” page
Updated October 10: The detailed memo of service changes was issued mid morning today.
The TTC recently trumpeted its proposed Wayfinding Strategy which includes a strong digital component given the many riders who access information through online channels. Their own website badly needs overhaul, but even in its current state, information is not published in a consistent location.
The article following the break is a compendium of information from various sources.
The TTC Board met on October 6, 2025. Many items on the agenda were confidential in whole or in part, and the meeting immediately recessed into private session. Four hours later, the public session resumed.
Extended private sessions have been a “feature” of recent Board meetings, and this is a major inconvenience for people who have taken the trouble to travel to City Hall for deputations, or remained available online. In years long past, the Board scheduled an in camera session before the public session so that, usually, the public part started on time. They should reconsider this practice, or at a minimum advertise a long, planned private session in the agenda so that public attendees can plan accordingly.
Items of interested included:
The CEO’s monthly report including an updated format for bus fleet and route performance metrics
The Peer Review of asset management by the International Association of Public Transport (UITP)
The 512 St. Clair car received improved service in September 2025, and this article updates the charts with headway stats to September 30 showing the combined effect of more service and route management.
Weekday service over the 2024-25 period has had three main levels: bus operation during a long-running construction project in 2024, followed by streetcar service with headways improving only in the last month.
Effective
AM Peak
Midday
PM Peak
Early Eve
Late Eve
5-Sep-23 (Bus)
3′
5′
3’30”
6′
10′
24-June-24 (*)
8′
8′
8′
8′
10′
2-Sept-25
6′
6′
6′
8′
10′
(*) For a period in Oct-Nov 2024, the route was split with streetcars operating from Gunn’s Loop (Keele) to Bathurst Station, and buses from Oakwood Loop to St. Clair Station. This was not shown in the published service summary, but does show up in the observed data for the portion of the route operated with buses.
Generally speaking, the range of headways at various points on St. Clair did drop in September 2025, although the effect is more pronounced early in the month than later. Whether this indicates a trend away from tighter headway management as the month wore on will not be clear until more data have accumulated.
During the period of bus operation, the median headway (50th percentile) did not move around much, but this is not the case with the streetcar periods. A reason for this is that with wider scheduled headways, it is more likely that within one hour the scheduled number of vehicles will be higher or lower by a more substantial amount than with the more frequent bus service. Conversely, with the shorter scheduled bus headways, it is much more likely that vehicles will run in pairs because it is much easier to catch up to the bus only a few minutes in front.
A long-standing problem on streetcar routes with larger and larger vehicles (PCC/CLRV, ALRV, Flexity) is that scheduled headways to provide comparable capacity widen, but the laissez-faire attitude to line management results in much worse swings in vehicle spacing. This is compounded by Service Standards that accept a wider range of headways for less frequent service. The issue of meaningful Standards is to be reviewed in coming months by the TTC, and this is an area where Standards should not be compromised just to preserve “good” performance stats for management.
As shown in many analyses published here, there is a general problem with headways becoming more erratic as vehicles move along the route. St. Clair is entirely on its own right-of-way, except for a short stretch at the western end. It also has a mid-point opportunity for headway regulation at St. Clair West Station. Data for departures from that point suggest that little or no headway management occurs there.
TTC Service Standards for terminal departures specify a range of 1 minute early to 5 minutes late, although recently the service metrics were change to eliminate early departures. In any event, a 5 minute window for being “on time” combined with a 6 minute scheduled service means that service can be badly bunched and still “on time” for reporting purposes.
Along the route, the Standards prescribe headway variations of ±50% so that for a 6 minute headway, an actual range of 3-to-9 minutes is permitted. For an 8 minute headway, the permitted range is 4-to-12 minutes. To compound credibility problems, this only has to be achieved on 60% of trips. [See TTC Service Standards at pp 15-16.]
Needless to say, when the TTC says that service meets their standards, the quality can vary quite widely from what riders might expect as “reliable” operation.
Following the “more” break, the first section looks at the evolution of headways along the route west from Yonge and east from Keele during various periods over the day. AM Peak values tend to be slightly more reliable, but even they worsen the further from the terminal one goes.
The second section presents the detailed headway data from September 2025 to show the actual scatter of headway values by day and week, and including weekend data.
There is some indication that the TTC has attempted better headway management on 512 St. Clair, but the results are uneven and there are clear signs of locations and time periods where service is not regulated at all. In turn, this shows what “normal” operations are like without active dispatching and spacing of cars along the route.