The Scarborough RT Derailment Technical Reports

Back in September 2023, TTC management presented an overview of the investigation into the July 24, 2023 accident that marked the end of the SRT’s life. See also my article Line 3 SRT Replacement Service and Derailment Investigation.

At the time, detailed reports from the technical investigation were supposed to appear in “a few weeks”, but there has not been any public presentation of this material to the TTC Board.

To my surprise while hunting down reports about the Scarborough RT busway, I found the derailment investigation reports well hidden on the TTC’s site. To see them, you have to:

  • Go to the Projects and Plans page which is accessed through a footer menu on every TTC page. Yes, right down at the bottom.
  • Scroll down to The Future of of TTC’s Line 3 Scarborough (SRT).
  • Click on View Details.
  • Scroll down within that page to News Releases, Reports & Community Updates
  • Open that section and scroll down to November 16, 2023 (there is also one report listed under December 11, 2023)

Here you will find links to the following reports (which I provide here to save you the bother of chasing through the path above). The dates of the reports are shown together with those for earlier drafts in the change logs, where present.
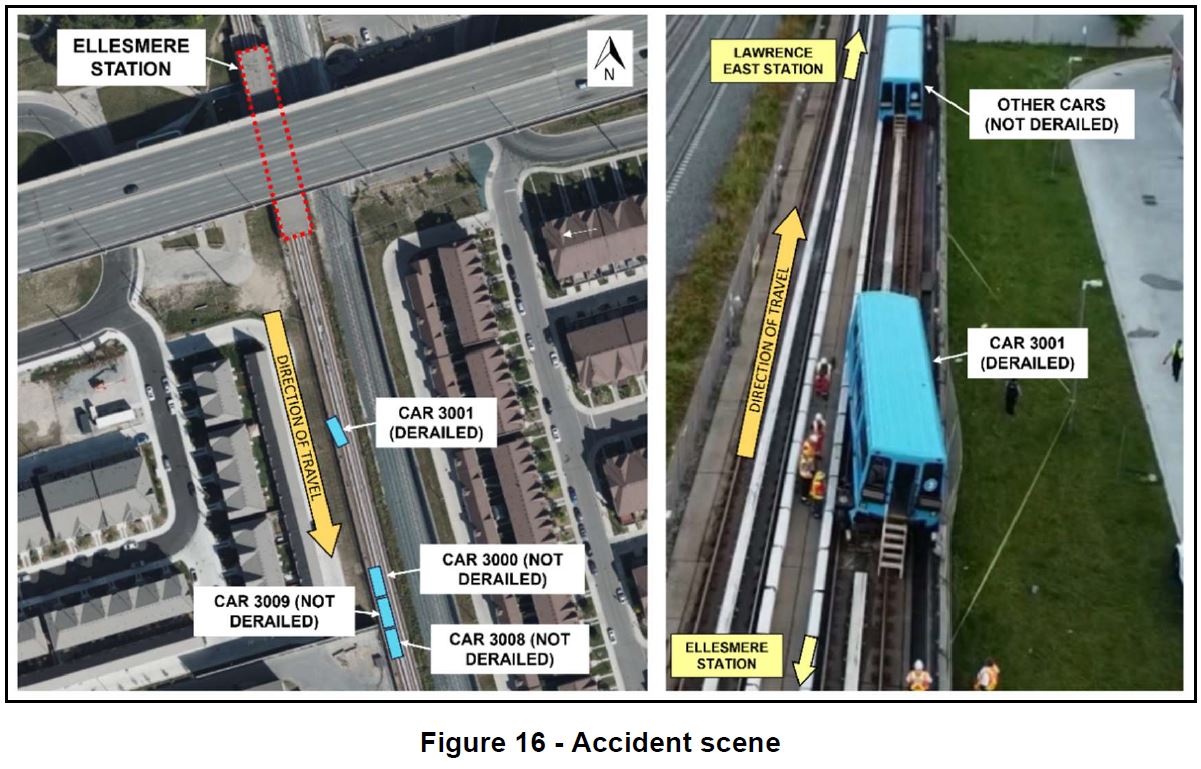
There is a lot of reading here, but the reports are more thorough and informative than the brief TTC overview since the accident. An important distinction the reports reveal is the degree to which identified issues were not at the single derailment site, but common to other parts of the line and to TTC maintenance practices.

Various reviews concluded that the problem lay with the reaction rail mounts and the ability of segments of this rail to move due to forces from the linear induction motors (LIM) on the SRT trains. Several factors contributed to this including:

  • The inherent tight clearances of the LIM design,
  • variations and errors in the selection and installation of reaction rail supports and rail components,
  • an inspection scheme that underrated the severity of problems and the necessity for prompt repairs,
  • the difficulty of inspecting reaction rail mounting hardware, and
  • the need for training of inspection and maintenance staff so that they understand the behaviour of track systems and the failure modes that they must prevent.

Of particular concern is that a reaction rail defect was reported two weeks before the accident at the derailment site, but it was assigned a low priority in the maintenance hierarchy likely because the severity of the problem was not understood.

There are lessons here for maintenance practices in general and I cannot help thinking that the recent detailed review of subway track geometry, resulting slow orders and repairs is partly in response to the problems discovered on the SRT.

I know that readers will not have time to plough through the full reports, but they contain details beyond what I have included here for those who are interested. This article is a summary of the main points together with an introduction to the SRT propulsion technology to put the other material into context.

Source: Hatch LTK Report
Continue reading

Eighteen

January 31, 2006 saw the first post on this blog, a compendium of film festival reviews I wrote going back to the dark ages of 1986 on another platform, the long-departed “Artworks” BBS. Many readers will recall text-based systems and the whine of 2400-baud dial-up modems connecting us to the outside world.

Among other films in that 1986 batch were Spike Lee’s She’s Gotta Have It, Itami’s Tampopo which brought new meaning to the term “spaghetti western”, and David Lynch’s Blue Velvet. (Try to imagine seeing that film for the first time when nobody in the audience knew what to expect.) There was also a little film called Malcolm about a reclusive lad who had an inordinate fascination with Melbourne’s trams.

I stopped doing reviews years ago because major political events kept getting in the way, and more recently I prefer to see films on a more leisurely basis without the lineups. Toronto’s cultural scene has been through many ups and downs over the years, but the reps survive somehow, and even the gorilla on King Street, TIFF, hopes to weather the combined effects of the pandemic, film industry strikes, and the fall in tourism. There’s enough to keep me out and about (now that we can be out and about again) on many evenings and quite a few matinees.

The second post went up on Groundhog Day 2006, A Bold Initiative for Don Valley Transport with a plan for Swan Boats, the product of much 2am hilarity with a dear friend. Newcomers to the scene ask about my Twitter/X handle. If only they knew. Fantasy transit maps have nothing on our imagination!

At the risk of really dating myself, 2023 was the 60th anniversary of my first non-trivial computer programming. It was on an LGP-30 that was on loan to the Toronto Board of Education for enrichment classes. My program was a random sentence generator that would spit out grammatically correct, albeit totally nonsense text. This was not on a par with teaching HAL to sing, but it gave me a healthy suspicion of the claims for AI when that field started years later.

2023 brought departures of friends and transit colleagues, not uncommon for someone of my generation, and they are much missed. But there is much new blood with a strong interest in making a better city. A particular strength is that transit activism is now city-wide and cannot be dismissed as the preserve of downtowners and railfans.

Continue reading

Will There Ever Be A Scarborough RT Busway?

At its meeting of January of January 25, 2024, the TTC Board received an update on the status of a busway in the former SRT corridor.

The news was not good. For various reasons, the opening date for this facility has slipped to 2Q2027. This is quite a change from the original plan for construction through 2024 and 2025 with a year-end opening, roughly 18 months sooner than the updated projection. Here was the plan back in April 2022 when the project was approved by the Board. At the time, the assumed shutdown date for the SRT was mid-November 2023.

TTC Project Chart for Line 3 Bus Replacement Construction, April 2022

The Board’s discussion was unusually heated, and much criticism fell on TTC Management for an unplanned delay required to conduct a Transit Project Assessment (aka TPAP) even though the corridor is not changing use. The problem lies with planned acquisition of new lands to provide station and corridor access, and they are subject to a review including for cultural/archeological purposes. (Detailed station plans appear later in this article.)

Construction will also require a barrier between the busway and the adjacent GO line because Metrolinx wants to protect from buses accidentally coming onto their corridor. This adds cost, but should not substantially affect the construction schedule.

Total cost is now forecast at $67.9 million, up $12.2 million from the earlier estimate of $55.7 million which is part of the TTC’s 2024 Capital Budget. Of this, $4.3 million is due to the Metrolinx barrier, and $4 million goes for a grab-bag of items that appear to have been omitted in the original estimate. This increase is compounded by other cost lines which are calculated as a percentage of the base.

A far more important source of delay was the foot dragging by Council and the former Mayor about funding the design work which should have been finished by now, but sits at the 60% stage. Essentially Council sat on its hands crying out for Provincial money as part of the subway extension project, and the busway just sat waiting for aid that never arrived from Queen’s Park.

There has certainly been no sense of urgency to get design finished and construction underway as quickly as possible.

The delay, cost increase and a sense that travel time savings might be less than expected have combined to raise the question “why do it at all”. This can be a self-fulfilling prophecy if those responsible for the project, including the politicians, really did not have their hearts in the idea. There is no quicker way to sandbag a project than to deny critical funding, watch the price rise and the due date vanish into the misty future.

While awaiting a formal funding approval, the TTC will redirect $15.2 million from other capital projects to pay for enabling works and property acquisition. This can proceed in parallel with the remaining detailed design and TPAP.

Continue reading

Analysis of 903 STC Express: September-December 2023

This article is an update to my review of the 903 Express bus that replaced the Scarborough RT. The previous article here: Analysis of 903 STC Express: September-November 2023.

Additions in this round:

  • Data for December 2023
  • Performance of the 903 service to Centennial College east of STC (Scarborough Town Centre)
  • Travel times between STC and Ellesmere & Midland
  • A review of terminal layover times at Kennedy Station
  • The screenlines for arrivals and departures at Kennedy Station have been moved from Eglinton at Midland and at Kennedy to points on Eglinton just east and west of the loop entrances. This ensures that any delays at the intersections are counted in travel time, not in terminal time. The change has been applied retroactively to charts for September through November.

Correction: References to a 934 Progress Express should have been to route 913. This has been corrected. Thanks to a reader for pointing out this gaffe.

Continue reading

Travel Times on RapidTO Corridors – December 2023 Update – Part I

This article updates tracking charts of travel times on three proposed RapidTO bus corridors with data to the end of 2023. The routes covered are:

  • 29/929 Dufferin from King to Wilson
  • 35/935 Jane from Eglinton to Pioneer Village Station
  • 39/939 Finch East from Victoria Park to McCowan
  • 54 Lawrence East from Victoria Park to PortUnion

I will turn to other RapidTO corridors including the existing Eglinton-Kingston red lanes in Part II of this series.

Without going into a lot of interpretive detail, the purpose of these charts is:

  • To show the travel times under “best case” conditions of low road traffic in Spring 2020 (the covid pandemic onset), and the changes since that time.
  • To show the variation in travel times day-by-day and at varying times of the day.

If RapidTO can flatten out variations in travel times and get the typical time to a consistently lower level, bus service should not only be faster but more reliable. That was the goal on King Street which, for a time, achieved it’s purpose of improving transit.

The focus of too much transit politics is on saving time getting from point “A” to “B” and not enough on ensuring that this time is consistent from day-to-day, hour-to-hour. This includes both on-vehicle travel time and reliability of the interval between buses, a frequent topic on this site.

Toronto’s Executive Committee will consider a report RapidTO: Surface Transit Network Plan at its meeting on January 30, 2024. I will report on the full document after their discussion and additional information, if any, from the meeting.

Continue reading

How Slow Is My Streetcar: Part I

At its November 2023 meeting, Council passed a motion proposed by Councillor Chris Moise whose ward covers the east side of downtown, and who also sits on the TTC Board:

1. City Council direct the General Manager, Transportation Services, in consultation with the Toronto Transit Commission, the Toronto Police Service, and the City Solicitor to review and report back to the Executive Committee in the second quarter of 2024, including:
a. an update on streetcar performance over the last five years;
b. suggested improvements to the public realm along King Street until the permanent capital project can be delivered; and
c. the feasibility of implementing automated traffic enforcement on the King Street Transit Priority Corridor, including details on what legislative amendments would be required to provincial legislation including, but not limited to, the Ontario Highway Traffic Act.

This article addresses point “a” with a review of streetcar lines over the past five years. It is important to go back to 2019 before the pandemic fundamentally shifted traffic and transit patterns downtown as a point of reference.

From time to time, there are calls to expand a “King Street” redesign to other parts of the network, but there are two “cart before the horse” issues to address first:

  • Figure out how to make King Street operate as it was intended and return at least to its pre-pandemic behaviour, if not better, as a model.
  • Understand how other streets operate including where and when problems for transit performance exist.

An update on transit priority will come to Council in February 2024, although this will look more widely at the city, not just downtown. In previous articles I have reviewed the growing problem of transit travel times as traffic builds on the proposed RapidTO corridors, some of which exceeded pre-pandemic levels some time ago. In future articles I will refresh these analyses with data through to the end of 2023.

An important distinction between most RapidTO bus corridors and the downtown streetcar system is the design of suburban vs downtown streets. In the suburbs, the streets are mostly wide, have relatively few points of access (e.g. driveways) or pedestrian oriented uses (e.g. shops), and travel distances tend to be longer. In the core, streets are narrow, mostly four lanes with no possibility of widening, access points are more frequent, there is a strong pedestrian orientation, and trips tend to be short. Even if buses were running, express operations would be almost impossible and would save very little time on the downtown routes.

There are exceptions such as some older parts of the inner suburbs that bring physical challenges for transit priority, but also the political challenge that the transit share of road use is lower as one moves outward from the core. King Street is a very different place from Steeles, and Dufferin is somewhere in between depending on which section one considers.

An important message in all of this is that “congestion” (put in quotes because it is so often cited as a get-out-of-jail-free excuse for all transit woes) varies from place to place and time to time. Simply putting transit priority everywhere will not solve all problems and could even be overkill (even assuming that it is true “priority” and not a sham to keep transit vehicles out of motorists’ way). It is simple to colour a bunch of key routes end-to-end on a map, but much harder to identify changes that will actually make a difference. Meanwhile, a focus on “priority” could divert attention from badly-needed improvements in headway reliability and more reliable wait times.

This article begins with a comparison of scheduled travel speed on each route, and then turns to actual travel speeds by route segment. In the interest of length, I will leave a discussion of headway reliability to future articles. This is an important component of total travel time, especially for short trips or trip segments.

I have also included tables showing the constant change in route configurations on the four major east-west corridors thanks to a never-ending procession of track and water main work, rapid transit construction, and overhead changes for pantograph operation. Some of this work was accelerated to take advantage of lighter traffic conditions during the pandemic, and some to bring forward work to keep staff employed.

However, the rate of route changes persisted well beyond the heart of the pandemic and threatens the credibility of transit service on major corridors leaving riders constantly wondering where their streetcar or replacement bus might be. Some changes occurred without the planned work actually taking place, or work started and ended later than announced (sometimes much later as in the never-ending KQQR project).

An important change over recent years, separate from the pandemic, has been the move to larger streetcars on wider headways. What might have been a tolerable unevenness in service when streetcars arrived every 4 or 5 minutes simply does not work for scheduled headways of 10 minutes with much wider swings. Bunching when it occurs leaves much bigger gaps between vehicles. A laissez faire attitude to route management, and especially the assumption that routes under construction cannot be managed, has led both to unreliable service and basic questions of how or if the TTC can recover the quality riders expect.

For all the talk of project co-ordination, the last people who seem to count are the riders. Simply studying raw travel times be they scheduled or actual does not capture the frustration, delay and despair from the ever-changing and unreliable services, be they by streetcar or bus.

Continue reading

36 Finch West: Travel Times Between Keele and Humber College

In a recent thread on X/Twitter (and no doubt other venues) there has been some controversy about the relative speed of 6 Finch LRT versus the bus service it will replace. Writers have based their arguments on speeds published in the Scheduled Service Summaries, although these are not always reliable for various reasons:

  • The speeds shown are over the full route. For the 36 Finch West service west of Keele Street (Finch West Station), this includes the portion south of Humber College to Humberwood Loop.
  • Actual speeds vary from the scheduled ones, and there is a fair amount of scatter around these averages. An important factor in any reserved lane implementation, regardless of technology, is the hope that, as on King Street originally, better reliability can be brought to travel times and hence to service quality.

The purpose of this article is to review actual travel time data on weekdays for selected months between 2017 and 2023. The specific months were chosen both for variety, but also within the limitations of data that I have been collecting for several years. 36 Finch West fell off my radar, so to speak, in 2022 and I was not tracking it, but began again in 2023 in anticipation of the LRT opening to get some “before” data.

The data are shown in two formats.

  • Weekly average travel times by hour together with the standard deviations in data values, a measure of the scatter in the data.
  • The raw data points to give readers a sense of the range of travel times that can occur on a day-by-day, hour-by-hour basis.

The challenge for the LRT line is to both reduce the averages times, and to narrow the band in which these times lie.

The section measured is from west of Keele Street to Humber College. This is chosen to ensure consistent data for departures from Finch West Station in the post-TYSSE era, and coincides roughly with the LRT portal from Finch West Station. This also eliminates station time which can vary considerably, especially for the bus service, due to the station’s location.

Data for October 2017 and April 2018 precede the opening of the TYSSE and the start of construction on Line 6, and they are included as a stating point against which any improvement might be compared.

Westbound and eastbound data are shown side by side, and the charts move forward in time from top (2017) to bottom (2023)

Continue reading

Searching for TTC Reports

Finding old TTC reports can be a challenge thanks to the organization of their website.

As convenience to readers (and myself), I have built an index to TTC reports organized by topic going back to January 2020. This covers the period from the pandemic onward.

The index is available here and in the Reference Material pulldown from the navigation bar.

I will update this index as new meetings occur. As for 2019 and before, that may or may not appear at some future time as I have many other current-day affairs to report on.

Fun With Figures: The Value of Transit Investment

A common, but troubling practice in talking about transit is the attempt to build a “business case” as if city’s transit network can be examined through a rather simplistic management school lens. Everything is reduced to a monetary value, be that direct spending, spinoffs, or the notional value of benefits.

Aside from basic errors in methodology, this approach assumes that the supposed value of transit spending can be gleaned from a one-dimensional view of its so-called worth in dollars and cents. Bad enough that this practice is entrenched in Metrolinx, an agency that sets priorities based on political, not financial, evaluations thereby undermining the credibility of financial analyses. The scheme has trickled down to the municipal level with a TTC/UofT study intended to show that money for transit has financial benefits and should be encouraged for the good of city and country.

You might ask why a transit advocate has misgivings about this exercise, but the answer lies in my long-standing conservatism (with a very small “c”) about public spending generally. Megaprojects bring press coverage, especially with the opportunity to announce over and over the latest step, no matter how trivial, as work inches along. This tactic works as long as there is success to report, and we just don’t talk about abject failures like Line 5 Crosstown any more often than needed.

A huge problem with the TTC’s gaping hole in Capital funding, and to a lesser extent on its Operating side, is that the cry “please, Sir, I want some more” for transit support wears thin with would-be partners. Moreover, everything on Toronto’s wish list does not necessarily align with political priorities elsewhere, and it must compete with demands from other cities and provinces. Thus the desire to show that transit spending has a great “payback”, but that number hides fundamental questions.

The problem with spending for its own sake is that one rarely hears the question “what else might we do with these billions” or “is this project really worth its cost compared to other demands on public funds”. How much is not built or operated because some other project took priority, or the growing cost of works already underway crowded other new schemes off of the table?

Into our political environment, one rife with patronage, cronyism and outright corruption, comes an attempt to justify spending on transit as an inherently good thing.

In 2022, the TTC launched a joint study with the University of Toronto Mobility Network which surfaced as part of the 2023 and 2024 Budgets. The goals of the study were “to identify and quantify the economic and other key benefits resulting from investment in transit and the TTC”:

  • Economic benefits realized from investments in transit services and capital works that enhance TTC’s existing transit network
  • Economic impact of the TTC on the local, regional, provincial and national economy
  • Qualitative and quantitative social, equity, health and environmental benefits and the economic spin off benefits derived from these other benefits
  • Impacts should the necessary service and capital investments not be made in the TTC
Continue reading

King Street Travel Times: May-December 2023

This article is an update to King Street Travel Times: May-November 2023 incorporating data for December 2023. The charts here show the variation on a day-to-day basis for selected hours of service including the morning peak 8-9am, midday 1-2pm, and hourly from 3pm to 11pm.

Items of note:

  • The problems in late 2023 were predominantly eastbound caused by a combination of auto traffic entering the King Street corridor and filling all available capacity, and by delays eastbound at Church for TTC vehicles making left turns on diversion routes.
  • There are early signs of this problem in the hour from 1 to 2pm, but it worsens dramatically from 3pm onward and travel times do not settle down to normal values until after 7pm.
    • This shows the need for traffic management over an extended period, not just for a short “peak within the peak” interval.
    • The problem receded somewhat in December with the implementation of traffic wardens, but various construction projects, some unplanned, also affected the street.
  • The day-to-day variation in travel times, and by extension in the amount of competing traffic, generally peaks on Wednesday.
    • This was already evident in Spring and Summer data indicating a problem brewing for later in the year as construction affected parallel roads.
    • The peaking within the week, and the different behaviour by time-of-day and direction show the folly of citing “average” values. By extension, the quality of service varied substantially depending on the level of congestion, and this affected entire routes, not just the downtown portion.
  • There is a regular increase in travel times in the evening, notably on Fridays, corresponding to the busy day in the Entertainment District. This is not as severe as the peak period delay eastbound, but it is a quite regular occurrence.

When the January data are available, I will update these charts to show how consistently the December improvements have survived past the holidays and without major construction works on Adelaide Street.

Continue reading