
This post reviews the evolution of travel times for 504 King streetcars across downtown between Bathurst and Jarvis Streets, the scope of the so-called transit priority zone. There are many problems with how this zone actually operates, but matters reached the meltdown stage in recent months with the combined effect of the Queen Street closure at Yonge for the Ontario Line, the Adelaide Street reconstruction for utilities and an eventual streetcar bypass track for Queen cars, and emergency utility work on King east of Jarvis.
There were other contributors, but there are two important issues. First, everyone assumes that their project won’t bring chaos, often because they only look at local effects for their site (e.g. a new condo construction project with a curb lane occupancy), not for the network as a whole. Second, not only is enforcement of the transit priority rules missing in action, but the added management needed for extra volumes of turning transit vehicles meandering on their temporary routes is also absent.
I recently received the detailed TTC vehicle tracking data for 504 King for November, and have crunched this into a chart that long-time readers will remember from the days when the “King Street Pilot” was in its infancy.
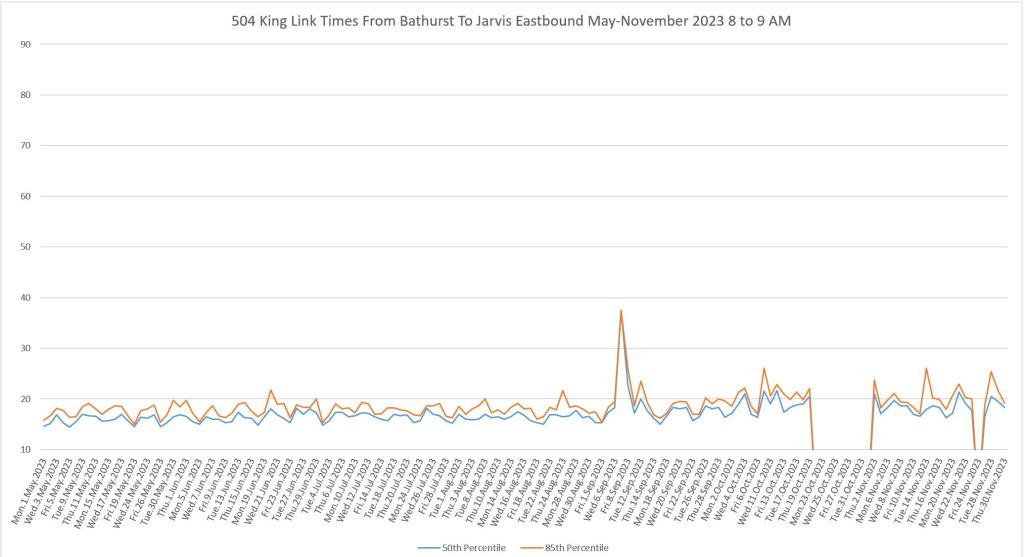
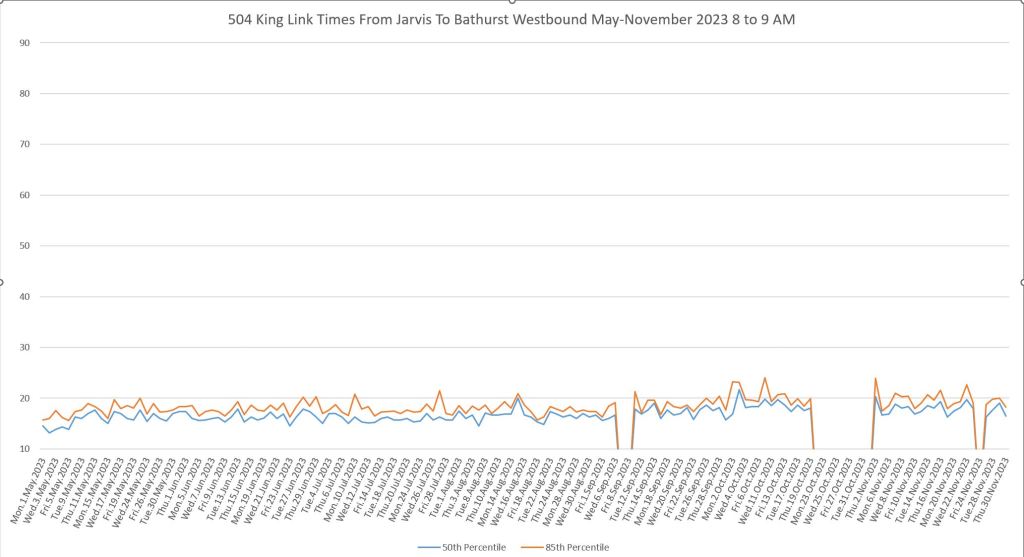
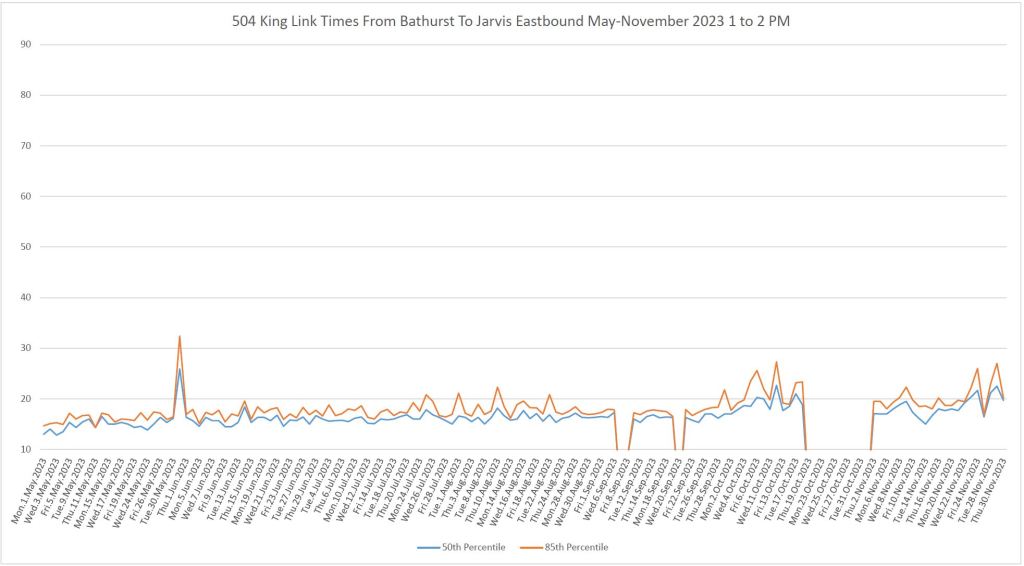
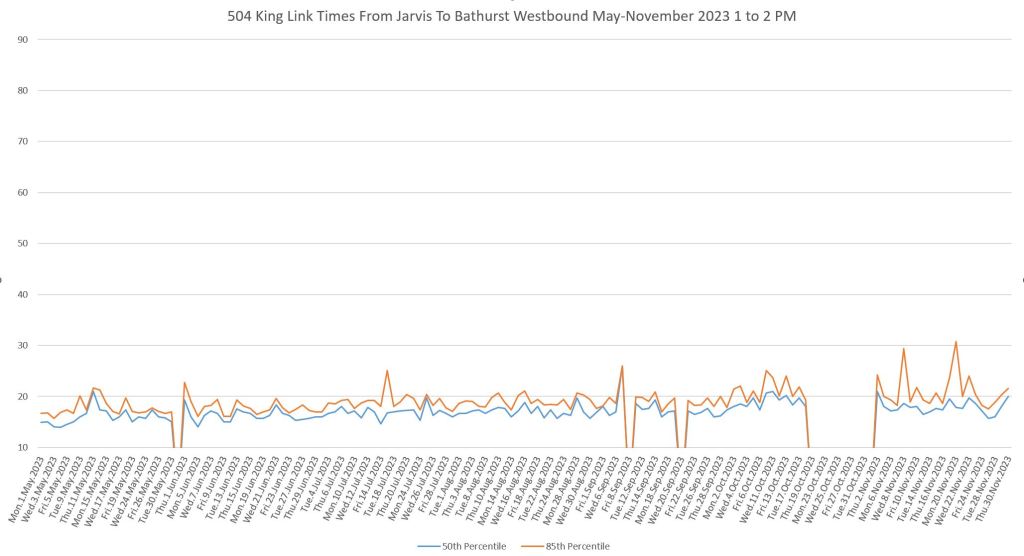
The main set of charts here show travel times for eastbound and westbound streetcars in May through November 2023. Later in the article, there are a few charts to show the historic context for the effects of various changes on King Street over the years.
As in all of these articles about service quality and operations, the data come from the TTC, with much thanks for a long-standing arrangement. The programs to condense the data into manageable charts are all my own, as is the analysis of what they might mean.
May to November 2023
A few notes about these charts:
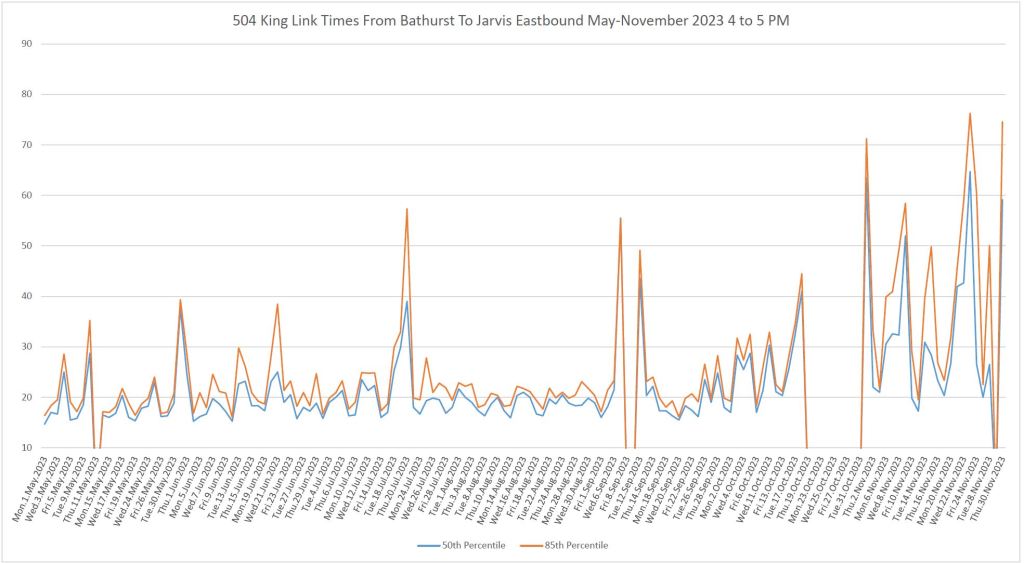
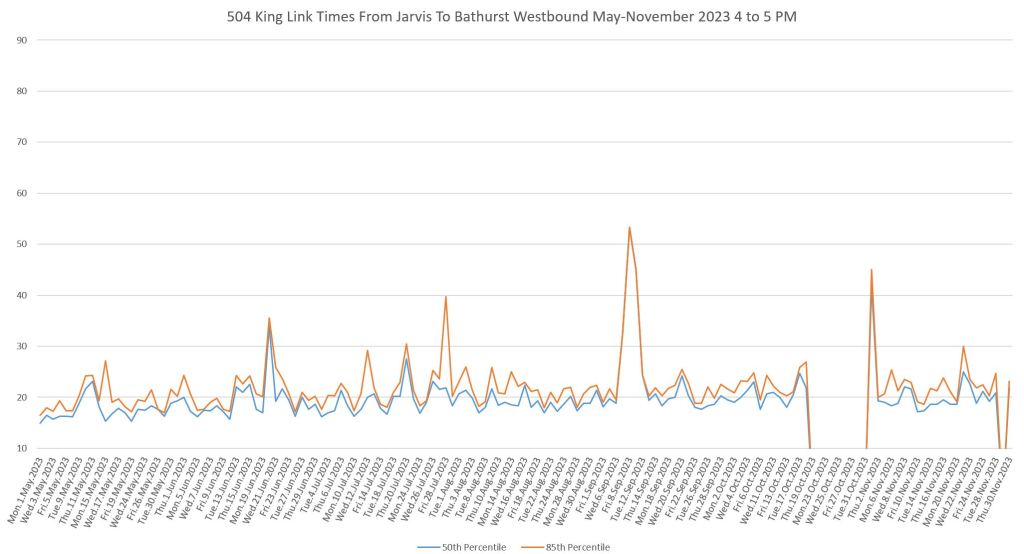
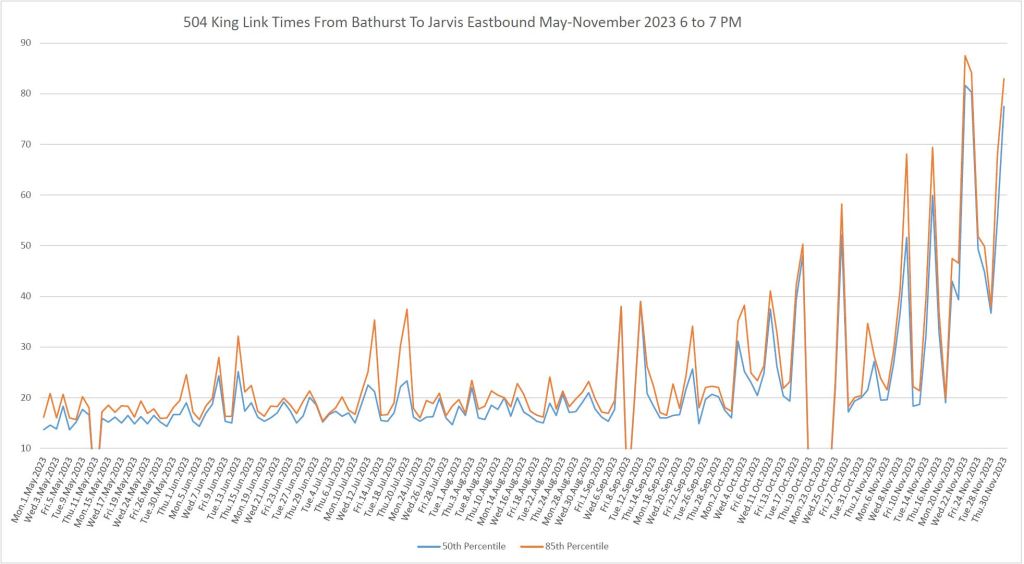
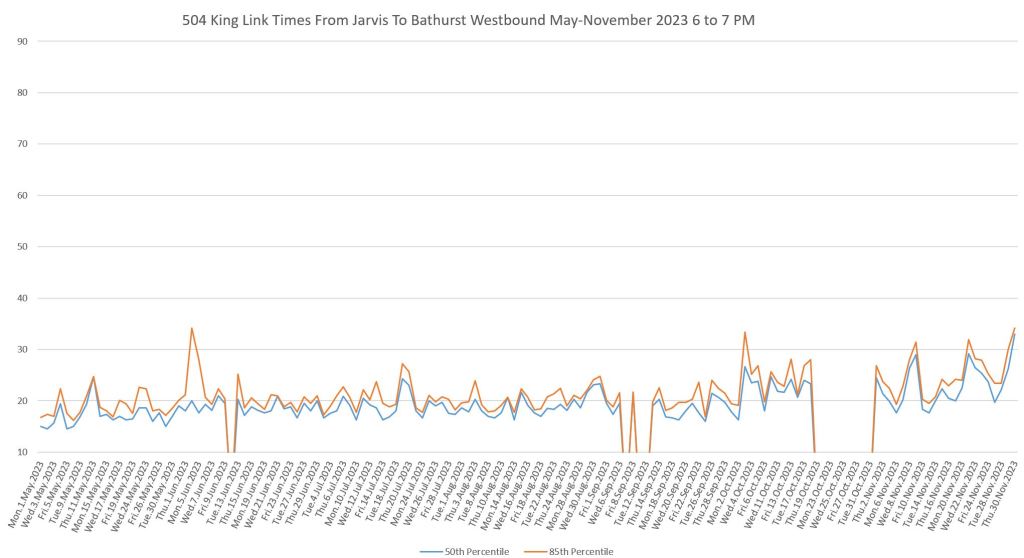
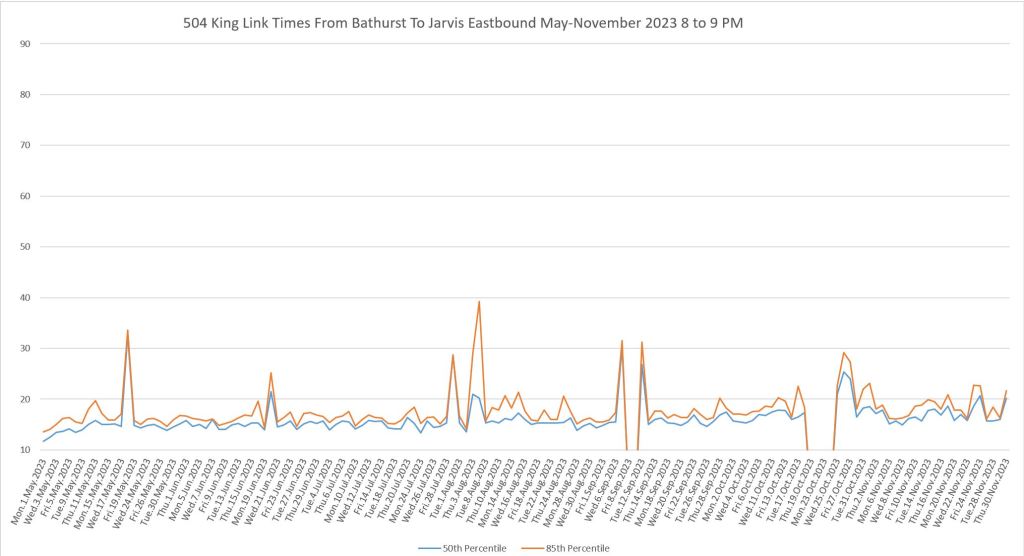
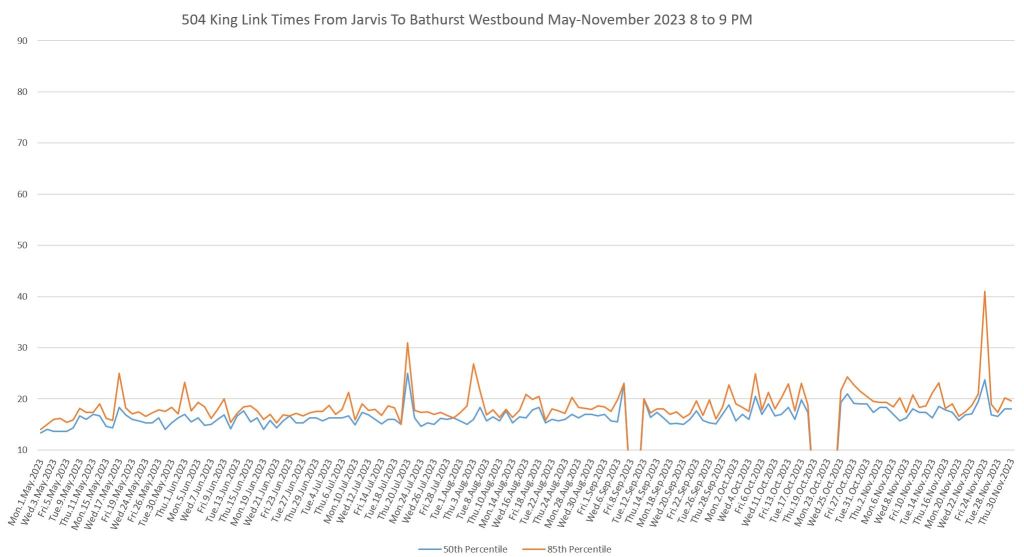
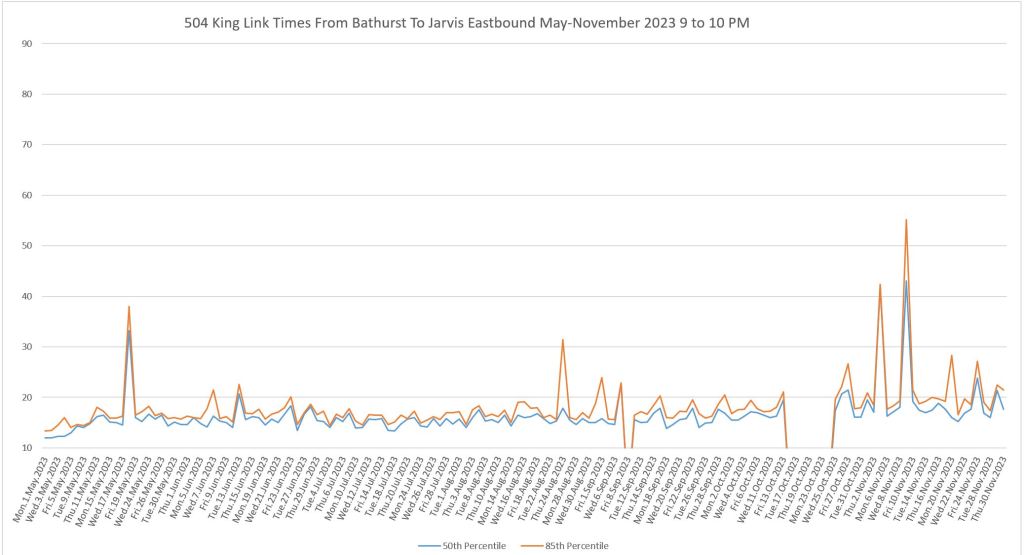
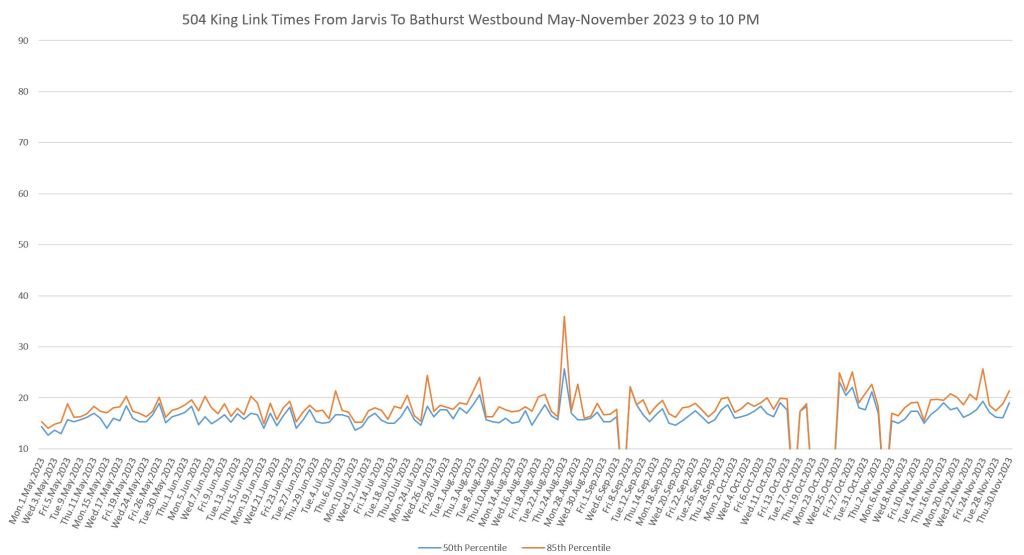
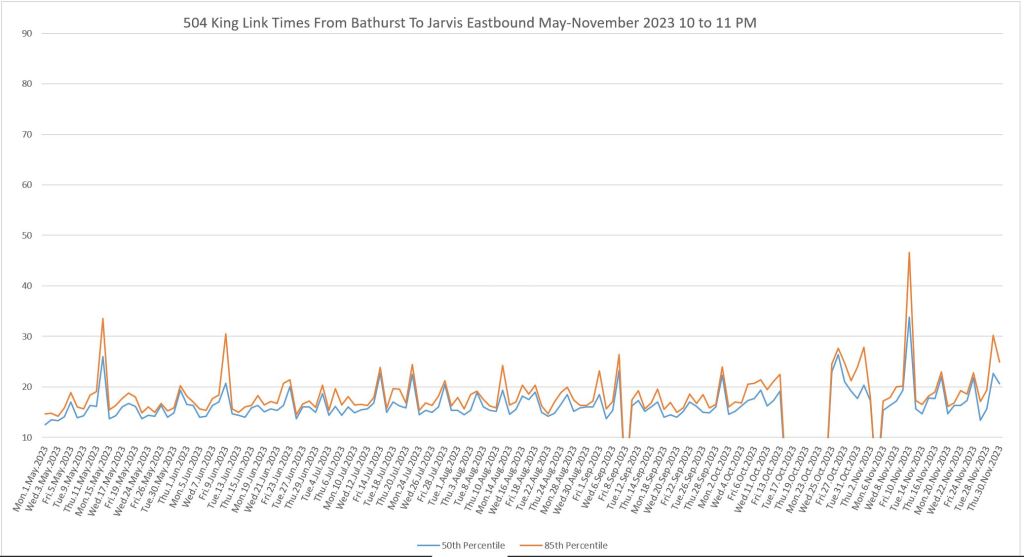
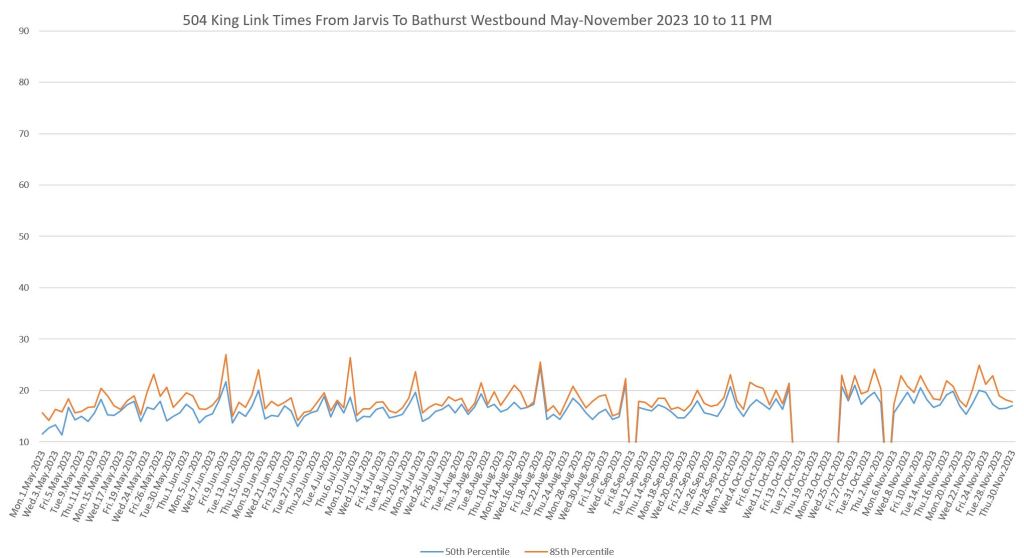
- Each pair of charts is for the same hour in the day with eastbound data on the left and westbound on the right.
- Previous versions have used a y-axis (vertical) running from 10 to 40 minutes. Clipping the bottom (where there are no data points because vehicles don’t move that fast) gives the charts a bit more room. However, the recent data have such high values that an upper bound of 90 minutes was needed.
- The blue lines are the median values. Half of the travel times lie above this, and half below.
- The orange lines are the 85th percentile. Only the worst data values lie above this line.
- The two lines generally stay close together indicating that there is only a small span between the 50th and 85th percentiles. Unlike some other analyses on this site, notably of headways that bounce all over the place, the travel times stay fairly consistent for the same day and hour.
- Only weekdays are included.
- There are gaps in data for periods where King cars did not make a complete trip between Bathurst and Jarvis due to TIFF in early September and the sinkhole east of Jarvis in late October.
There is a marked difference between eastbound and westbound data in recent months. The problem of autos backing up across intersections is worse southbound on streets like University with traffic headed for the Gardiner Expressway. This has a greater effect on eastbound service which is on the south side of the street. A separate type of delay is caused at Church and King where many transit vehicles attempt to turn at a signal that has no priority, and a green phase that only allows one vehicle through per cycle. The absence of traffic management here, the need for transit vehicles to stop in various locations depending on the route they serve, and the volume of pedestrian traffic conflicting with turns all combine to delay service.
Early in the day, traffic flows smoothly. In the hour from 8 to 9am, there has been a gradual increase in travel times both ways from about 15 minutes in May to about 20 by late November. This is echoed in the 1 to 2pm data.
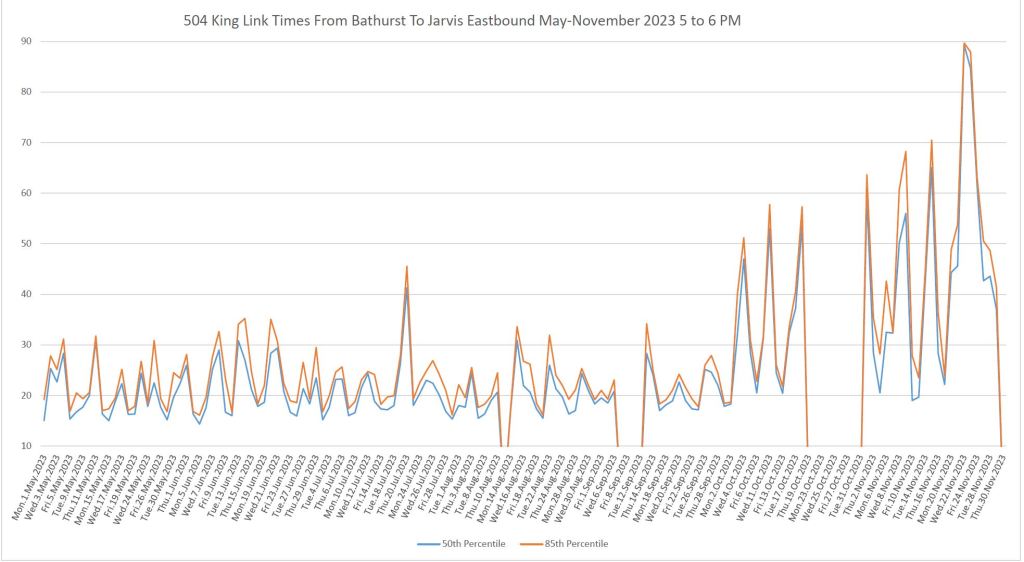
After 4pm, the data change dramatically, especially eastbound and the travel times have increased to previously unseen levels from September onwards. What is most striking, however, is that instead of a gradual rise in values, there is a repeating peaks-and-valleys pattern that is one week long with the high point usually on Wednesday. This shows how there is a day-to-day variation in traffic conditions where in the worst case, the road system is incapable of handling the demand.
Many of the low points fall back close to the 20 minute mark typical of off-peak travel showing a street that has not choked on traffic and streetcars that take only slightly longer for their trip across downtown in the “peak” period.
However, this pattern has been evident for months, but was probably considered a tolerable condition, at least until the fall by which time it was too late.
Click on any panel to open the deck as a gallery.
Daily Variations
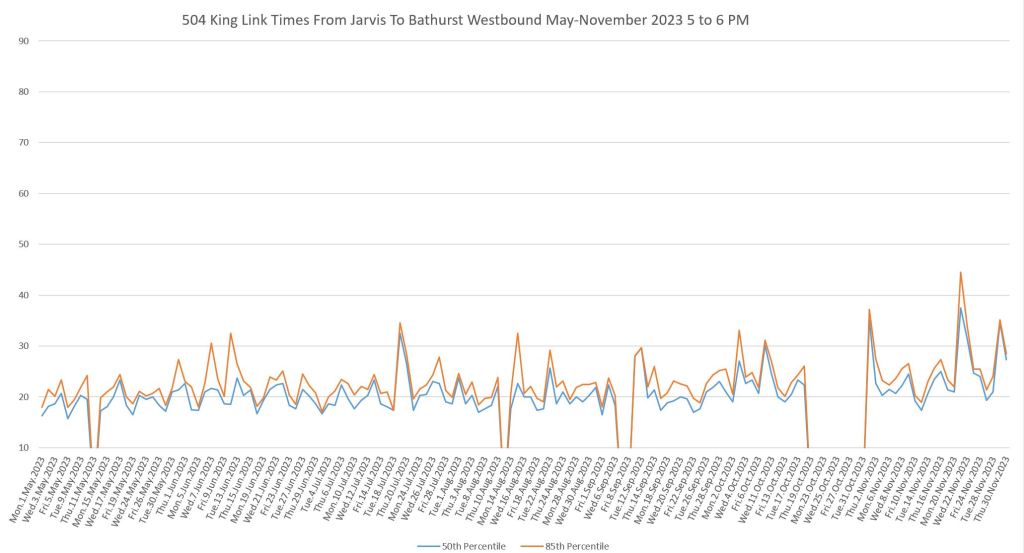
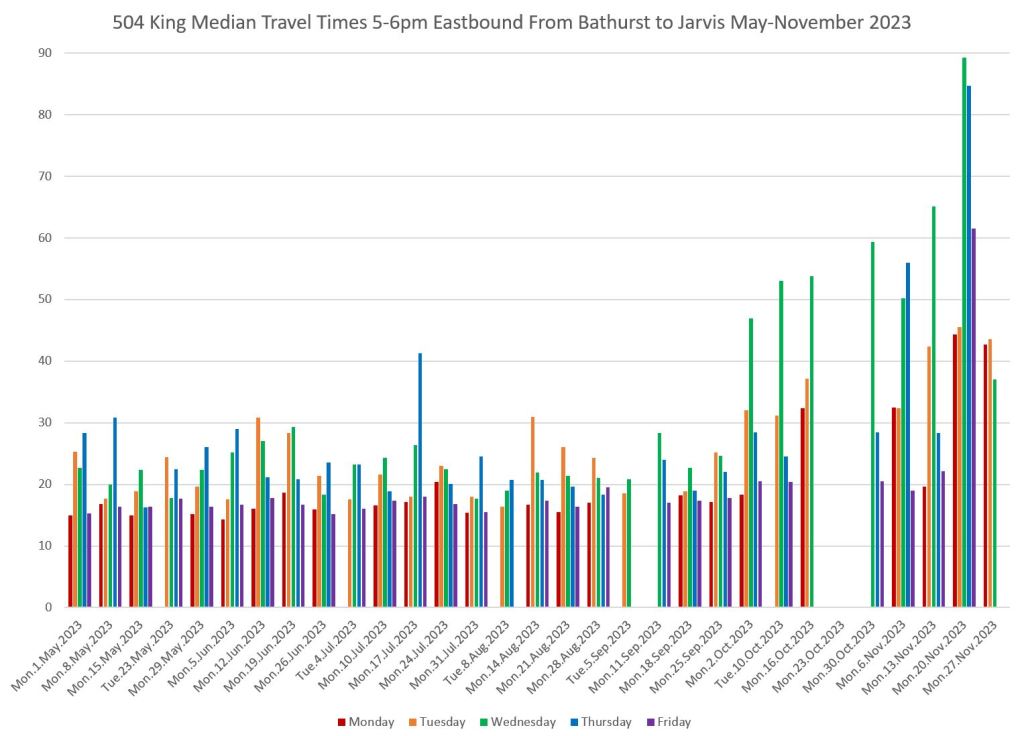
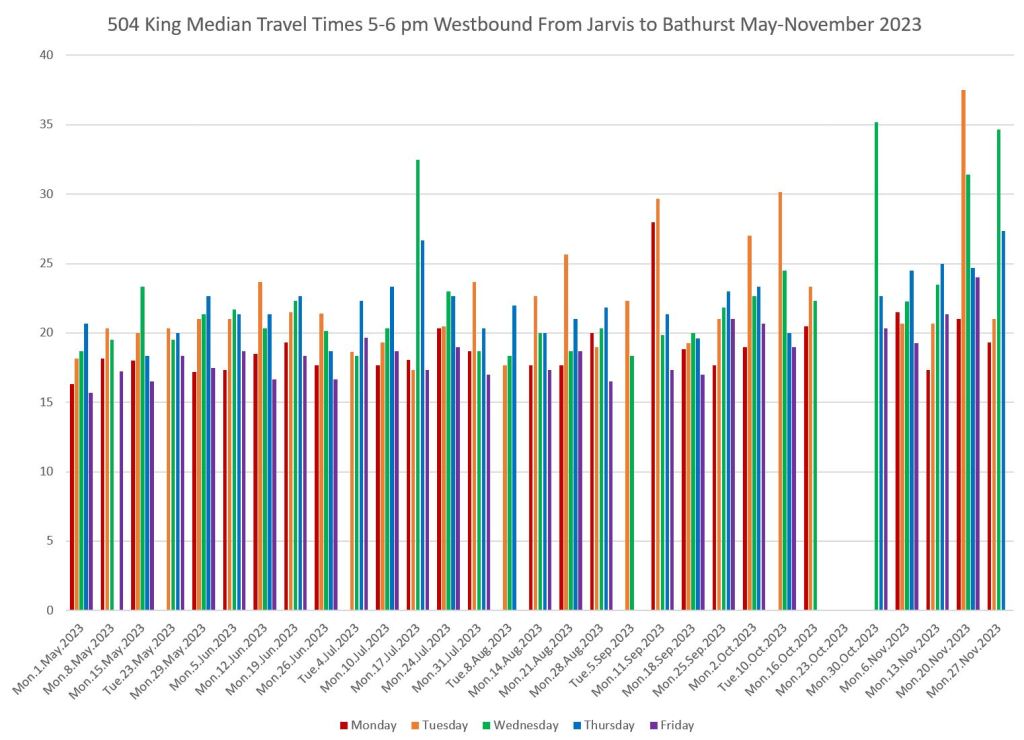
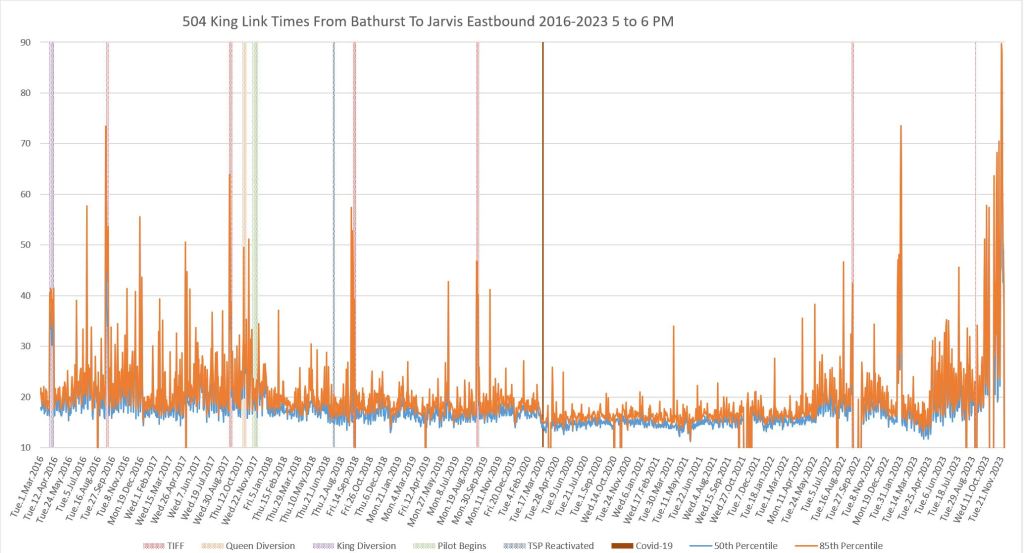
There is a daily variation in travel times at peak periods when the roads are busy. The charts below show the values for the hour from 5-6pm grouped by week, and with each day given its own colour for the eastbound and westbound travel across King Street.
Note that the vertical maximum for eastbound at 90 minutes is more than double the 40 minutes value for westbound so that the recent growth in travel times will fit on the chart.
A regular pattern with high values on midweek days (Wednesday is green) is quite clear. This shows how traffic volumes downtown vary by day, and how conditions on some days (notably Fridays, mauve) did not change much until mid-November.
Conversely, any traffic management designed around “average” conditions is doomed to failure because there is such a difference between days of the week.
Segment by Segment
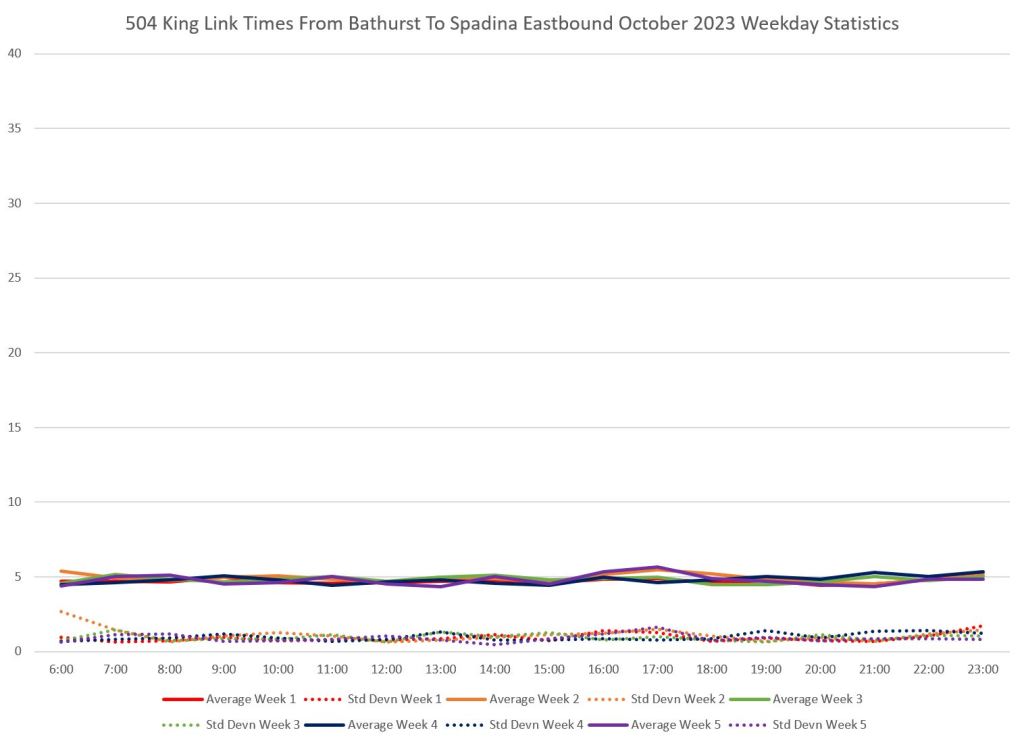
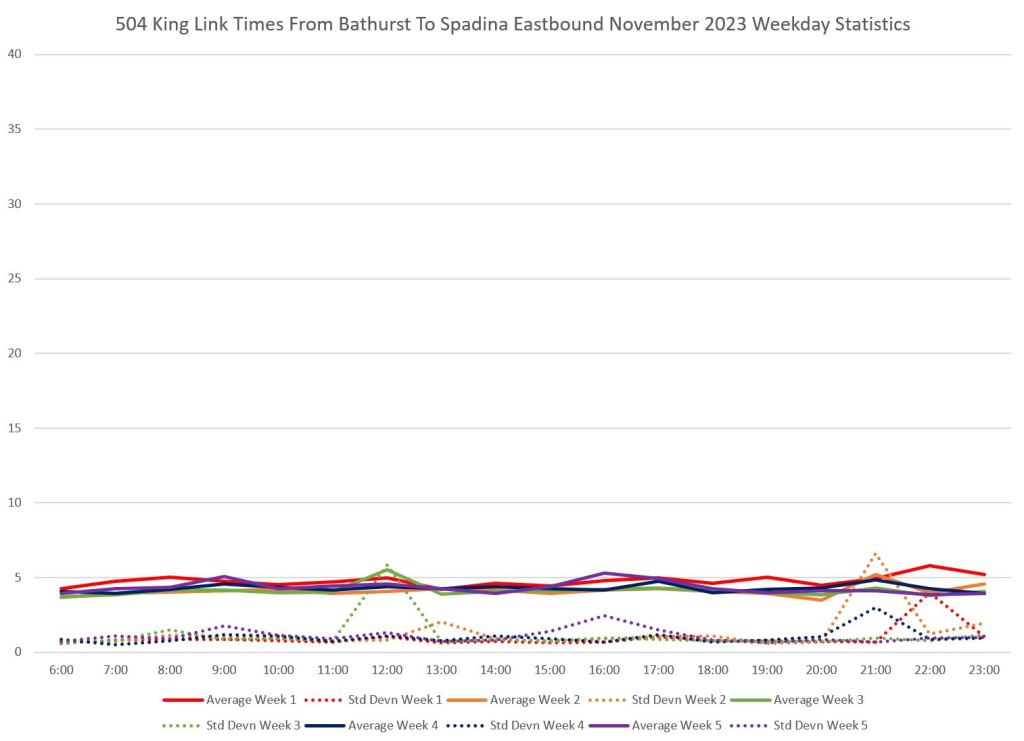
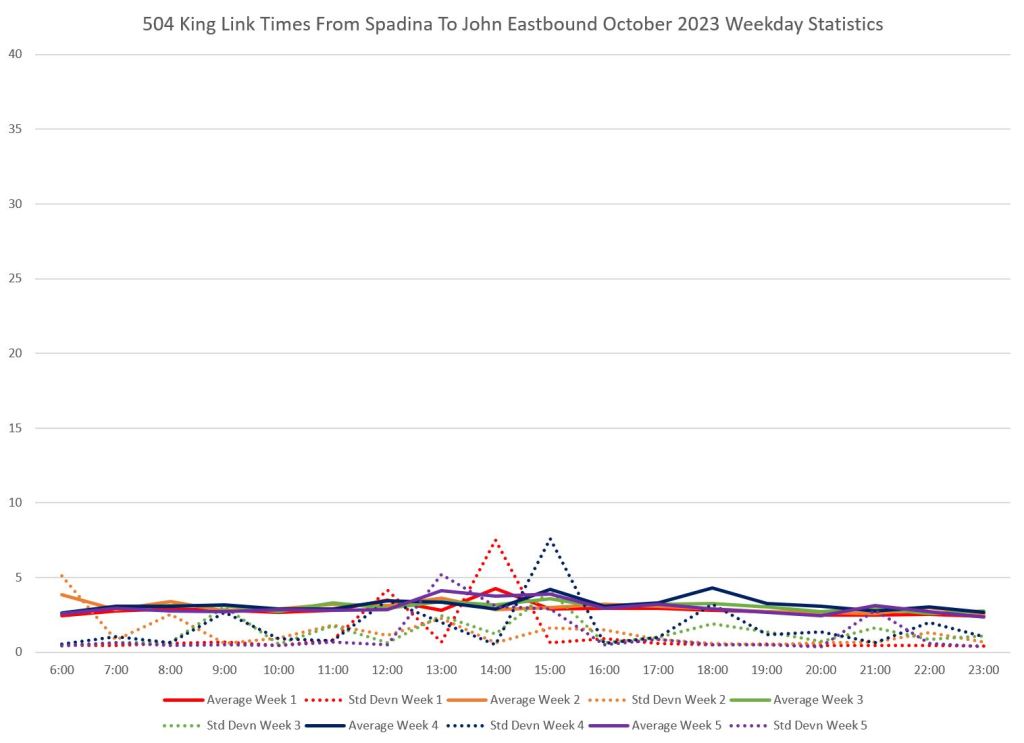
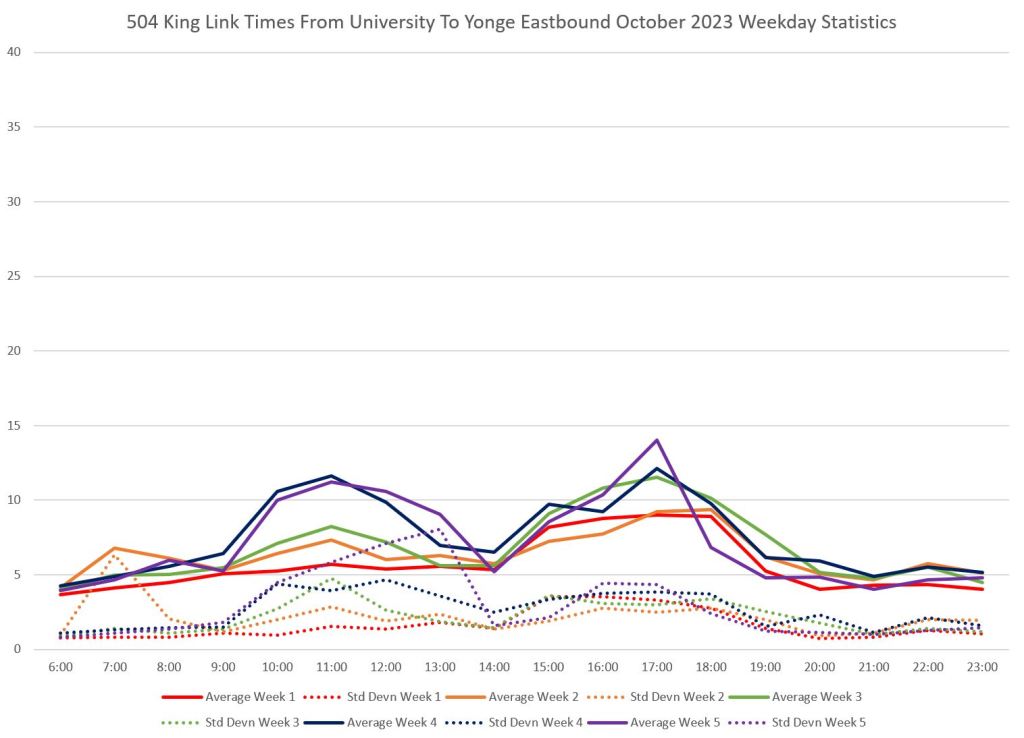
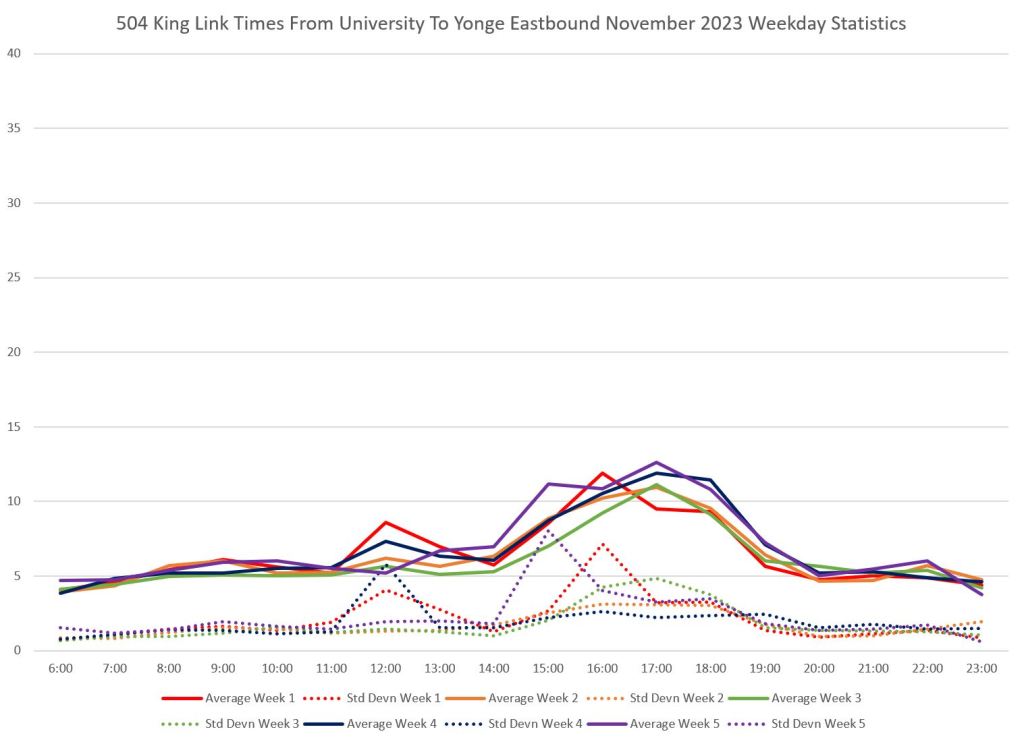
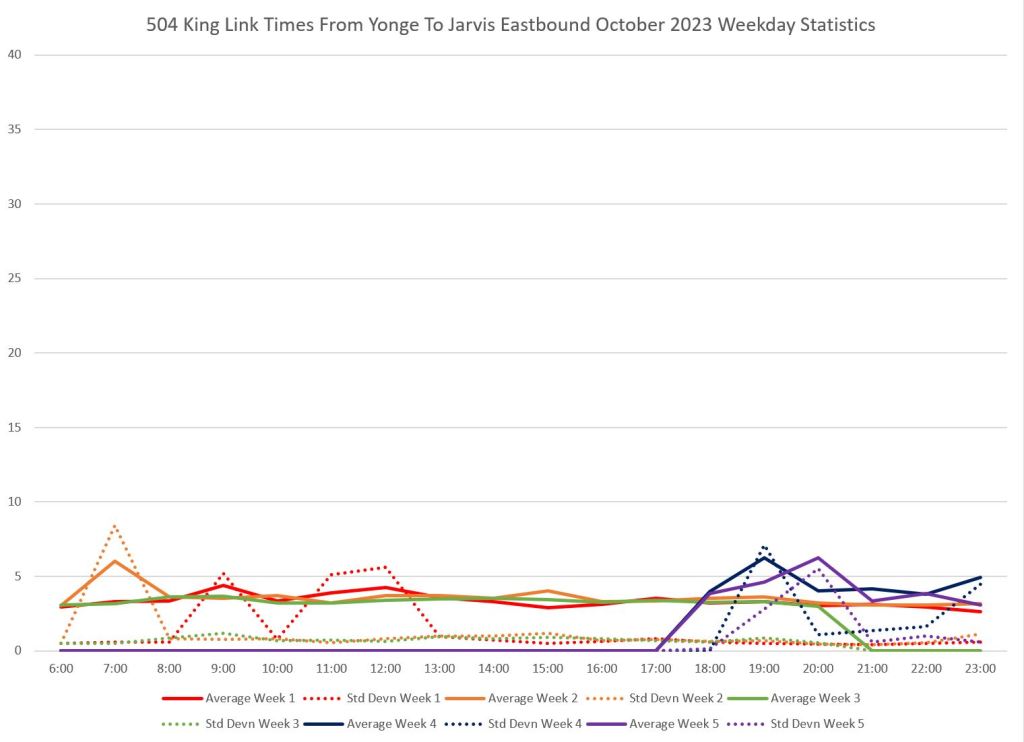
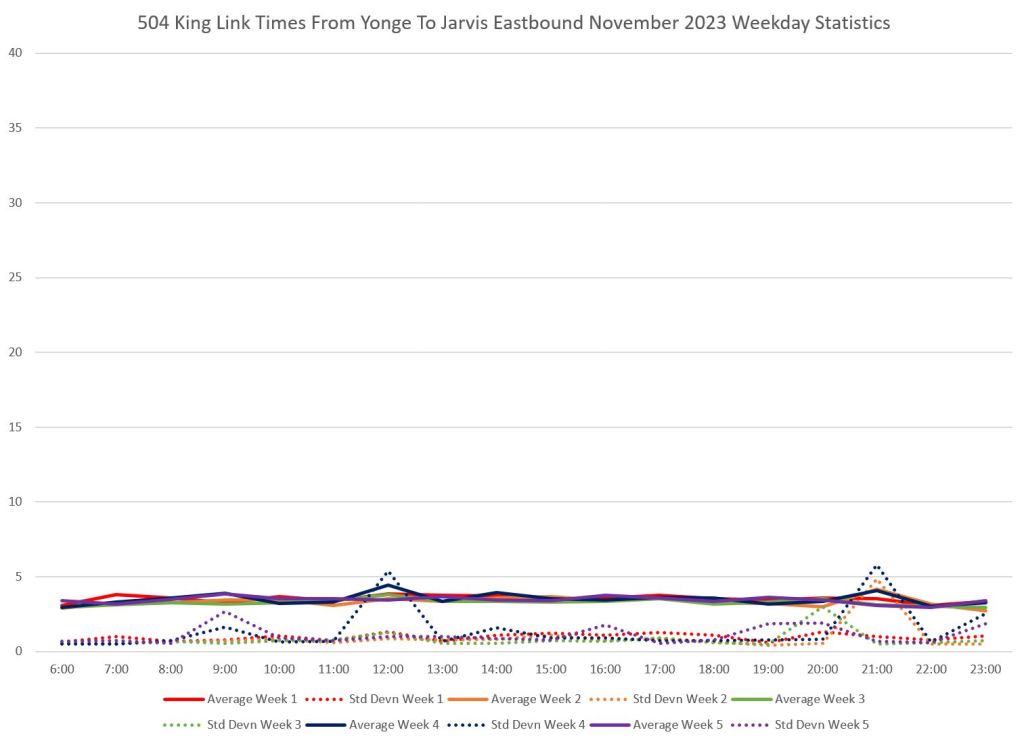
The next set of charts shows the average travel times on a weekly basis for segments of King Street between Bathurst and Jarvis for October and November 2023. This shows the evolution of delays over that period, but at a finer granularity than across the entire “priority” area. Also visible is the effect of the “sinkhole diversion” late in October which added turns to the demand on the Church/King intersection and their associated backlog.
An important point about these charts is that they show weekly averages, and as we know from the preceding section, the actual values vary from day to day.
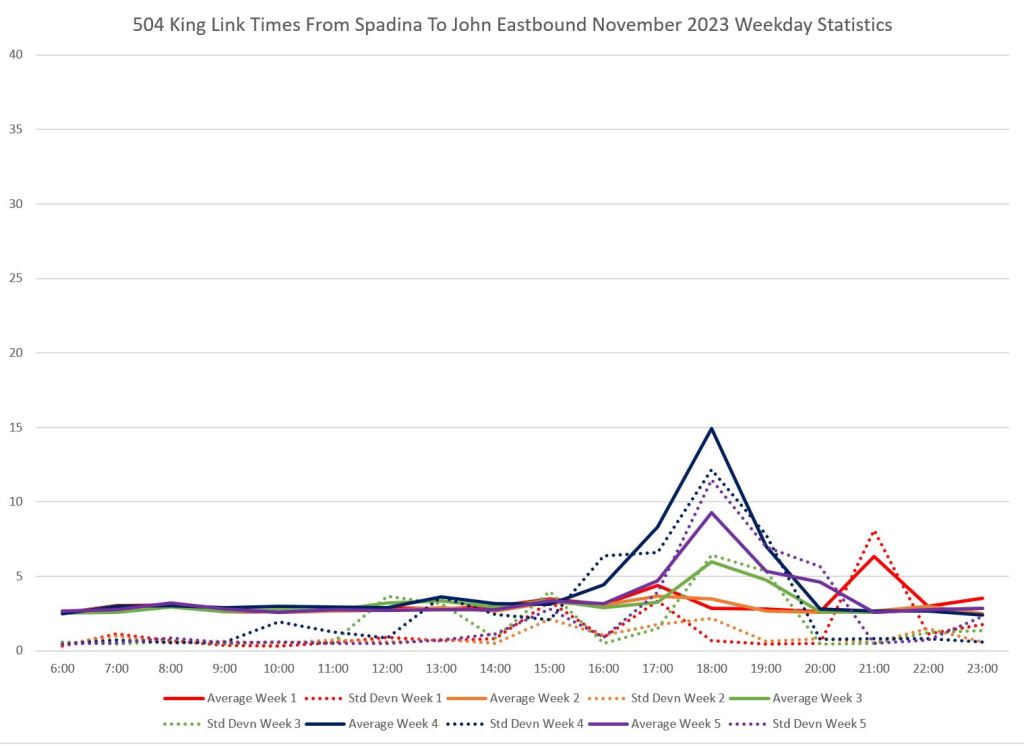
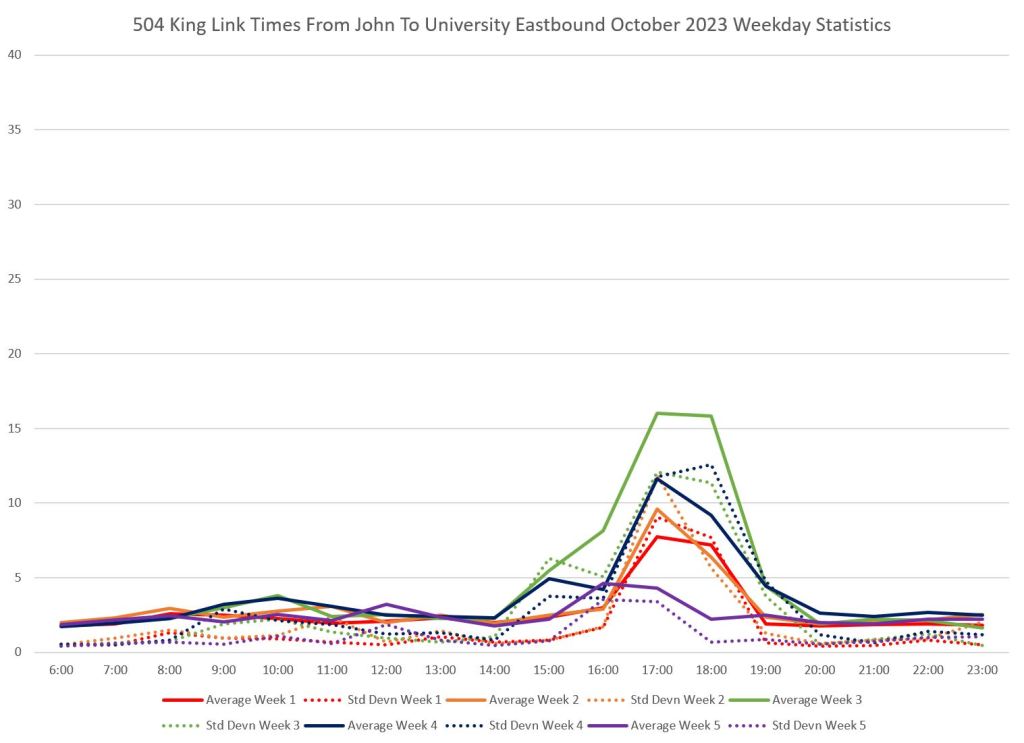
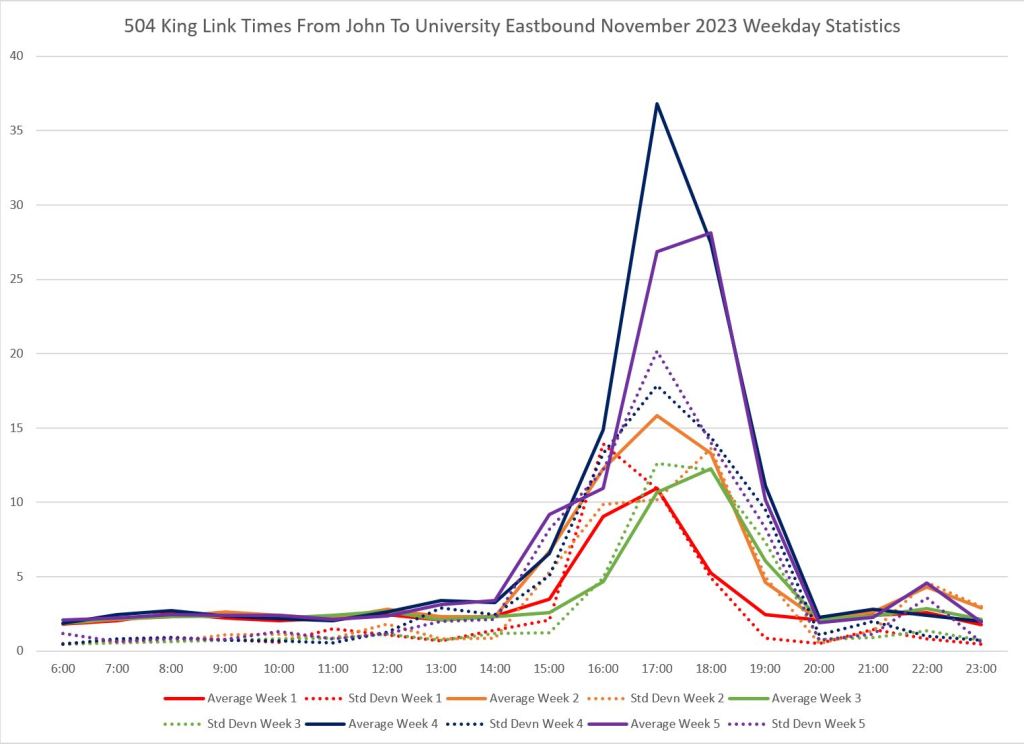
October data is on the left, November on the right. The solid lines show the weekly averages by hour. The dotted lines are the standard deviations of these values. A low SD indicates little scatter in the individual values, whereas a high SD shows that the averages can be masking daily variations.
- Bathurst to Spadina: The travel time in this segment is boringly consistent at five minutes for the two-month period.
- Spadina to John: In October the averages stay fairly flat, but the SD values show that there is variation at midday in a few weeks. In November, the PM peak backlogs show up in the averages beginning in week 3 (green).
- John to University: Backlogs at University appear for much of October, but they worsen in November. Note that “week 5” of October (mauve) has less of a peak because it contains only a Monday and Tuesday (30th and 31st) which are not peak days.
- University to Yonge: This segment has two peaks including the midday period in weeks 4 and 5 of October. This corresponds to the period of the sinkhole diversion which caused backlogs from Church Street.
- Yonge to Jarvis: There are no data points for the period of the sinkhole diversion, and so no associated delays shown in the chart because service did not cross Jarvis/King eastbound. When cars ran through, the travel times were fairly consistent except in the last weeks of October in the evening when cars operated through the sinkhole area.
Historical Context
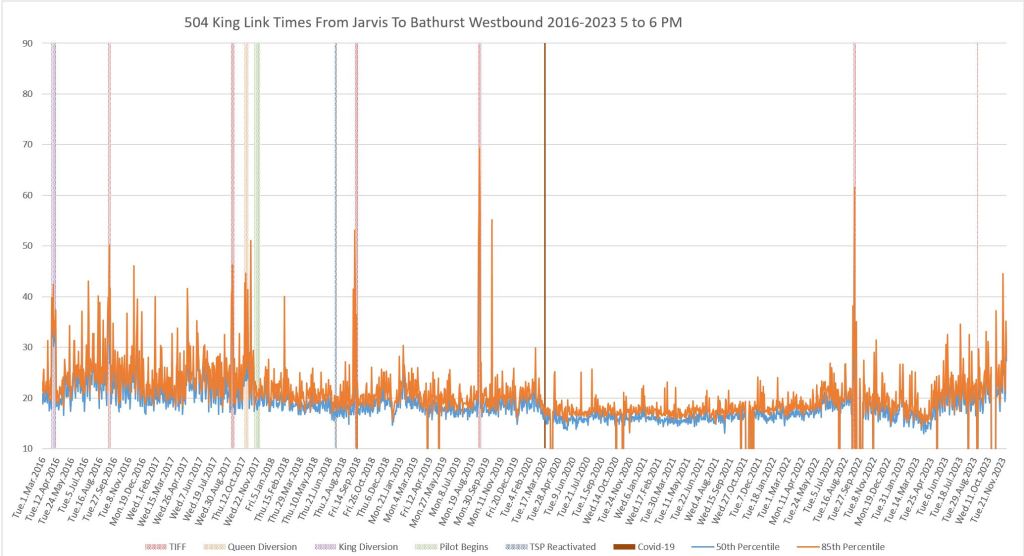
Here are charts showing the same data but over the period from March 2016 to November 2023 for the 5 to 6pm hour. Points to note:
- The median value (blue) moves between about 18 minutes and 15 minutes over most of the period, only rising above 20 minutes in the last two months.
- The vertical green bar marks the point where the Pilot went into effect. Notable here is a small decrease in the median, but a large reduction in the “spikes” of the 85th percentile showing that the service was not as frequently and badly disrupted.
- The vertical brown bar marks the March 2020 Covid lockdown and the disappearance of traffic from King Street. This is important both to show what happened, but also as an indication of a best case scenario for any transit priority scheme. The pandemic gave an example, impossible otherwise, to see what happens if the traffic goes away. Of course many of the riders went away too.
- By fall 2022, travel times start to rise. This was the false “all clear” before the omicron variant hit and the city locked down again.
- The growth both in travel times, and in the spikiness of the 85th percentile values builds from Spring 2023 onward.
In all of this, the vital point is that the reduction in variability counts much more than lower absolute travel times that made the King Street project a success while it lasted. If riders know that their trip will almost always take the same time, and that wait times are predictable, they will adjust their scheduling for the combined effect of lower waits and faster trips.
If neither factor is reliable, riders must assume the worst case for every trip whether the time is needed or not. The TTC will oblige them with a long wait and a slow journey often enough to reinforce the impression of very bad transit service. If they have to walk, the purpose of transit is destroyed.
As the chart shows, the eastbound service through downtown has not been this consistently bad for many years. Note that this only charts delays on King Street and does not include the time required for cars diverting via Church and Queen to inch up and down that short distance.
What To Do About King Street?
There are many factors contributing to the situation on King, and collectively they have brought us to a point where the street (and more generally downtown) has run out of capacity. Some of these problems can be addressed, some we will just have to await a change in conditions.
These include:
- “Box blocking” at intersections: Traffic enters a north-south intersection hoping to clear on the green cycle, but failing to do so. This tends to happen north-to-south in the PM peak because traffic is headed to the Gardiner Expressway. This must be controlled by Traffic Wardens to prevent cars from entering before they can actually cross. Problem locations include Jarvis, Bay, University and Spadina.
- Infilling of east-west capacity. Turning traffic can fill in space that a streetcar might otherwise occupy preventing the streetcar’s progress on its next green signal. This occurs at University Avenue where cars turn both south-to-east and north-to-east (legal turns, even with an advanced green southbound) filling the space between University and York and blocking eastbound cars. Again, this requires intervention by a Traffic Warden to keep space free for streetcars.
- Lack of protected turns for streetcars: The worst location for this is at Church Street, especially during periods when all streetcars are diverted away from King. The volume of streetcar traffic exceeds the intersection capacity, and streetcars can be blocked by auto and pedestrian conflicts. Traffic Wardens and signal priority for turns are required.
- Mismatched green time allocation: The intersections at Richmond and Adelaide on Church are timed to favour east-west traffic as these streets are de facto ramps to the DVP. Streetcars can take two cycles to clear especially if they stop to serve riders. This is a traffic engineering problem.
- Layovers by transit vehicles consume road space: This problem is most common for the type of diversion now in effect with many vehicles on ad hoc schedules, extra running time, and downtown loops. For example, 504 King cars short turning eastbound at Church lay over on Adelaide eastbound blocking one lane of that street. Replacement buses sometimes park in locations that interfere with other traffic reducing road capacity. This is a transit operations problem.
- The general lack of enforcement of restrictions on auto movements in the “transit priority” area makes fast movement of transit difficult under peak conditions.
- A major problem we must suffer through now is that the reconstruction of Adelaide Street ran in parallel rather then before the closure of Queen Street, in part due to foot-dragging by Metrolinx and their initial idea that a shuttle bus was all that 501 Queen needed. Their delay meant concurrent closures with most traffic forced onto King Street. The lesson here is that any future work should really be planned to avoid such cock-ups, and if this means that City or Metrolinx work has to wait, then it should wait. True transit priority should be in place in advance of the need, not months afterward. This will be important for the Richmond/Adelaide diversion of a re-unified 501 Queen car.
I am well aware that when road space and time are at a premium, forcibly limiting one group of users can produce ripple effects in the network. For example, restricting intersection blocking and turns will delay traffic, but how much more delay would really occur anyhow with roads already over capacity. It is easy to say “it won’t work”, especially if you are a politician risking the ire of their car-driving constituents.
There are more road constrictions in the offing including Ontario Line, building construction and utility work. Planning for these must recognize that “average” conditions will not predict day-to-day variations. Equally, when events that have not been planned for arise, the “average” plan will disintegrate. Much more aggressive approaches to managing traffic, road capacity and transit priority are badly needed. Whether we will see actually anything concrete is quite another matter.

Perhaps red-light cameras could be used to ticket cars that stop in an intersection and are interfering with cross traffic. Do we need to paint boxes in those Gardiner-bound intersections and make it illegal to stop in the box?
Steve: This was tried at Jarvis to no effect. The main purpose of the box is to make it crystal clear where you’re not supposed to be in the event that someone actually appears to hand you a ticket, and this should be automated, not depend on a real person pulling over the offending car(s) into non-existent free space on the road.
LikeLike
The traffic signals should be located at the nearside stop line, not at the farside crossings. Having farside traffic signals means you are still able top see them if you edge into the nearside pedestrian crossings, still see the traffic signal even if you edge into the cross traffic.
With nearside traffic signals, you should not enter the intersection if you cannot make it to the other side. May help preventing motorist sit in the nearside pedestrian crossing.
Steve: Aside from the upheaval in getting the Highway Traffic Act changed, the problem is with motorist behaviour, not signal placement. We know they will ignore signals no matter where they might be.
LikeLike
I’m surprised no one has mentioned that the new streetcars are simply just slower. A CLRV or ALRV only took 5 seconds to discharge a single passenger, a flexity takes 20 seconds due to the speed of the door open/close cycle. This can easily cost the streetcar a light at an intersection adding an additional 60 seconds of delay.
Steve: That is another problem combined with the slow orders especially at junctions. A streetcar can lose a cycle because the traffic light does not wait for it.
LikeLike
And TTC policy of opening all doors at all stops rather than utilizing the door-request buttons isn’t helping either.
It’s cargo-cult transit operations – they got these cool trams because that’s what world-class transit operators use, but they don’t know what to do with them so they keep running them like omnibuses in 19th century.
Steve: I believe that the alleged concern is safety in that passengers won’t know what to do with the buttons and will be left standing in a live traffic lane when the streetcar pulls away after failing to pick them up.
LikeLike
This week the City has had several of the new (and quite efficient) Traffic Control Officers on Church between King and Queen to stop intersection blocking, it seems to have helped things with the extra diversions. Clearly far better to use more of these folk than rely on Toronto Police Service who seem to have totally given up on most traffic enforcement – even if on paid Special Duty. Though I bet it’s not happening, it would be good to take the cost of these traffic folk out of the (bloated) TPS budget.
LikeLike
Excellent! Any chance that you might be able to do the same for other high volume service routes? Curious as to the extent other key service routes are being afflicted with similar issues.
Steve: I plan reviews of other routes, but from experience know that the day-by-day variation is strongest on King because the street is so overloaded with non-transit traffic.
LikeLike