
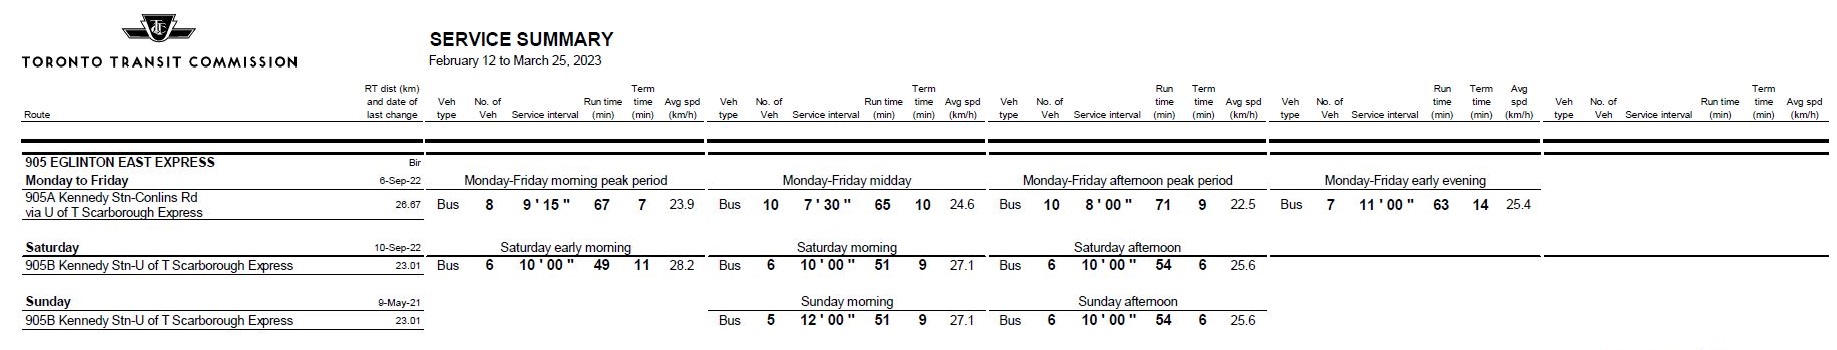
The 905 Eglinton East Express operates from Kennedy Station to the University of Toronto Scarborough Campus with service also via Ellesmere east to Conlins Road on weekdays. This article primarily reviews the service during March and April 2023.
Major differences in the service after March 26, 2023 include:
- Articulated buses replaced standard sized vehicles.
- Scheduled service ran less frequently to compensate for the larger vehicles.
- Scheduled travel times were lengthened.
- A stated goal of the new service design was to improve reliability. This was only partially achieved.
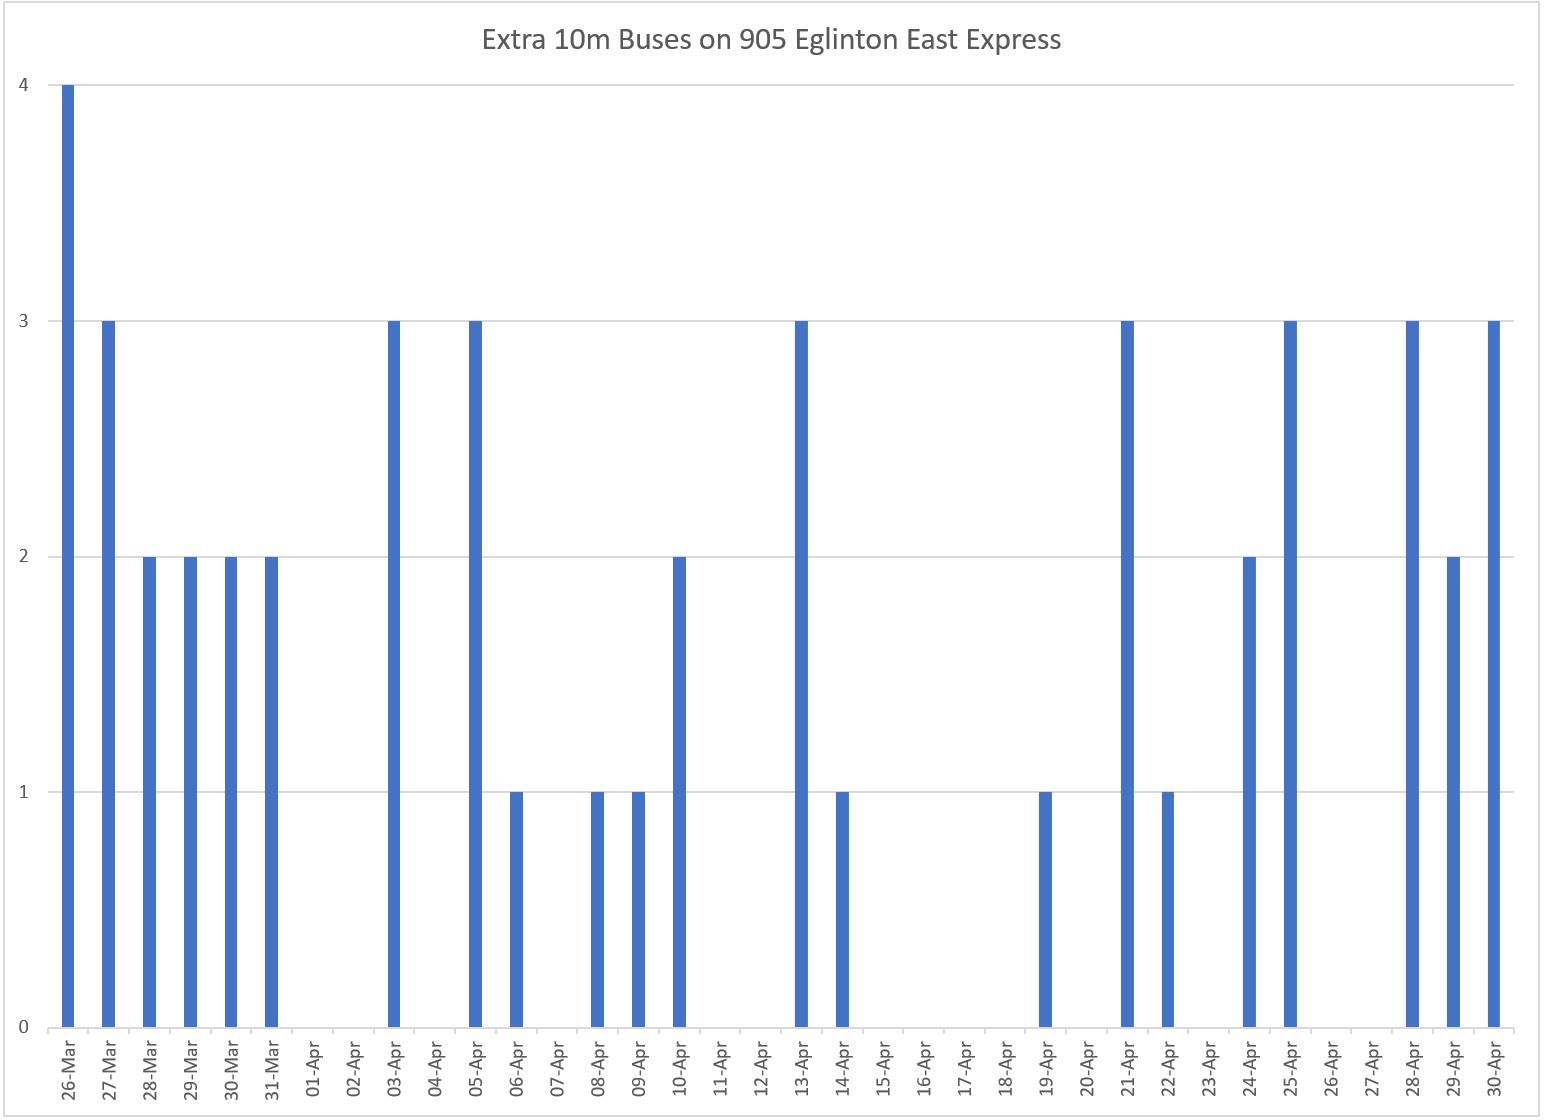
- Although the route officially operates with 18.5m articulated buses, standard sized 12m buses can be found regularly as extras both on weekdays and weekends. This suggests that even before the new service began operating, the TTC realized that they might have cut too deeply. The number of extras varies from zero to three, day by day.
- These are extras that were reported in the tracking data. Whether there was even more unscheduled service is impossible to tell.
- Travel times during the weekday daytime between Ellesmere and Kennedy Station, both ways, increased by 10-15% with the new schedule and larger buses.
Service Designs
March 1 to 25, 2023
March 26 to April 30, 2023

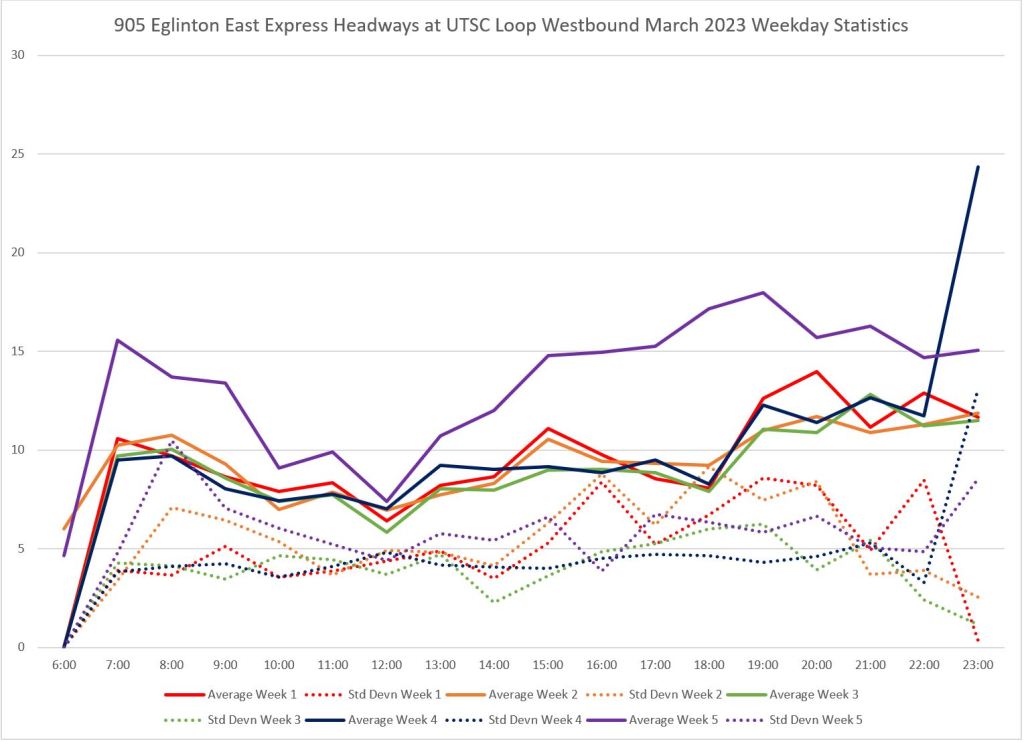
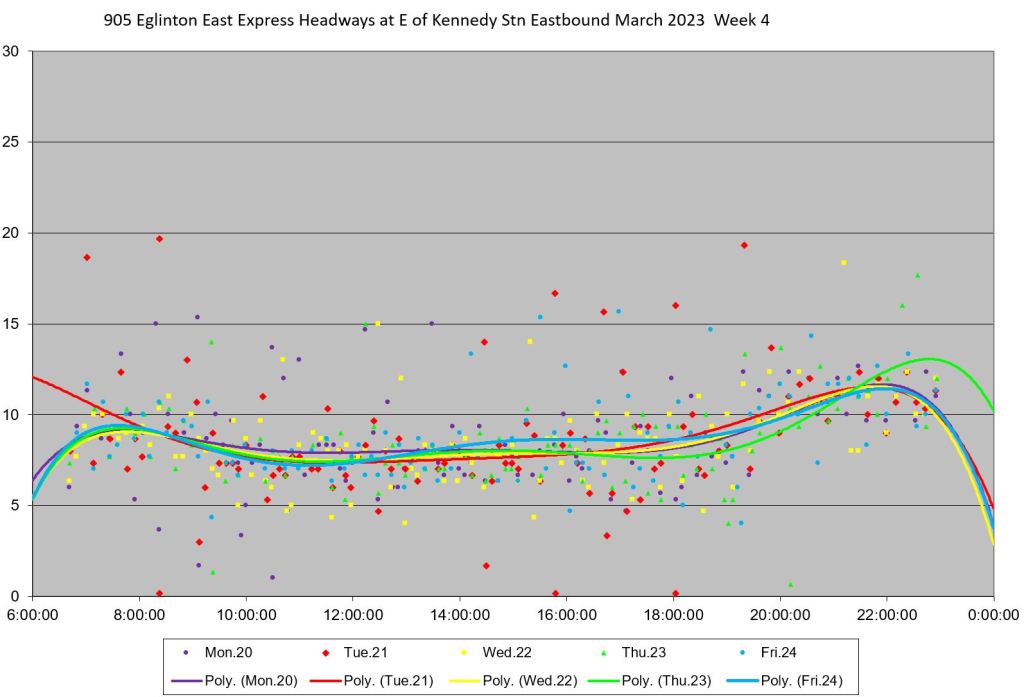
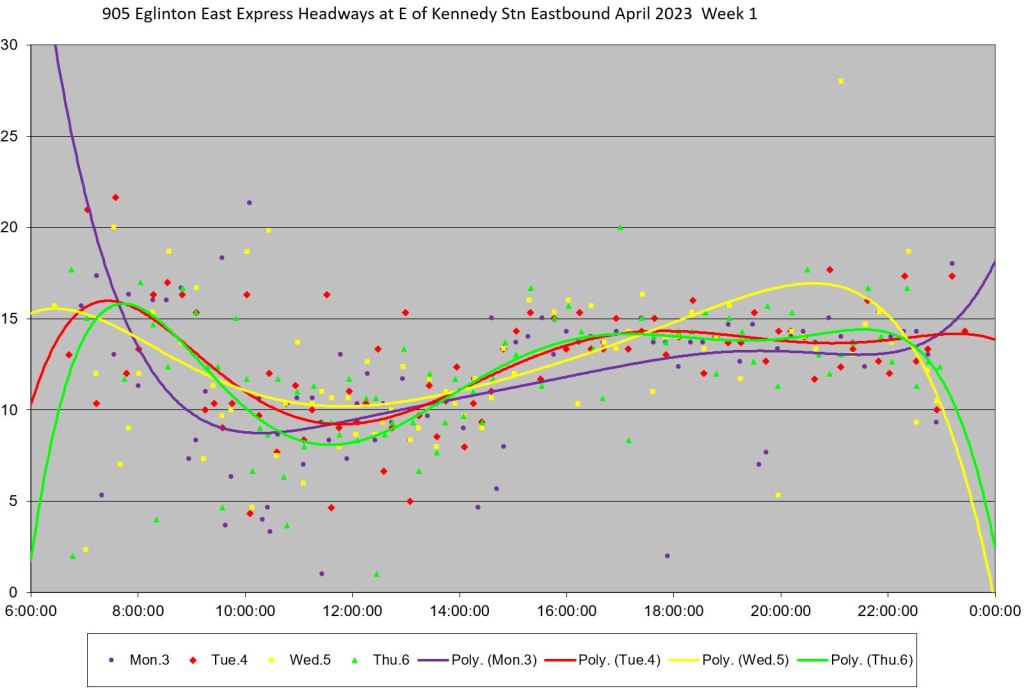
Headways
In the charts below, each month’s data begins with summary hourly stats eastbound from Kennedy Station on the left and southbound from Ellesmere & Morningside on the right. The locations of these screenlines avoid problems with multiple routes near UTSC and the effects of terminal layovers.
Each week’s headway data are presented side by side for the two directions, followed by Saturday and then Sunday data.
There was no statutory holiday in March, but in April, Good Friday fell on the 7th. It is included with the Sunday data.
March
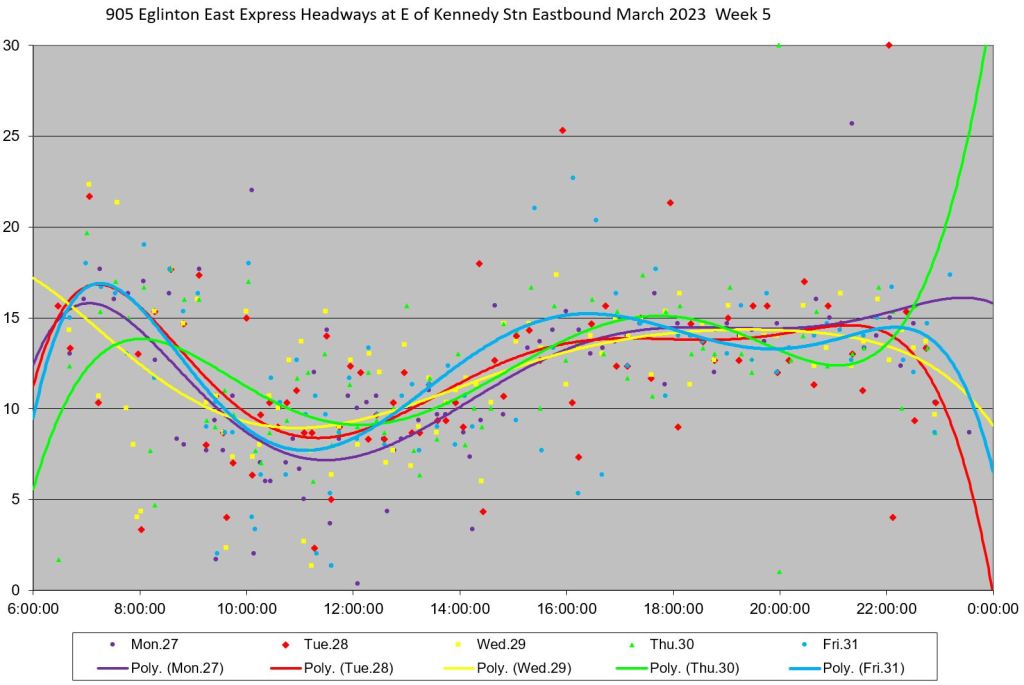
In the March data, note that the average headways are higher in Week 5 (March 27-31) after the schedule change. The Standard Deviations (a measure of the dispersion of data values) are if anything higher with the new schedules than the old (this also shows up in April in the section following). I will examine this in more detail looking at specific days of operation later in the article.
The SD values are noticeable higher inbound at Ellesmere than outbound at Kennedy Station. This will be in part because UTSC is not the terminus for weekday operations even though it is a major stop on the route. “On time” performance is measured by the TTC only at the terminus, Conlins, not at UTSC where departures can be erratic.
Note that the points on the UTSC charts for Weeks 1-4 are more scattered than those on the Kennedy Station charts. This is reflected in the higher SD values. The headway values are scattered over a range from 0 to 20 minutes.
After the schedule change, the headway patterns are different because there is more frequent service at midday than in the peaks, although the difference is more pronounced. The Week 5 headways are badly scattered with values ranging from zero to 30 minutes. This is most definitely not an improvement in reliability even though buses were given more running time on the new schedules. I will turn to that later.


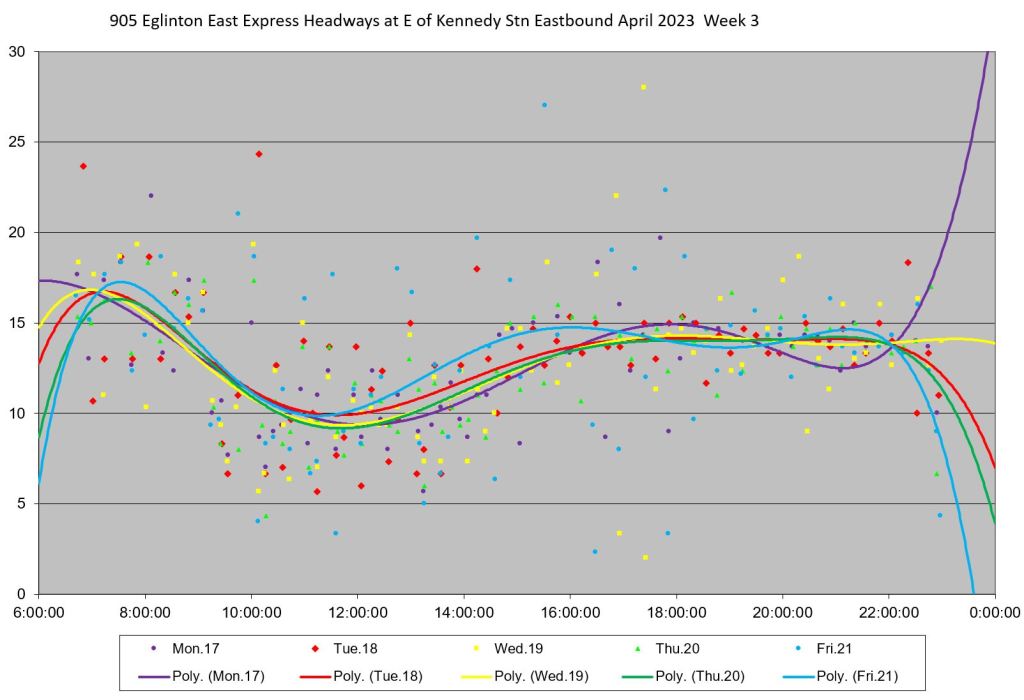
April
In April, the Standard Deviations of headways remain at least as high in Week 5 of March above. With an SD value of five minutes, this indicates that the lion’s share of the headways lie within a 10 minute range. That is considerably wider than the TTC’s 6 minute goal, and it is a swing on a higher base scheduled headway. The service is actually now less reliable than it was in early March.
Service eastbound from Kennedy Station is somewhat less chaotic at certain times than southbound from Ellesmere, particularly in the evenings. However repeated headways close to 30 minutes suggest that either buses are routinely running in pairs, or that a bus is missing. Data for Friday, April 14 show a mix of very long and very short headways indicating that bunching is the culprit, but in some cases there are long gaps with no matching short one and that reveals a missing bus.
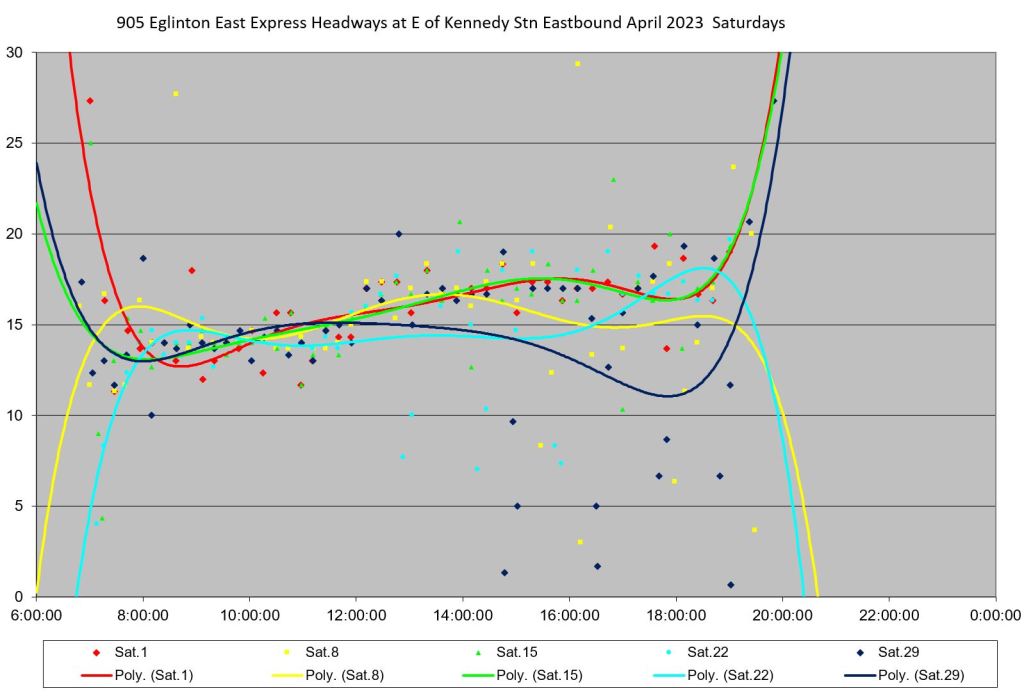
Weekend service shows some oddities I will examine later in the article.
- Saturday service from Kennedy Station is well behaved during the daytime, but not in the evening.
- Service from UTSC is a mess all day.
- Sundays are reasonably well-behaved eastbound, but chaotic southbound.
- There were two extra buses operating on Sunday April 30 producing lower average headways than on the schedule, although they did not run reliably well-spaced with the scheduled service.


Travel Times
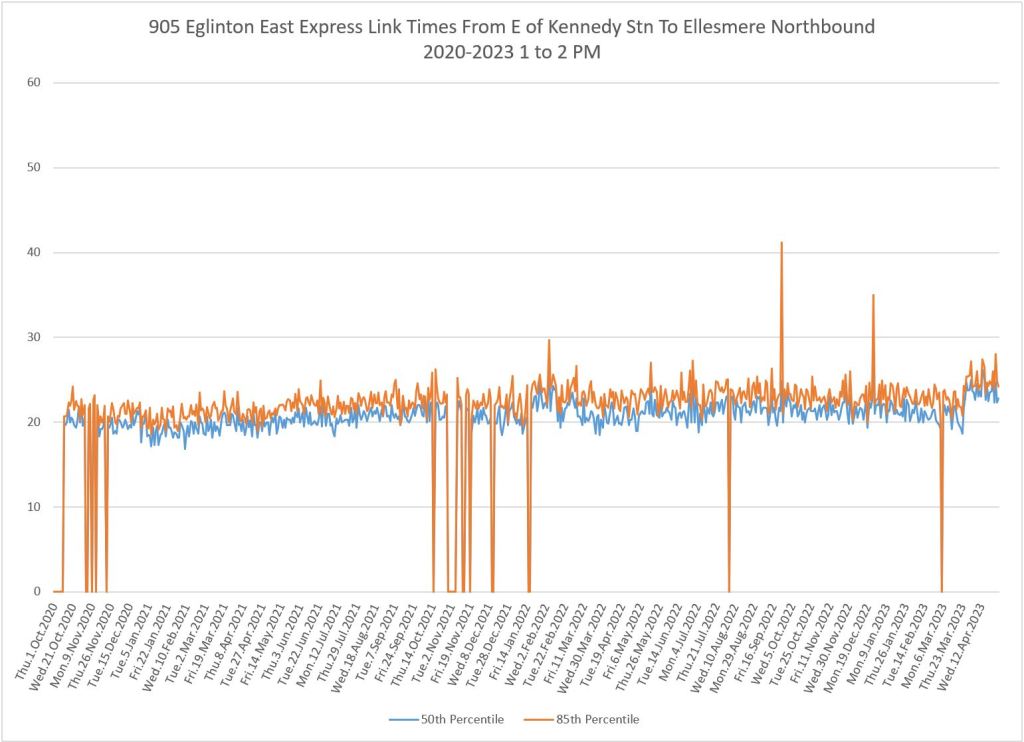
October 2020 to April 2023
From March 2020 onward, there was been a marked downturn in road traffic and transit demand. The road traffic has returned on many corridors, some at a high level than before.
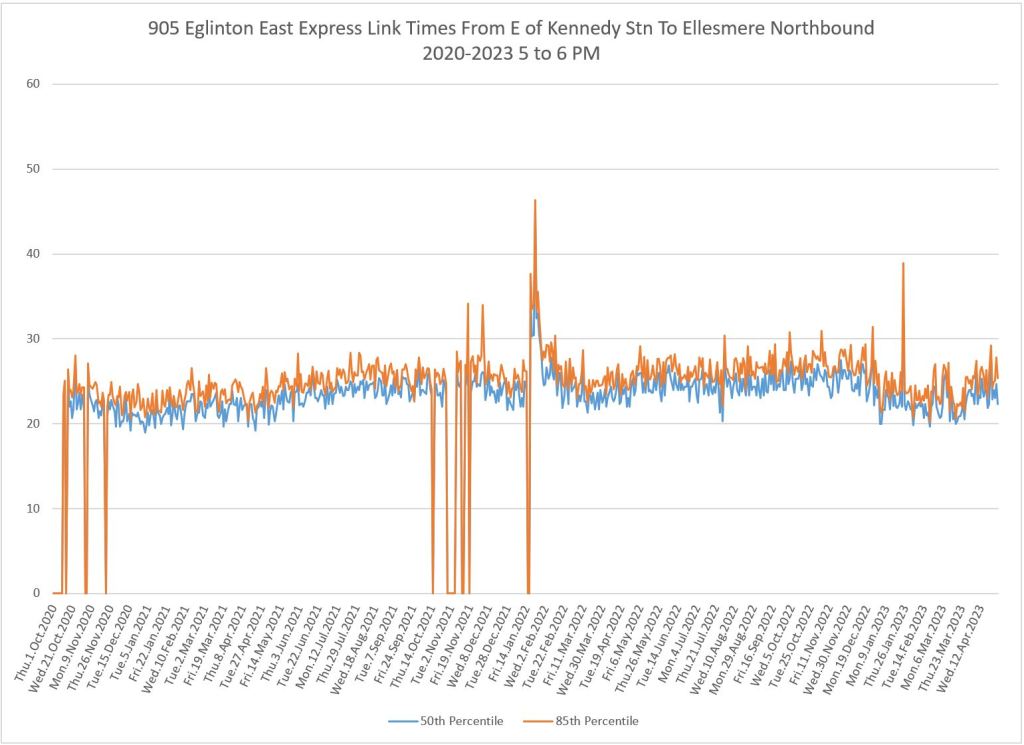
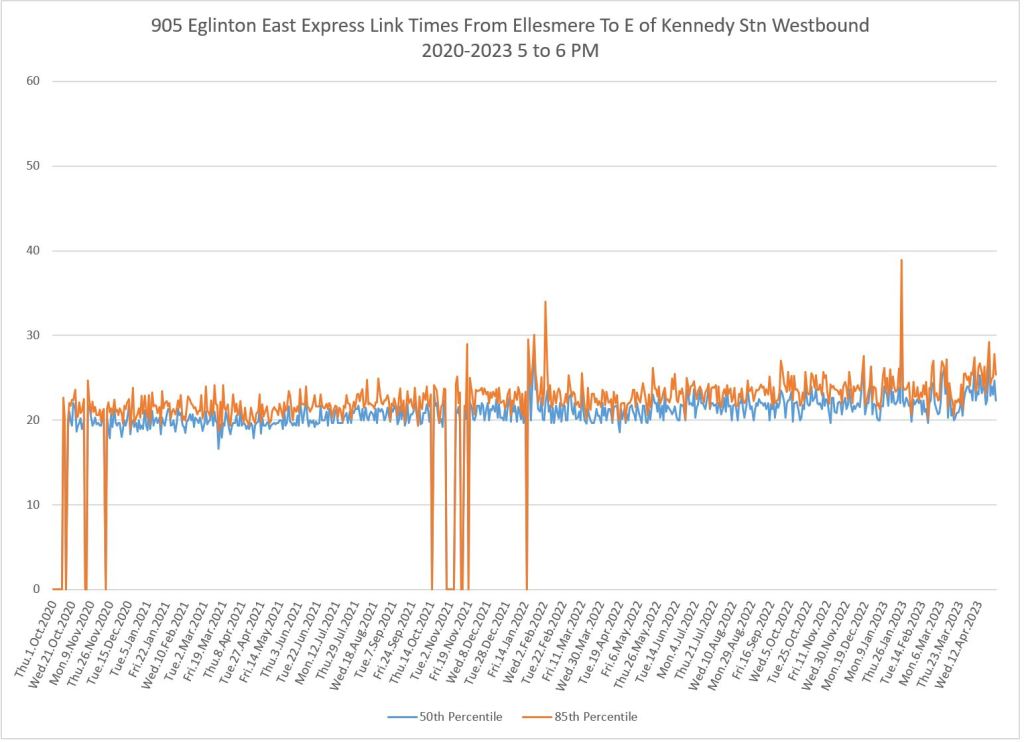
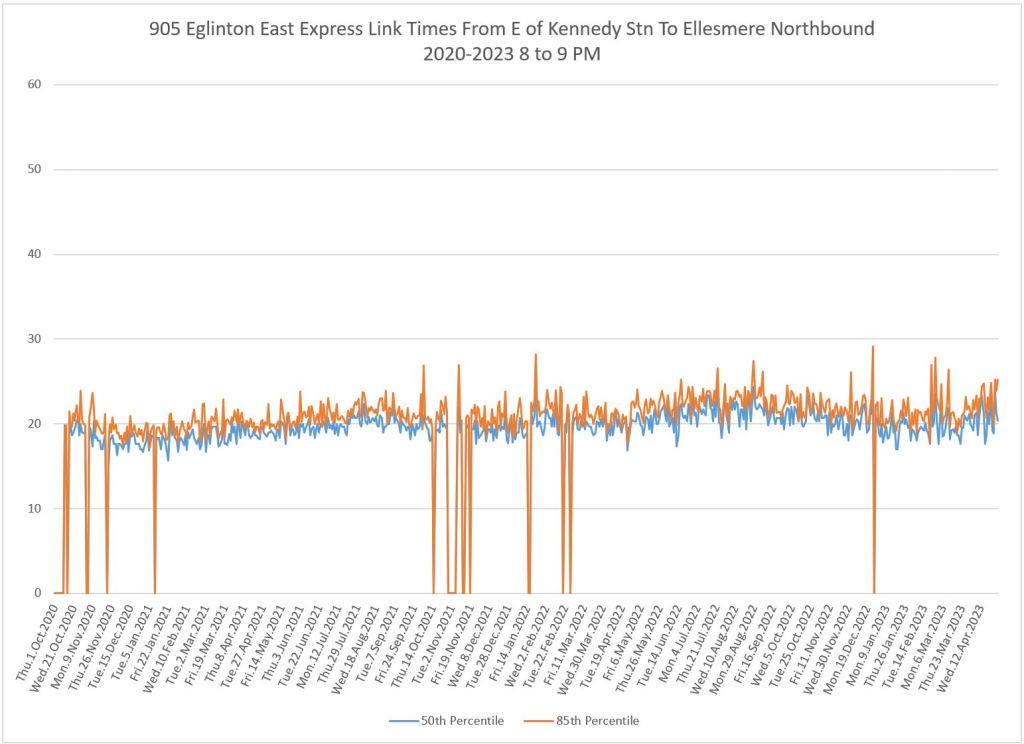
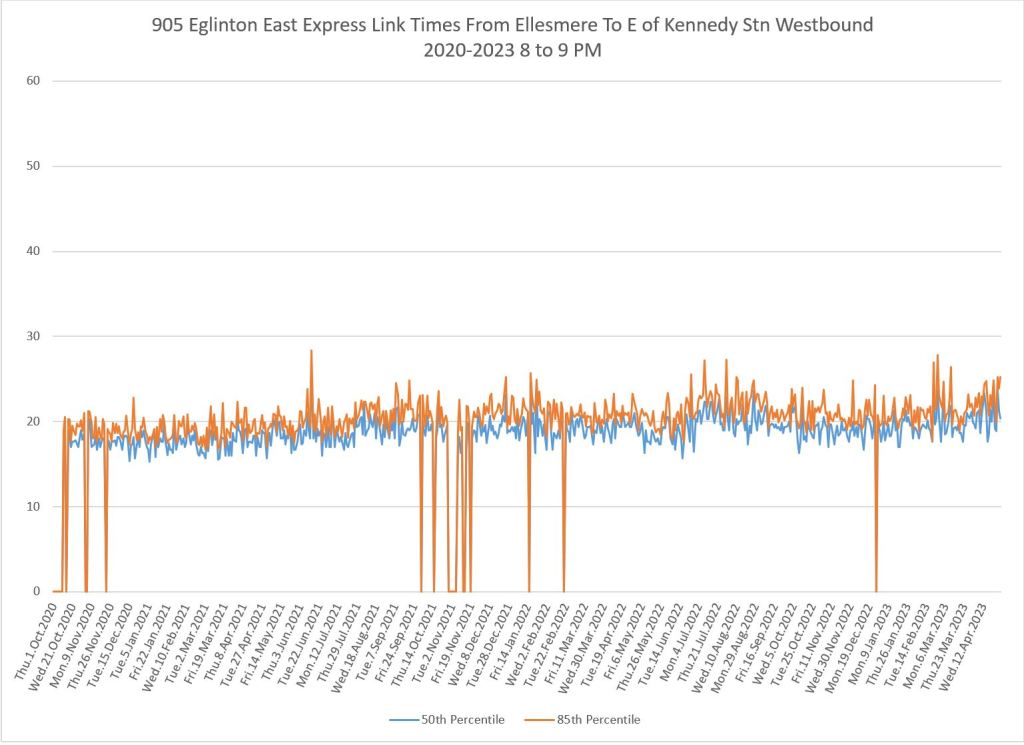
On the 905 Eglinton East, much of the route between Kennedy Station and Ellesmere & Morningside has been covered by RapidTO Red Lanes since October-November 2020. The 50th percentile (median) and 85th percentiles of travel times are shown in the charts below. East/Northbound values are shown on the left while South/Westbound trips are on the right for four hour-long periods covering the AM peak, midday, PM peak and early evening.
Notes of interest include:
- There is a small drop in values in fall 2020 corresponding to the RapidTO rollout.
- There are a few spikes upward corresponding to winter storms. Recovery from these is not immediate suggesting that there is a delay in restoring full road capacity after storms.
- Seasonal drops in travel times are visible each December/January, but moreso in 2021 and 2022 than in 2020.
- Travel times have built gradually over the period although moreso in peak periods than off peak.
- There is a noticeable increase in travel times at the end of March 2023 when new schedules and a change in vehicles to 13m artics came in.
- Cases where the lines drop down to zero are days with no data during the period.


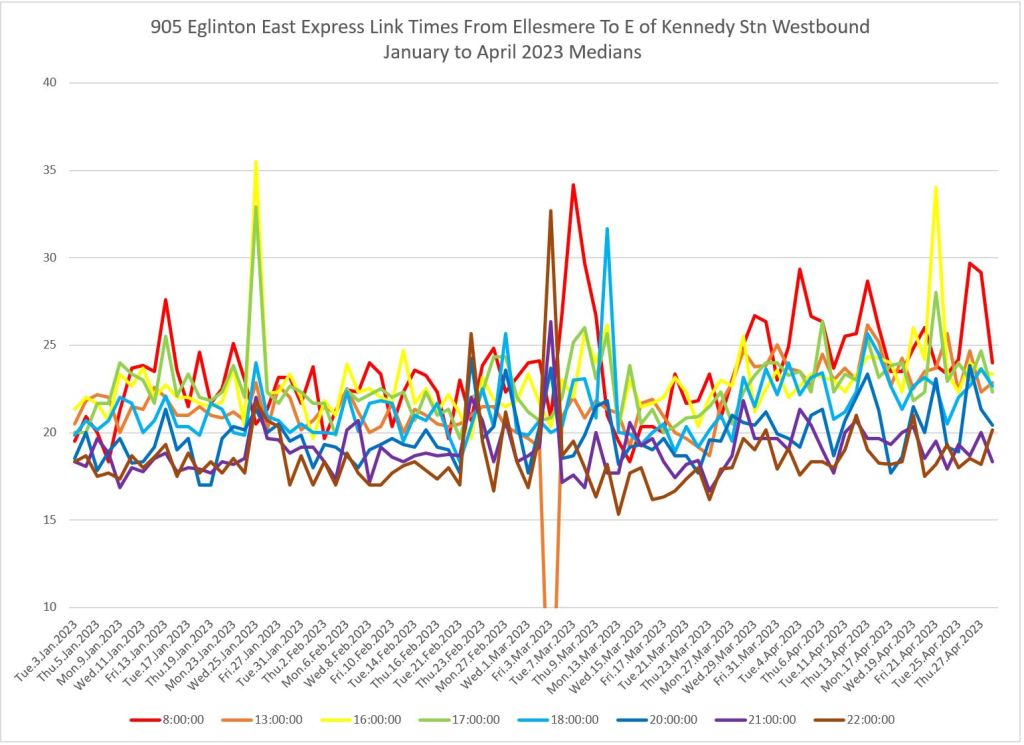
Looking at the data for January to April 2023 shows the rise in travel times with the new schedules and articulated buses in more detail.
- The spikes in January and March correspond to storms.
- Starting on Monday, March 27, the travel times are longer especially for the AM peak (red) through to the early evening. Later in the evening, times do not change.
The longer travel time is likely due to increased stop service time with larger buses serving more riders at stops, probably still with front door loading.

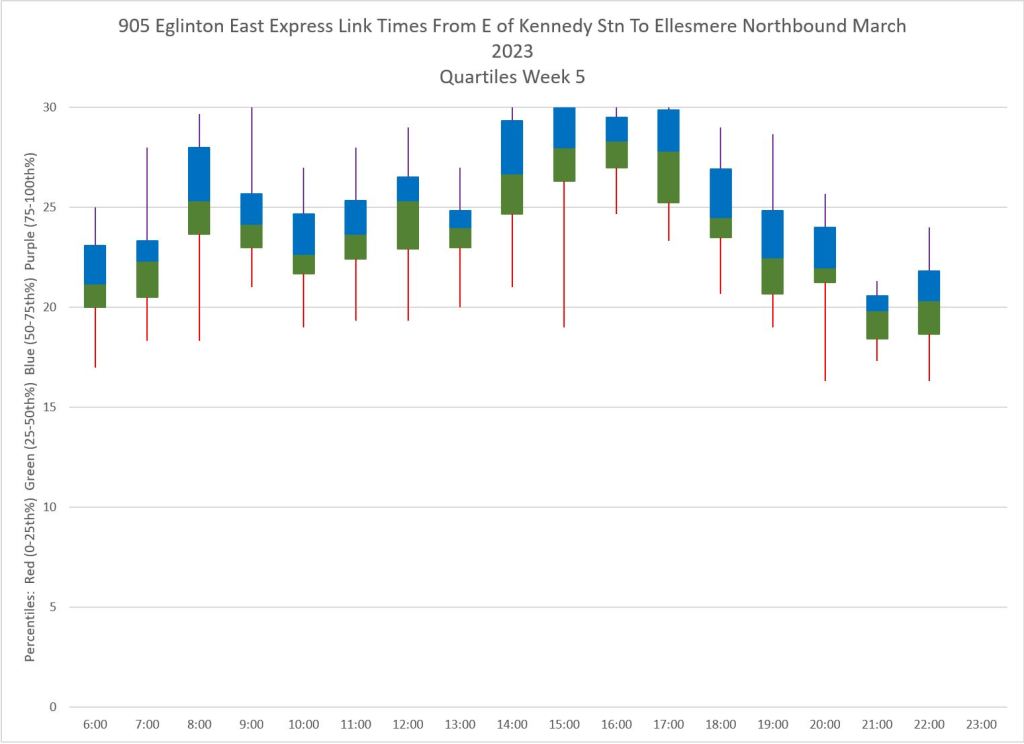
This can be seen another way in block-and-whisker charts showing the quartiles of travel times in Weeks 4 and 5 of March 2023. East/Northbound data are on the left, West/Southbound data are on the right. Week 4 (old schedule) is in the first line, Week 5 (new schedule in the second).
It is quite clear how the travel times have changed in value with the new schedules and larger vehicles.


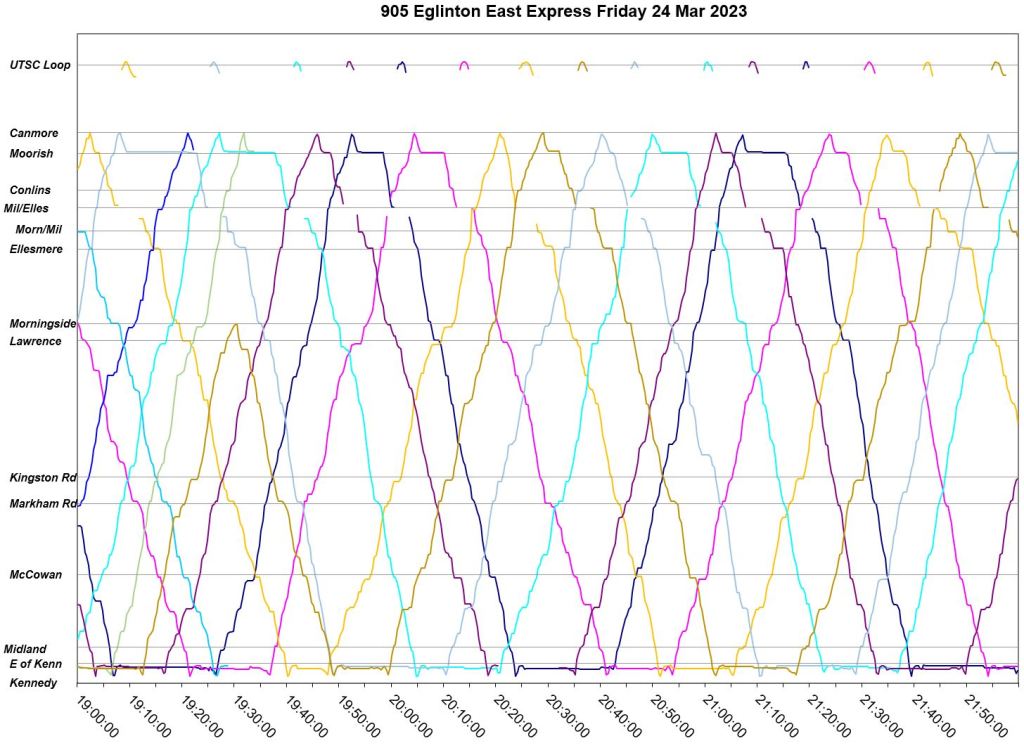
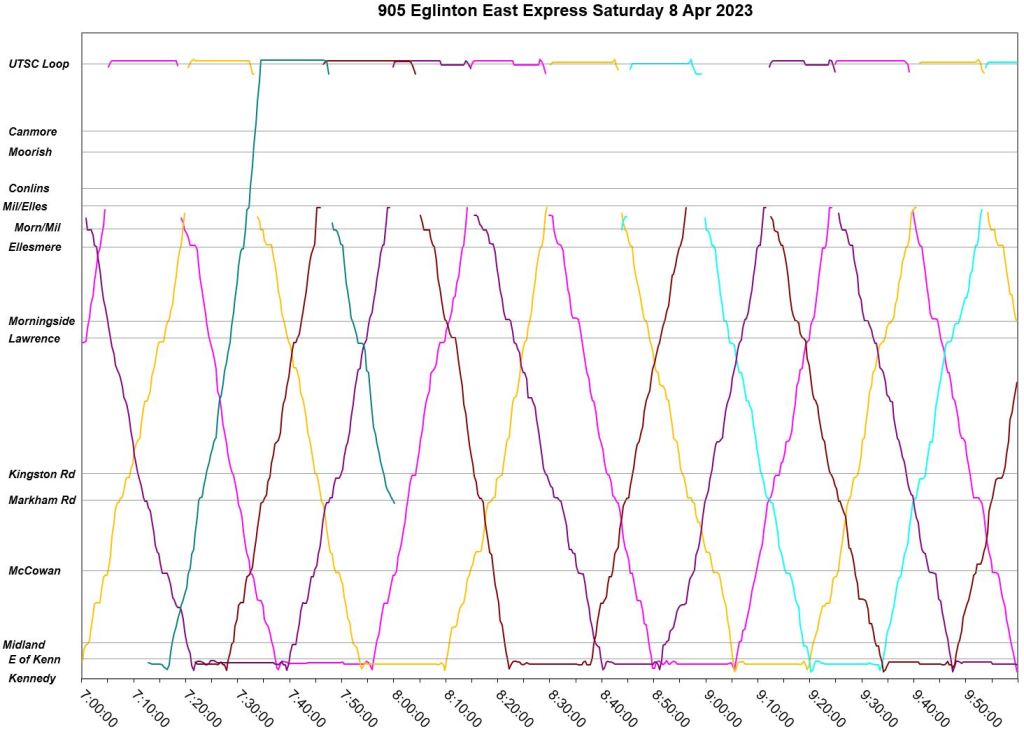
Daily Operating Details
A few notes about these charts.
- Each line travelling up and down the charts represents one vehicle. The horizontal position is time starting at 7:00 am and running to the end of service weekdays, and from 7:00 am to 7:00 pm on weekends.
- Horizontal lines indicate major locations along the route with Kennedy Station at the bottom and the eastern termini at the top. Due to the complex route geometry around UTSC, I have given that loop its own small area at the top of the charts. Some discontinuity in the lines is caused by buses “jumping” from one chart segment to another.
- Vehicle speed is relative to the slop of the lines. The more vertical, the faster; the more horizontal, the slower. A straight horizontal line is a bus that is not moving.
- Headways are indicated by the relative spacing of lines. When they are close together, service is bunched.
- Short turns are evident where the trace for a bus does no go all the way to the end of the route, but turns back at an earlier location.
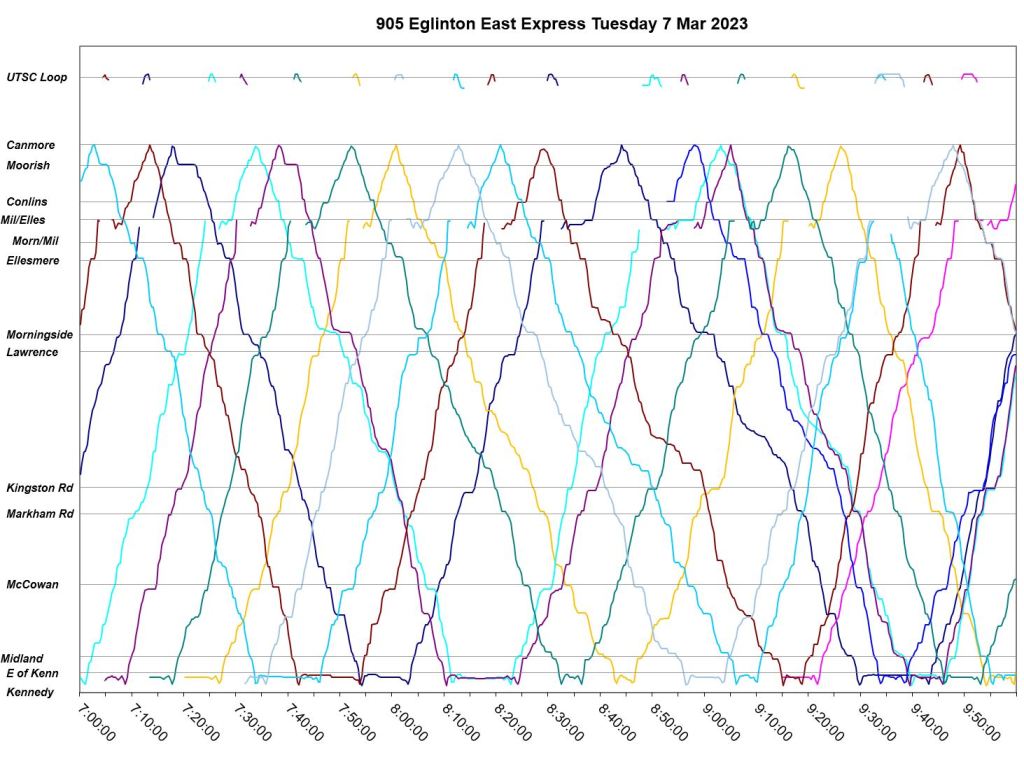
Tuesday March 7
Congestion on March 7 does not have much effect on speed except during the late AM peak westbound approaching Kingston Road.
Some vehicles run bunched for an extended period with bunches of two or three buses common through the day. There is a half-hour gap eastbound from Kennedy Station from 7:10 to 7:40 pm where four buses arrive and lay over, and there is an echo of this gap westbound although one bus does short turn back at Morningside at about 8pm. Service continues to bunch through the evening.


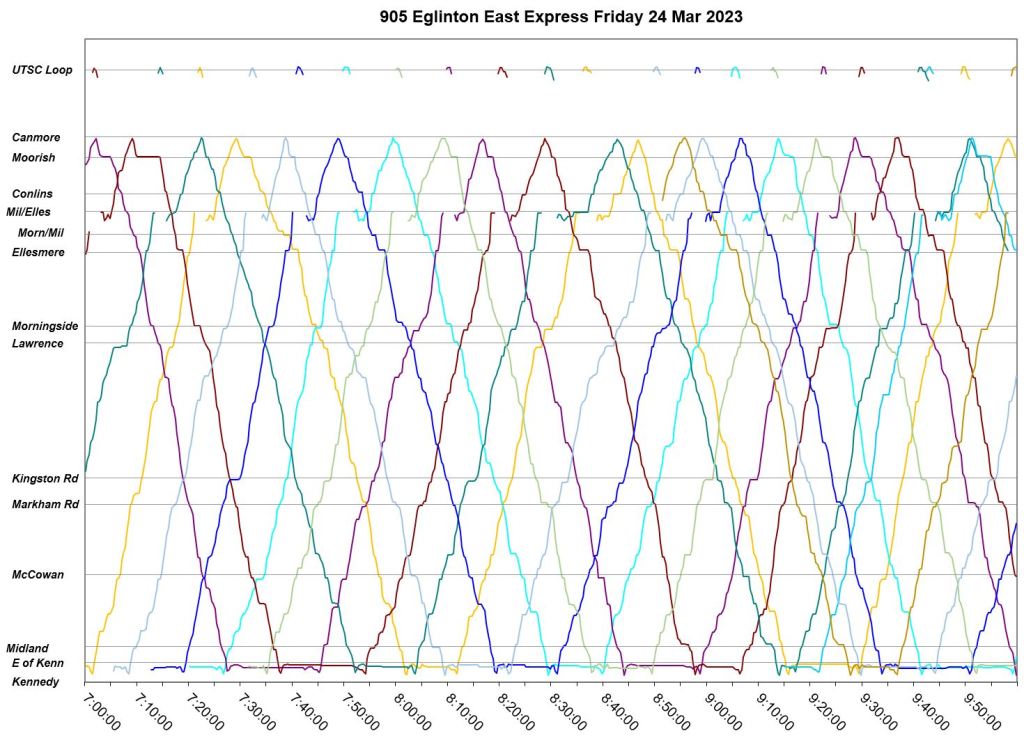
Friday March 24
Service during the morning is well-behaved, but by midday bunching appears. However, where vehicles do pair up, the spacing is corrected leaving the terminus on their next trip. Some bunching is evident through the afternoon, but it is not as severe as on March 7 above. By the evening service settles down to fairly even headways.


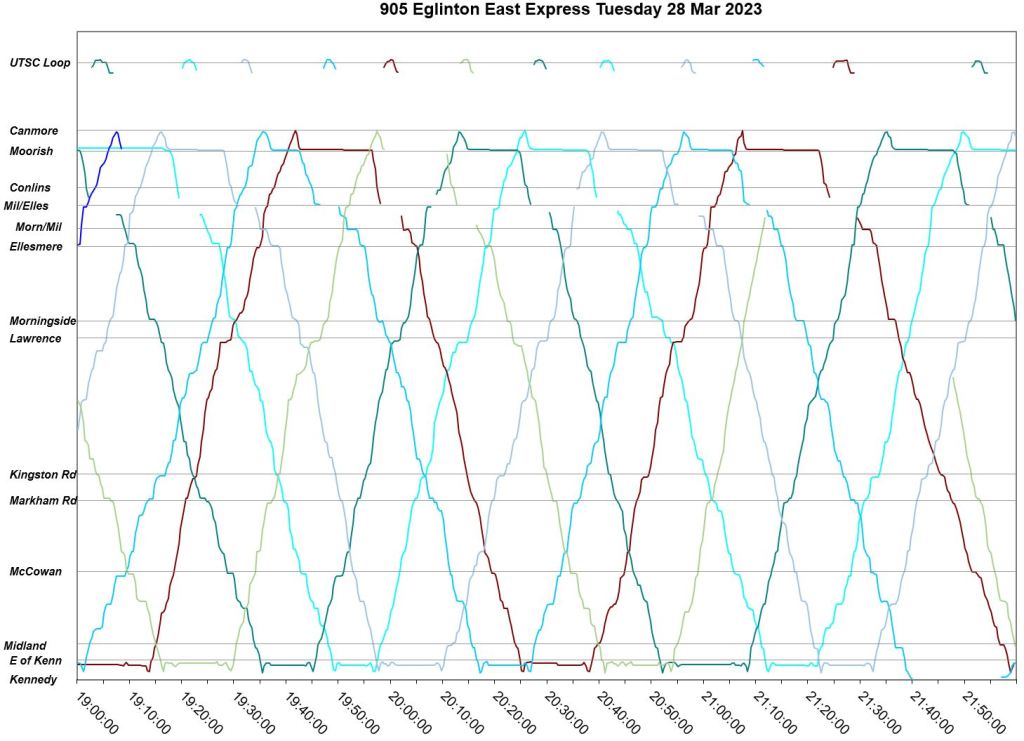
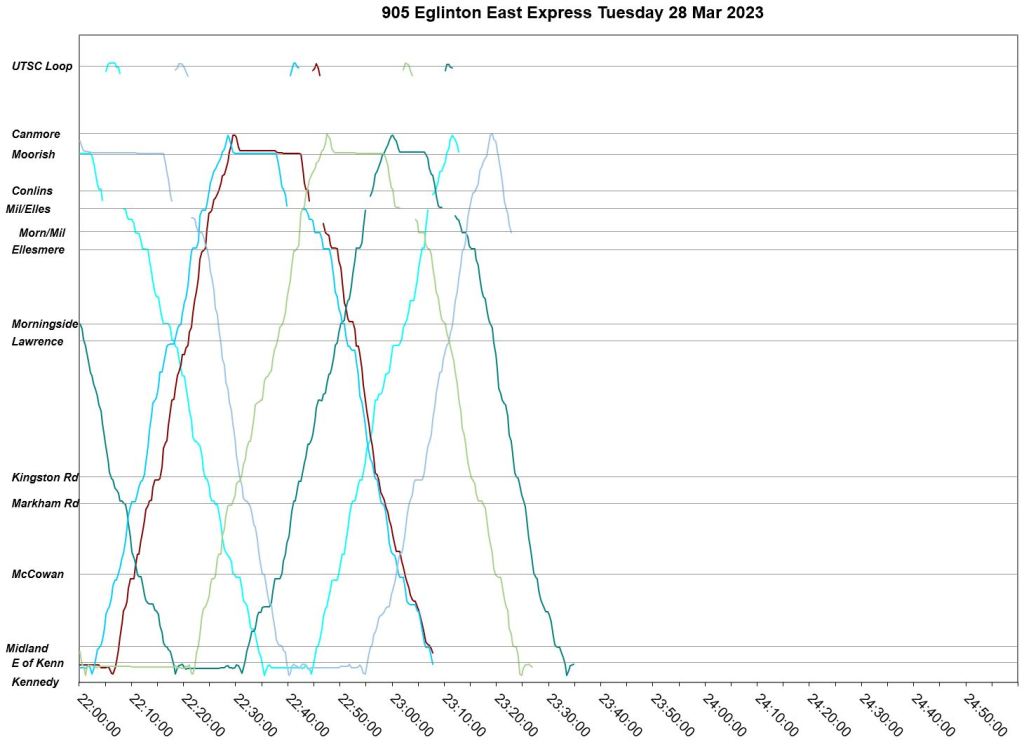
Tuesday March 28
March 28 was the second weekday of operation with the new schedules. Bunching is visible starting in the AM peak and continuing through the afternoon. The effect of the added running time is visible in the longer layovers buses take at the termini. In theory, this should allow them to depart on reliable headways even when they arrive as a pair. However, it is also possible for a pair to arrive, lay over and depart together. This is not the intent of “recovery time” in schedules.


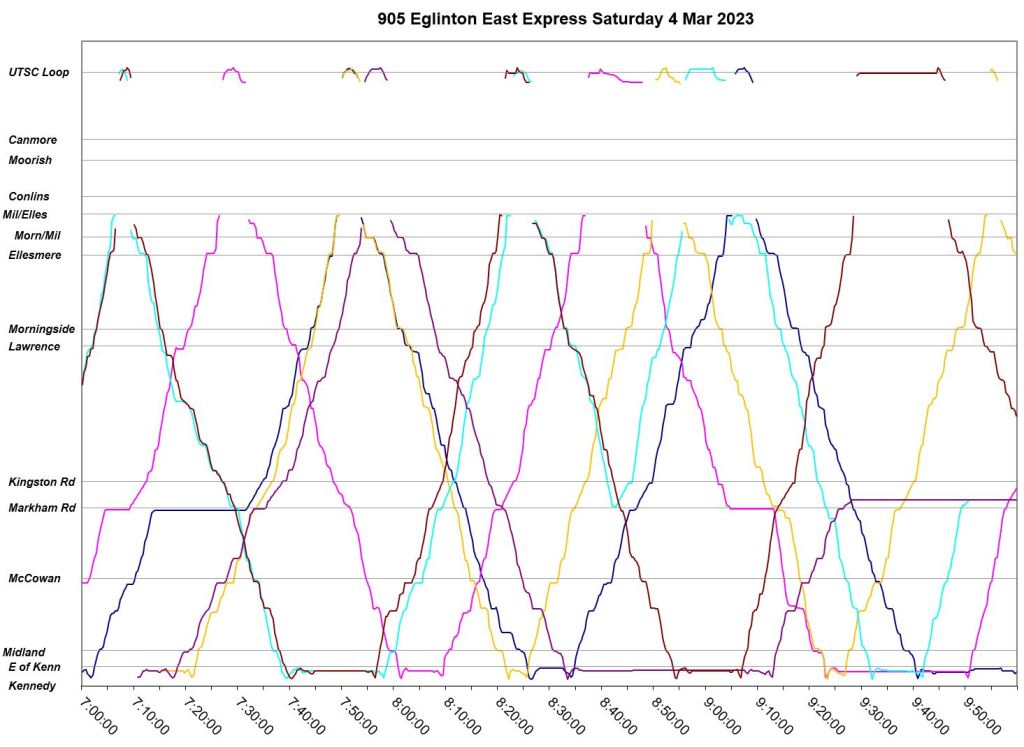
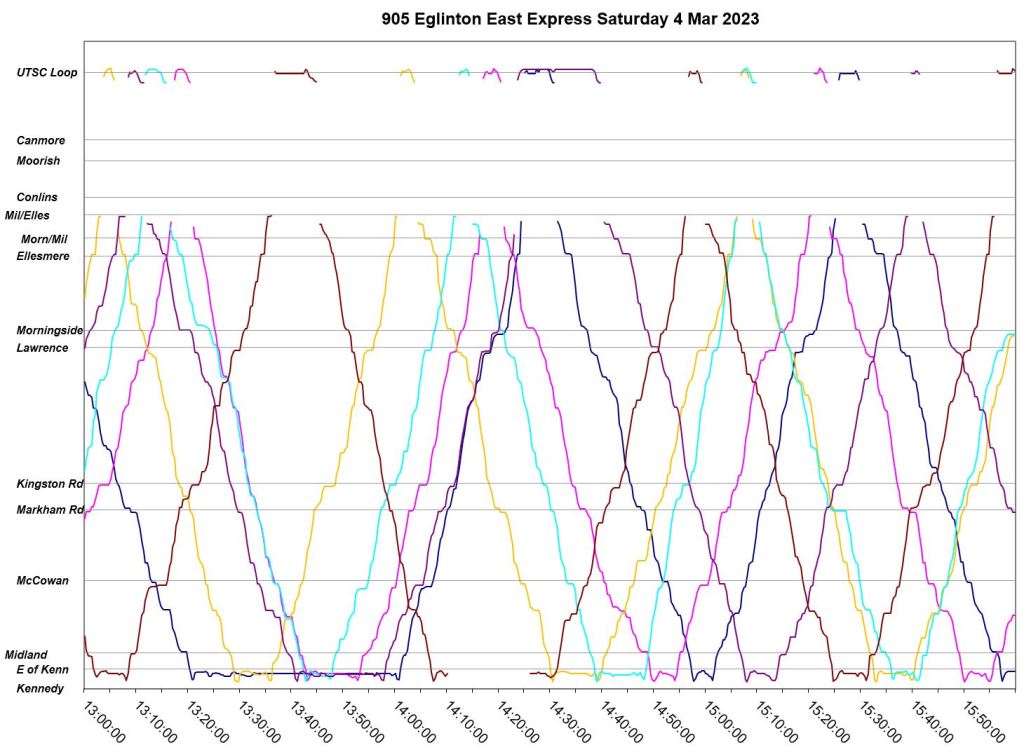
Saturday March 4
On weekends, the Conlins Road branch does not operate, and so all buses turn at UTSC. Bunching and wide gaps are common through the day. There is almost no congestion evident here.


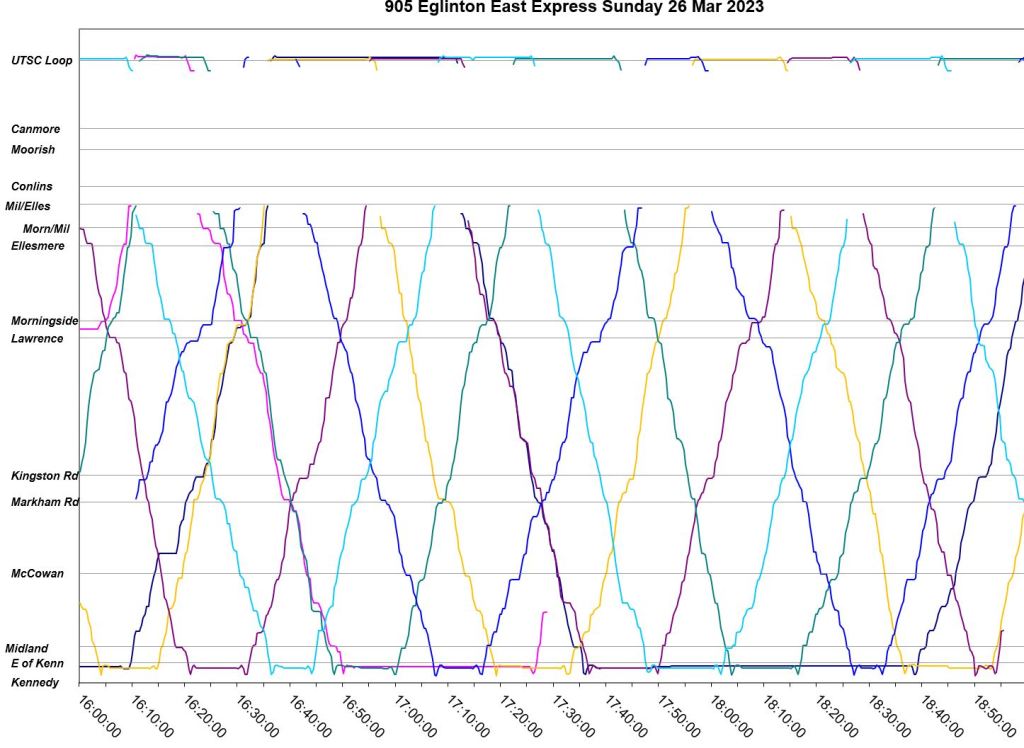
Sunday March 26
March 26 was the first day of operation on the new schedules. There is no congestion all day, and buses get generous layovers at both terminals. However, they do not leave evenly spaced in many cases. This appears to be due to three extras operating in addition to the scheduled service.
A perverse effect of adding recovery time to schedules is that it can encourage late departures after long layovers because operators knows that they can get back on time for the return trip easily.


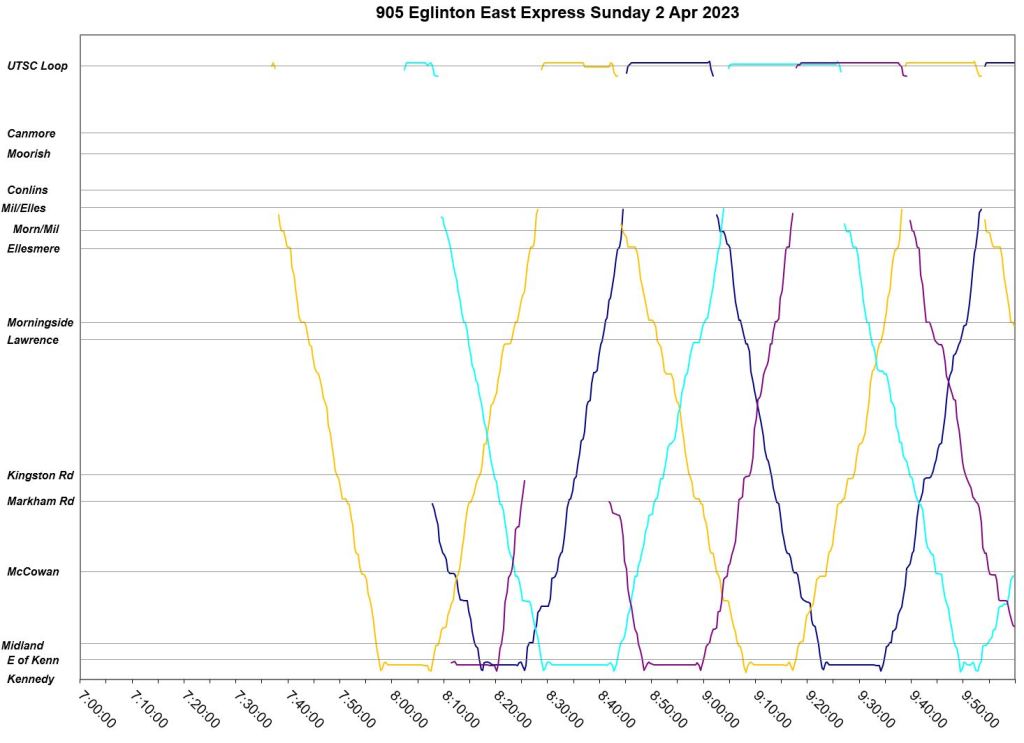
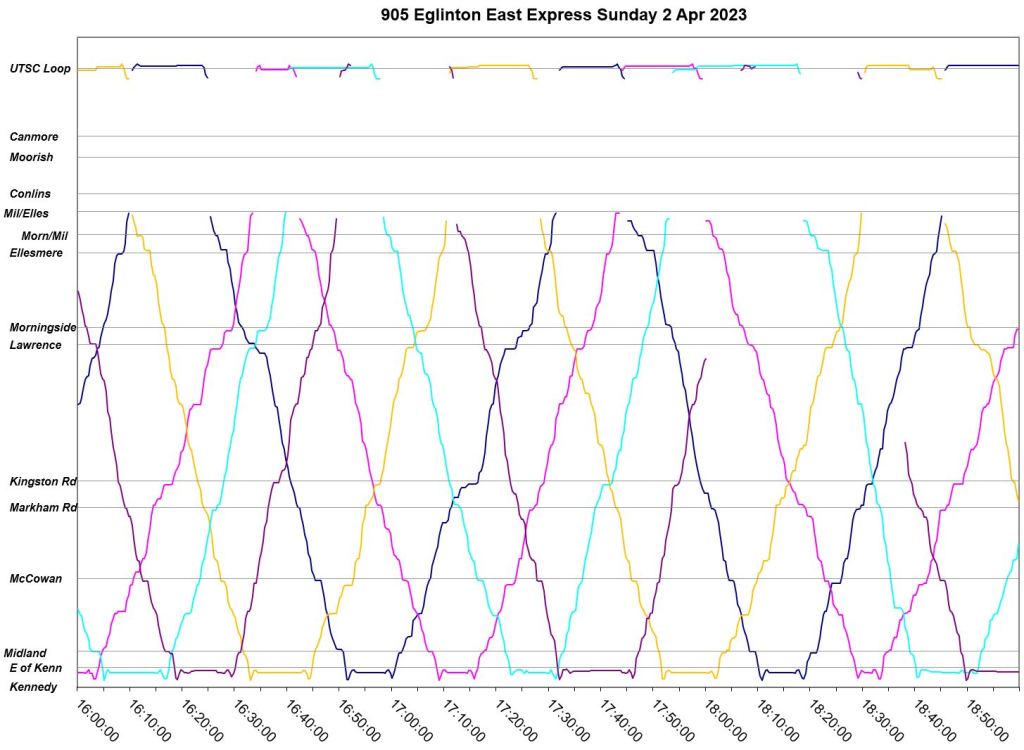
Sun Apr 2
On April 2, one week later, the service operates reliably, but there is no sign of extra vehicles beyond the five scheduled.


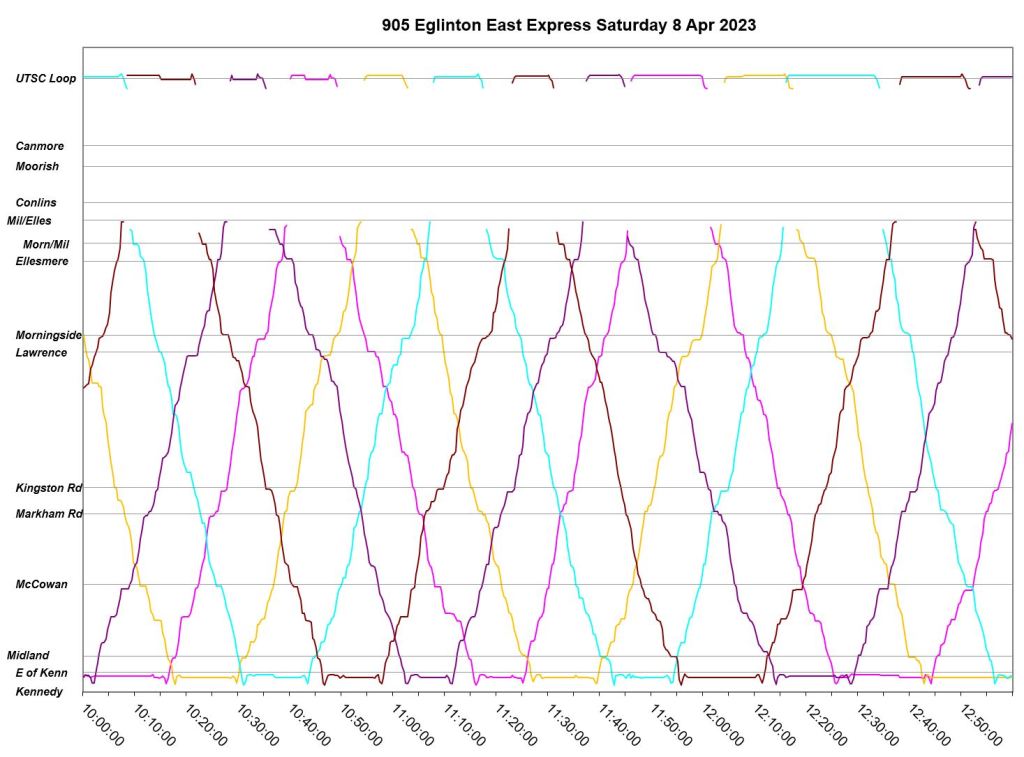
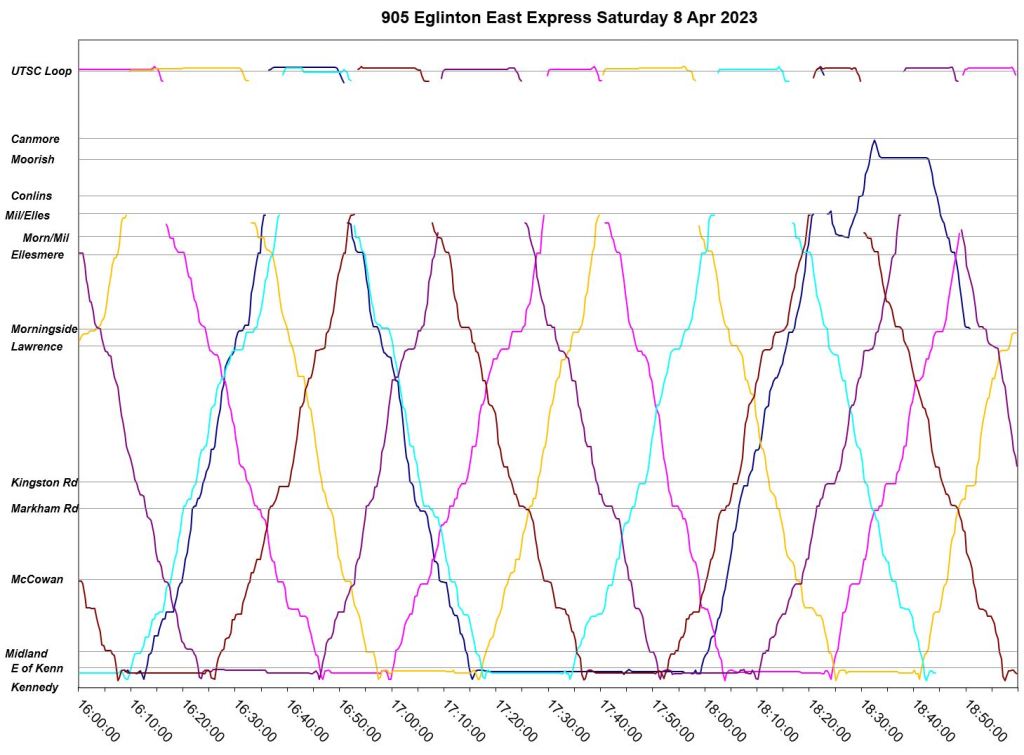
Sat Apr 8
On April 8, the service is well-behaved until late afternoon when some bunching appears due to an over-long layover at Kennedy Station (3:50 to 4:10 pm, in turquoise, below).

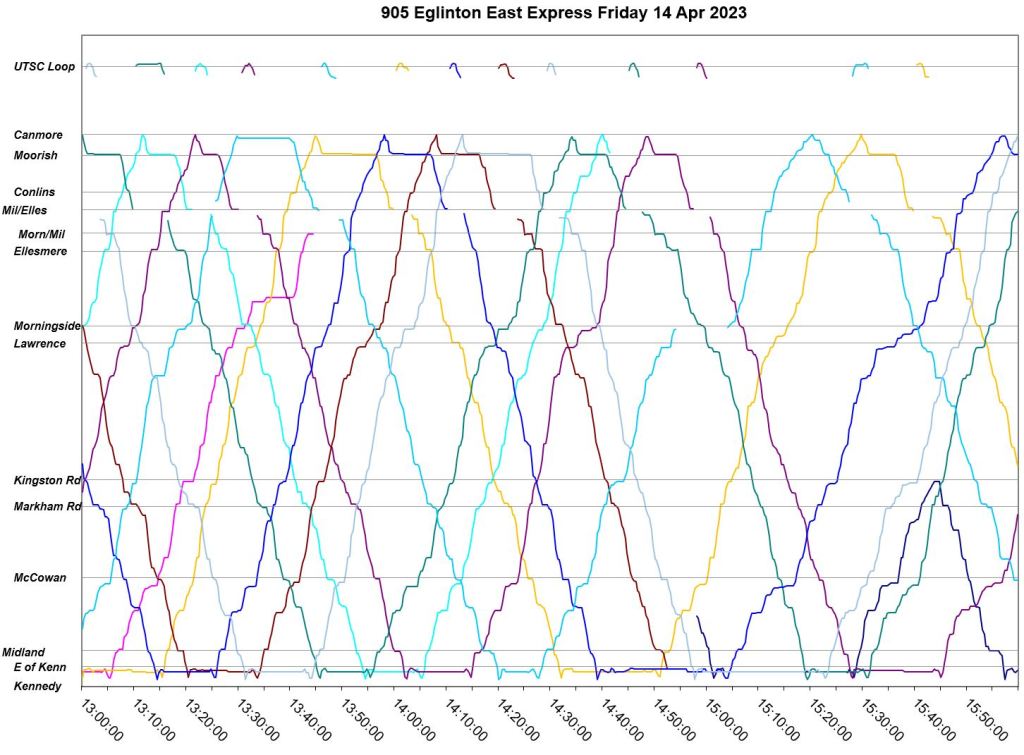
Friday April 14
On April 14, there is a large gap, over an hour, in service from Kennedy to UTSC with a comparable echo of the gap westbound during the AM peak. Service remains somewhat disorganized through the midday, but becomes badly bunched by the PM peak and early evening.
This is an example of the problems of running larger vehicles on wider headways. When they run in pairs (or worse) the resulting gap is proportionately longer than with standard sized buses.


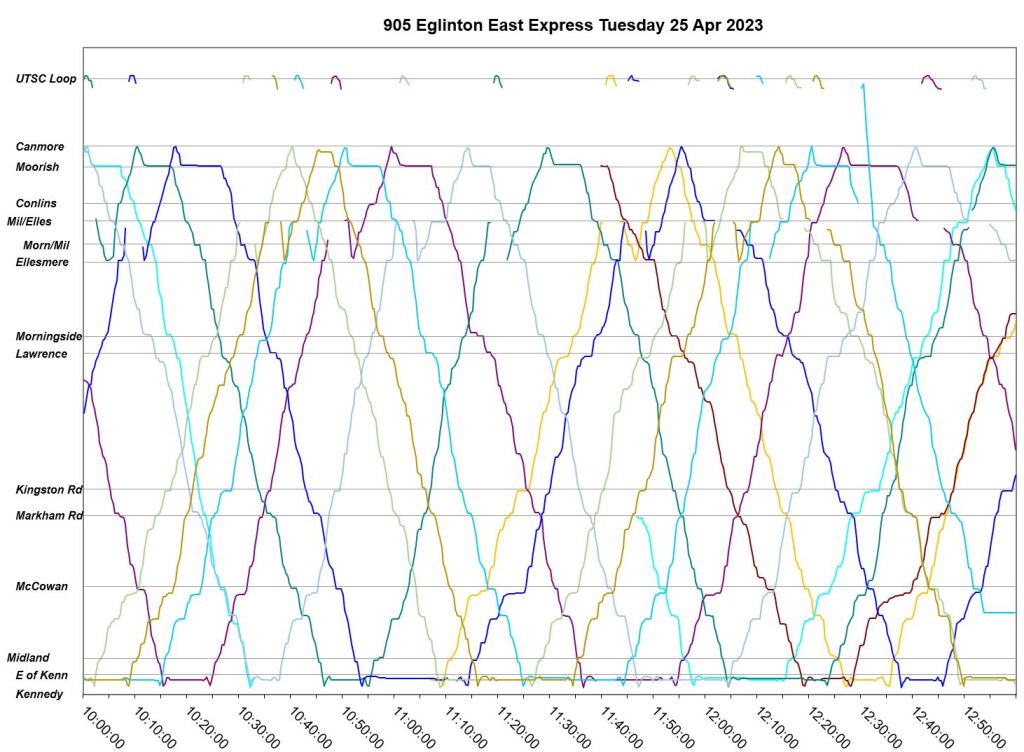
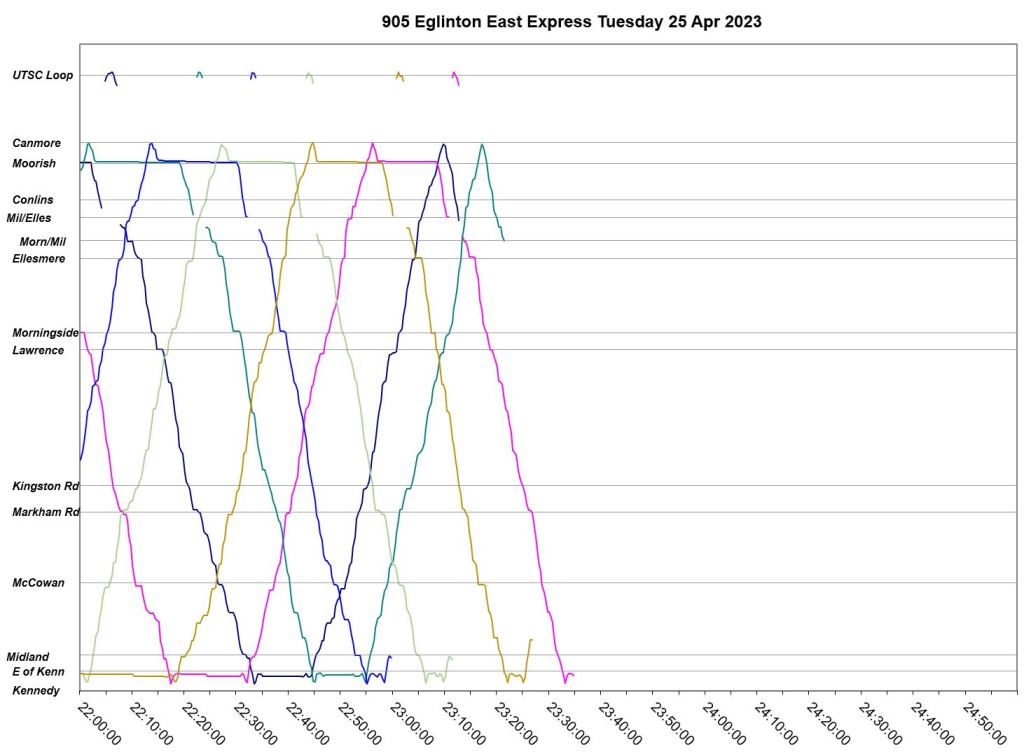
Tuesday April 25
April 25 is better behaved than April 14 with only a small amount of bunching. However, one bus disappears from service westbound shortly after 3pm leaving a gap that is not filled until a new bus appears eastbound at about 5pm.


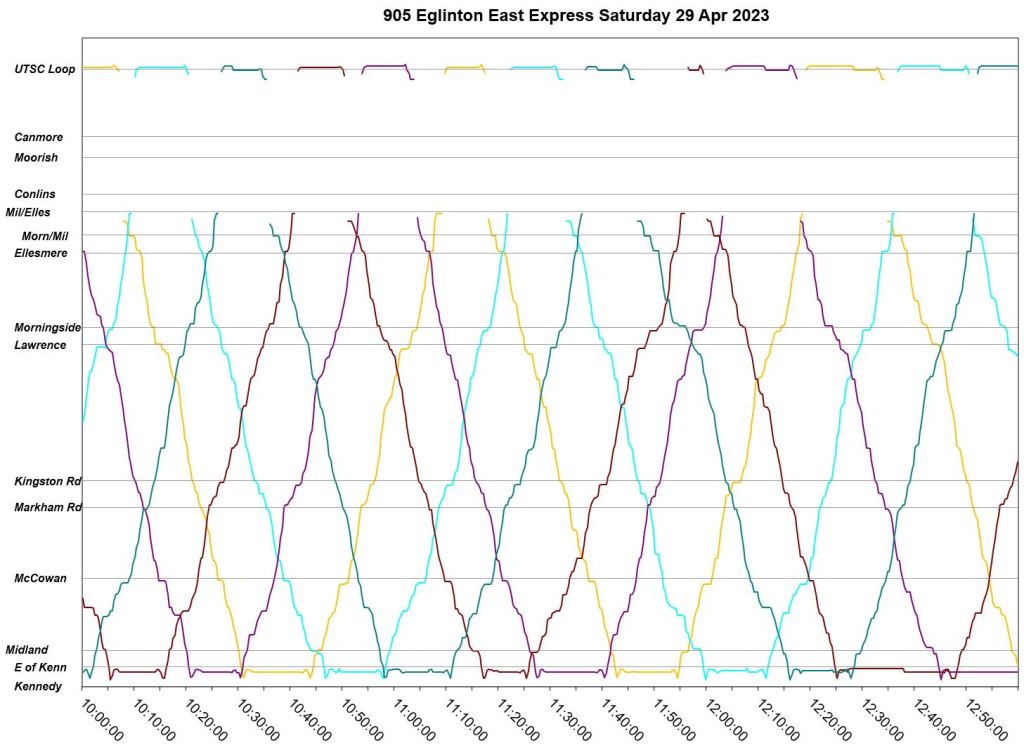
Saturday, April 29
On both April 29 and 30 (below), extra service was operated in addition to the scheduled runs. However, these buses tended to form bunches with the scheduled service as is evident below from the early afternoon onward.


Sunday, April 30


Extra 13m Buses
In addition to the scheduled service, tracking data shows additional 13m buses in service on route 905 from March 26 onward. The chart below shows how many were tracked on each day. Note that they were not all necessarily in service at the same time or for the full day.

So which division drives this route now? Malvern or McNicol. I know the 905 was out of Birchmount & they don’t have artics.
Steve: Malvern.
LikeLike
Just a small correction. Bus lengths are 12m (40ft) and 18.5m (60ft), rather than 10m and 13m that you mentioned.
Steve: I will fix that. I do not know where those numbers numbers came into my head. Thanks.
LikeLike