
The October 2022 CEO’s Report has been posted on the TTC’s website. Although most of the charts in this edition run only to the end of August, the ridership and crowding chart data extends to the end of September. The two charts below show how strongly ridership improved between the summer and fall periods.
At the end of September, bus demand on weekdays rose to 75 per cent of pre-pandemic levels, while streetcars sat at 55 percent and the subway at 63. The difference reflects the weak return of demand in the core area which is served by streetcars and the subway.
The TTC reports that in pre-pandemic times, post-secondary students and office workers represented 22 and 38 per cent, respectively, of total demand. Downtown offices were about one-third full in mid-September.
In the chart below, note that although the streetcar portion (green, hiding behind the boxes with values) has not widened very much and sits roughly at summer levels. The green stripe sits higher because the bus (red) and subway (blue) portions of the bars have grown.
How long this will persist is difficult to project. Anecdotal observations from my own travels on streetcars give the sense that demand was up in October, but the actual stats will not be out for another month.
Another factor whose effect is hard to judge is the many construction projects that remove streetcar service, or interrupt it with bus replacements. Some trips might never be taken, or might travel via a different route served by buses. The streetcar system will not be back to “normal” until early 2023, and there is always a lag between loss of ridership and recovery as would-be users discover that service has improved. Although the TTC plans a campaign to lure riders back, there has to be something worth riding.

Another measure of demand is the rate of bus occupancy at various levels. This is measured with Automatic Passenger Counter data. The streetcar fleet does not yet have APCs installed on all vehicles, and so comparable stats for the streetcar routes are not available. (Note that this chart goes back to January 2020 whereas the chart of boardings above only begins in April 2022. Earlier boarding figures are available in older CEO reports.)
An overall observation here is that in the absence of a major new wave triggering reduction in travel, the chart shows a consistent growth. Even the dip in mid-2022 is a typical seasonal decline and the September data continue the trajectory of Spring 2022 numbers. This is for the bus network, and a comparable trajectory does not necessarily apply to other modes as shown in the boarding counts above. Crowding numbers can also be affected by service levels, although there has not been a major jump in service that would dilute the occupancy numbers.
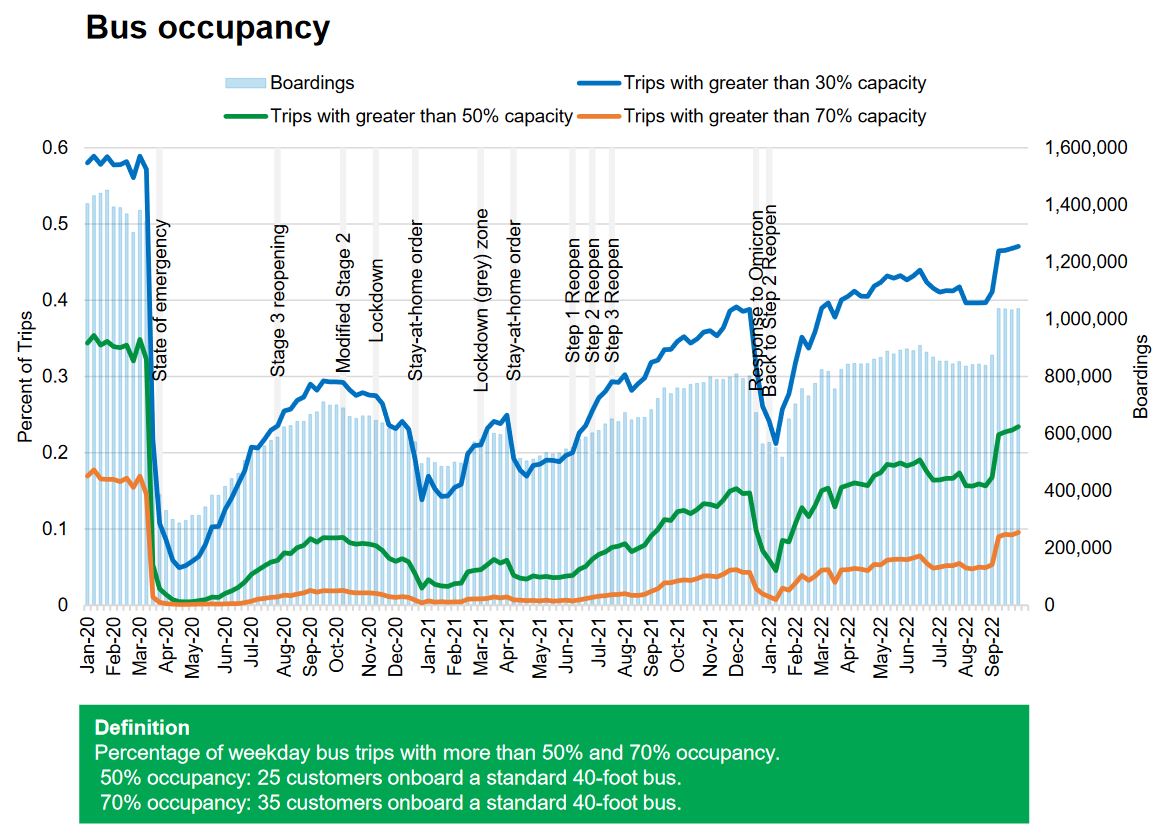
Particularly striking here is the big jump in trips above 70% capacity which are now about 10% of total trips, and a similar large jump in trips above 50% capacity to about 23% of total trips. This reflects a demand growth that is greater than the rate of capacity growth.
The TTC observes:
While crowding has increased in line with boardings demand heading into September, the continued growth in high-occupancy bus trips suggests demand is growing more concentrated around a number of key trips.
TTC CEO’s Report, October 2022, p. 27
As the busy routes become more crowded, more riders will see a crowded bus even though the majority of trips will still be uncrowded. The perception of crowding will be greater than the overall average value. This is an inevitable situation on a transit system where demand is not evenly spread in time or place on the network.
However, if the stats are misinterpreted or misrepresented by those looking for “efficiency”, the problem is that the capacity from emptier trips cannot always be reallocated. Some routes have strongly directional demand, and will always be lightly loaded in the counter-peak direction. Those trips, however, are an integral part of the route even though they can pull the “average” load down.
In an extreme example, if a bus is at 100% capacity travelling east and 0% going west, the “average” says that only half of the one-way trips are crowded. Obviously one cannot have the eastbound trips without the westbound returns. Real routes are more complex, but this shows how simplistic analysis can lead to dubious conclusions.
Some routes have lighter demand, but still meet the TTC’s Service Standards for boardings per bus hour. They might never accumulate a full load and therefore appear to be targets for service cuts. However, in the process the service becomes less attractive and ridership can fall further.
A critical factor will be service reliability which, as I have documented at length elsewhere, leaves much to be desired notwithstanding TTC metrics that purport otherwise. Some crowding is a direct result of bunched and missing vehicles which create gaps and heavier loads than evenly spaced service would.
The City faces a large operating deficit both for 2022 and projected for 2023. To what extent this will result in limits on TTC service and a move to improve “efficiency” with more riders per bus remains to be seen.
