
A challenge both for someone like me who wants to analyze service “as operated” as well as for riders, and even for the TTC, is to track the hundreds of “Run as Directed” (or “RAD”) vehicles (mainly buses) in the system.
During the Covid pandemic, the TTC opted to cut back on scheduled service on many routes and run unscheduled extras to be used when and where required depending on demand. Their name for this is “demand responsive” service.
The idea is good as far as it goes, but it has produced many problems:
- Internally, most of the vehicles are associated with a “route 600”. More accurately, that is where the drivers’ crews are. However, when one of these buses goes into service there are problems.
- The driver does not “sign on” to the route they are serving, and so a RAD bus running on Steeles West does not show up under the route 60 tracking data.
- Because the bus is not associated with a scheduled run, NextBus does not know what to do with it, and the bus does not appear in projections of vehicle arrivals. A RAD bus might be just around the corner, but riders will not see it on transit service apps.
- From a service tracking point of view, the vehicle hours are not charged against the route where the bus operates (which could be several in the course of a shift).
There is a further problem with the tracking data in that a bus “dead heading” to or from service (or even between RAD assignments) looks exactly the same as one that is serving passengers on a route.
The TTC is aware of these problems, and hopes to enhance its tracking system, VISION, to compensate. Current plans are for more regularly scheduled service to return by February 2021, subject to budget issues, and the number of RAD vehicles will decline.
I have been working with TTC IT folks to figure out a data extract from their VISION system that will allow visualization and reporting on the RAD buses. The charts in this article are a first step and are provided for those who are interested.
Methodology
All of the tracking records from VISION include a route and run number. The run number is associated with a specific vehicle (although this could change during the day) and is displayed in the front window of vehicles so that they can be identified by Route Supervisors on the street. The run number ties a vehicle to a specific schedule.
RAD vehicles do not transmit route and run numbers, and this shows up as “NULL” in the data extracts. As an initial test, I requested a few hours’ worth of data including every vehicle to see what the overall pattern might be.
Many vehicles report no route/run number and this arises from various circumstances:
- The vehicle is in the garage or maintenance depot, and constantly transmits the same (or similar) GPS co-ordinates.
- The vehicle is enroute to or from service, but is not “signed on” to a specific route.
- The vehicle is in service as a RAD.
Of these, the vehicles sitting in garages are easy to eliminate by geofencing, that is by eliminating any data points that lie within the geographic bounds of any garage.
RAD buses can be stationary for long periods awaiting an assignment.
The other two situations, as noted earlier, cannot be easily distinguished in the data.
One of the “regular” services provided by RAD buses is the subway shuttles. Therefore, any report of RAD service needs to account for buses that are covering a subway route, not supplementing service on a surface route.
For my analysis, I filtered out data corresponding to garage/carhouse locations and to Hillcrest shops.
The Charts
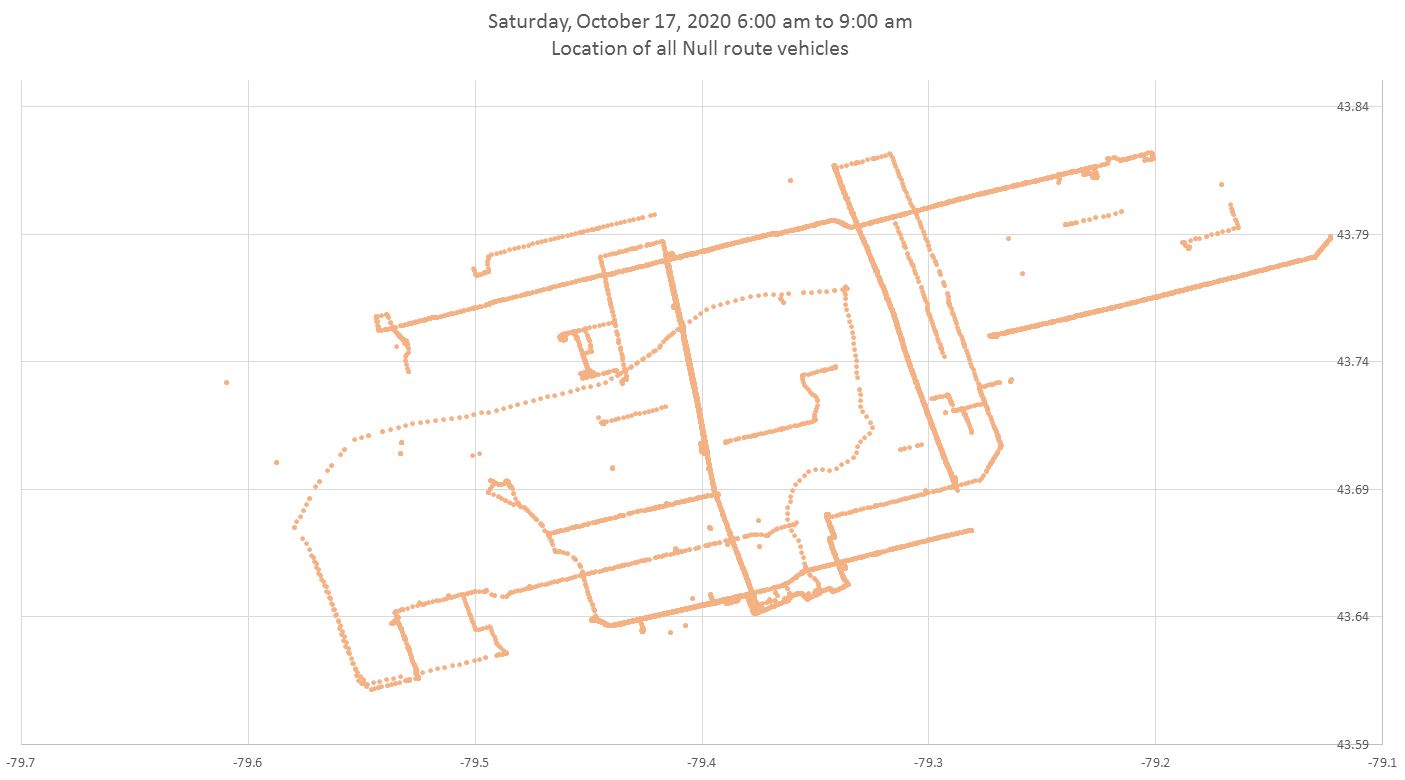
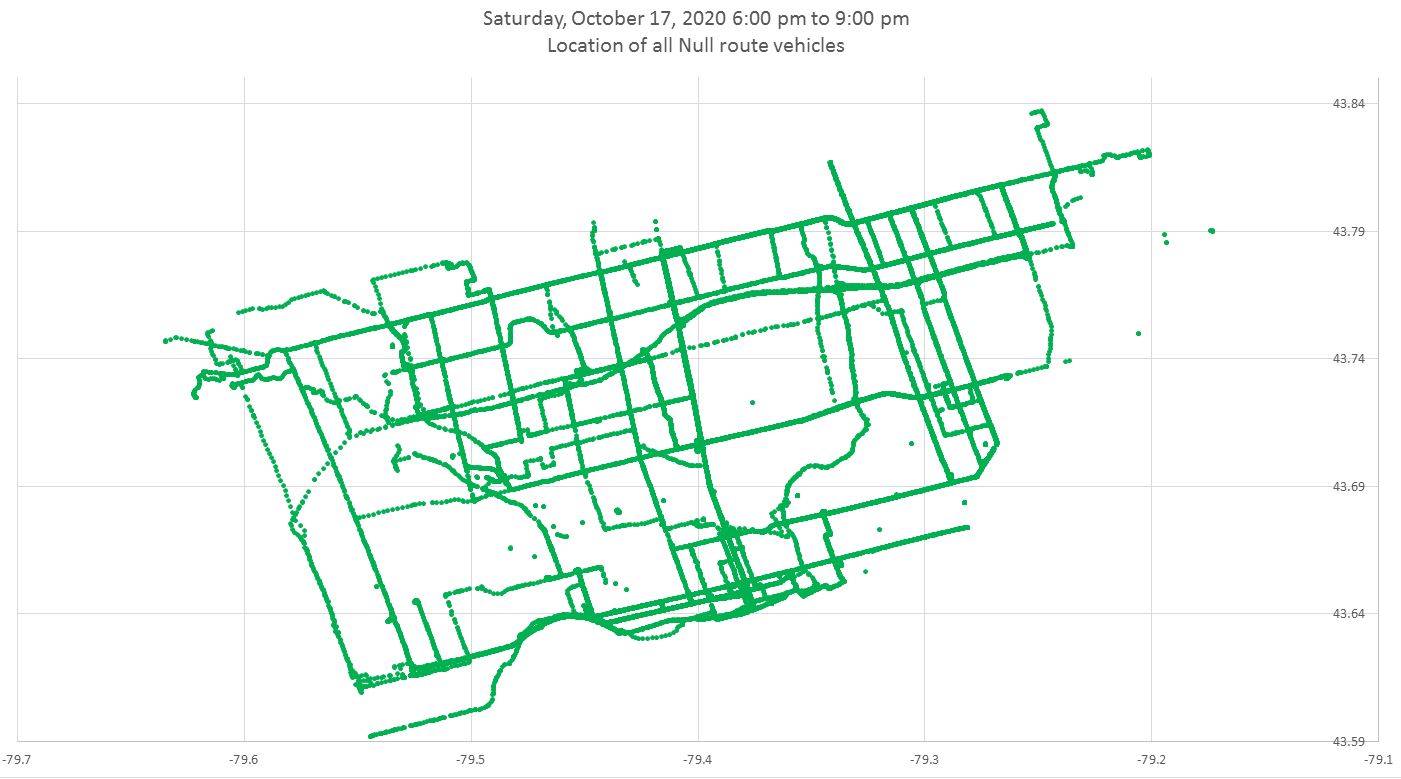
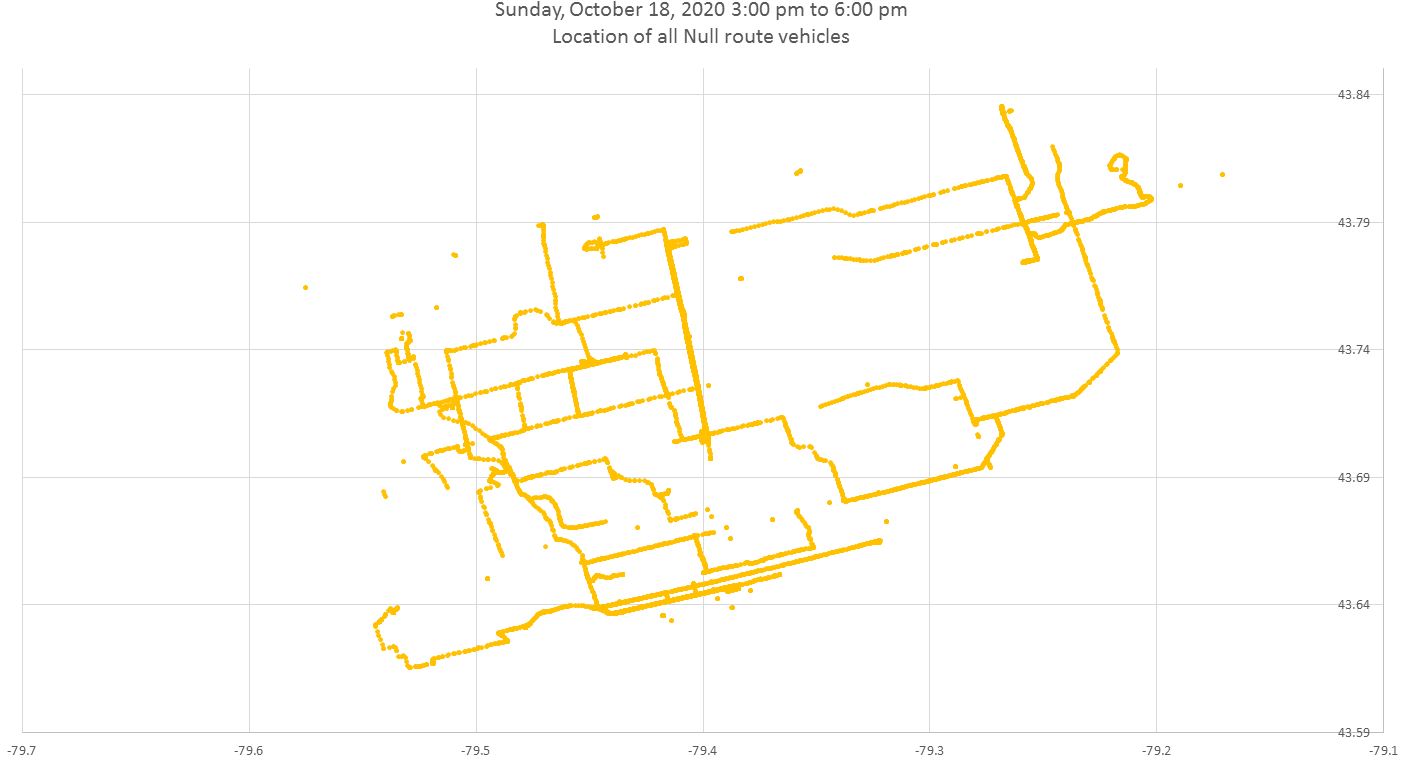
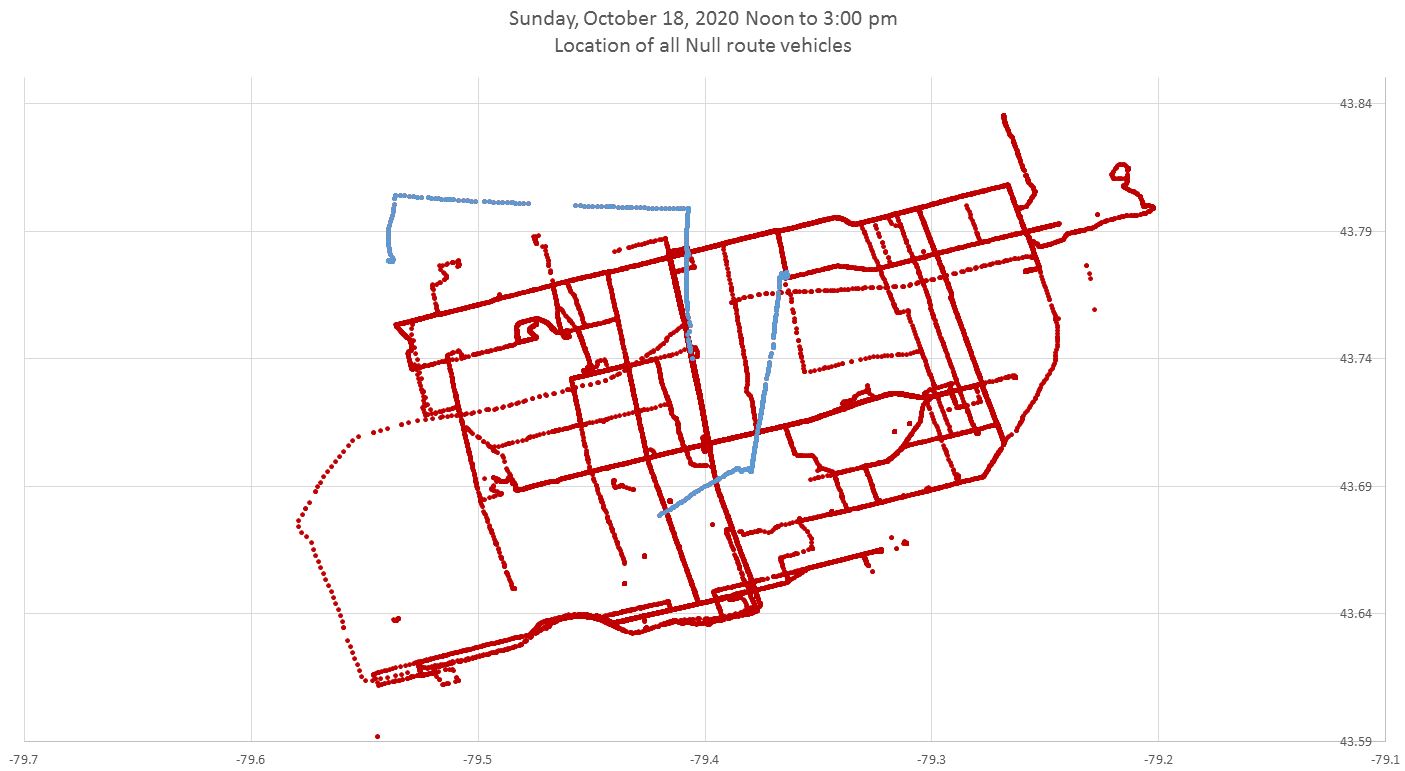
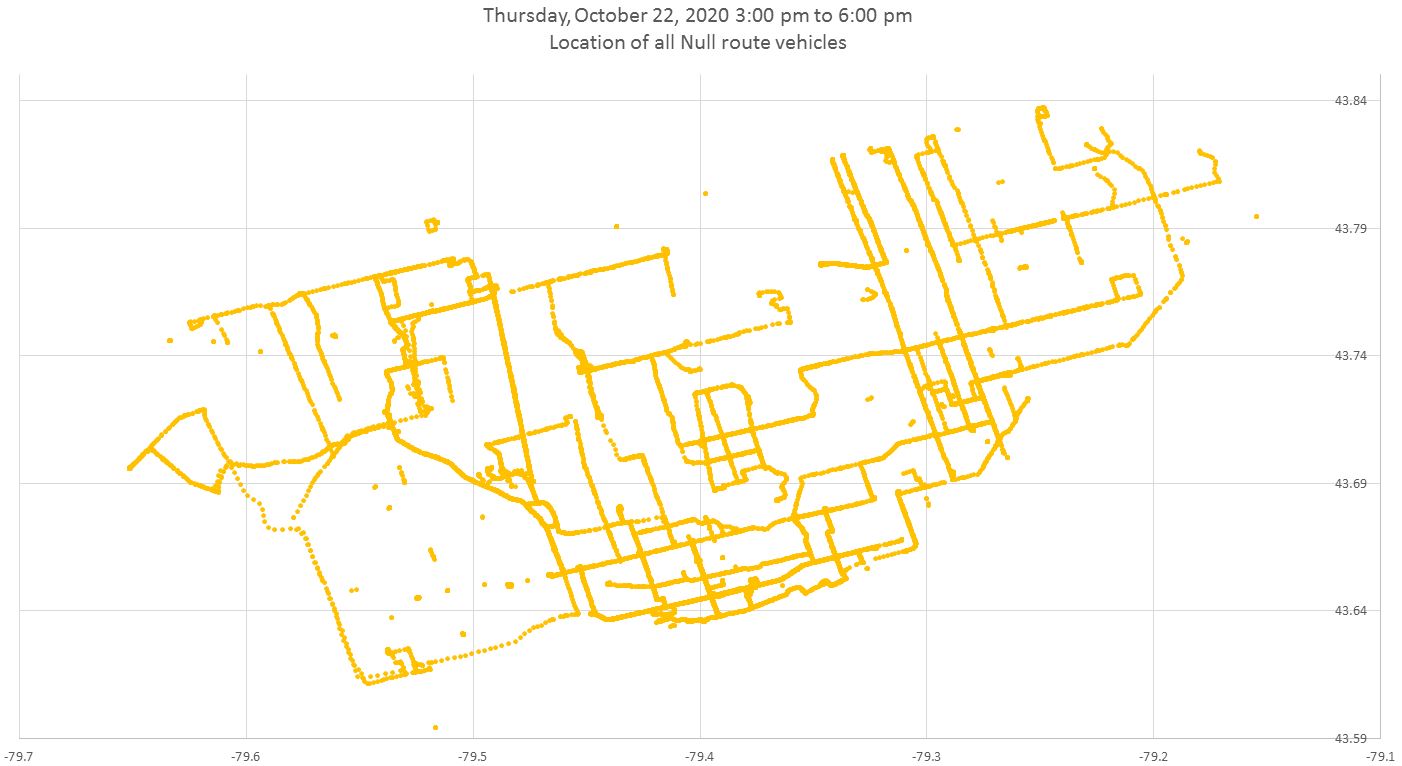
At this point, I wanted to see where the vehicles actually operated. A quick check that the data show reasonable values is to plot them by latitude and longitude. This produces charts such as the series below for Saturday, October 17, 2020.
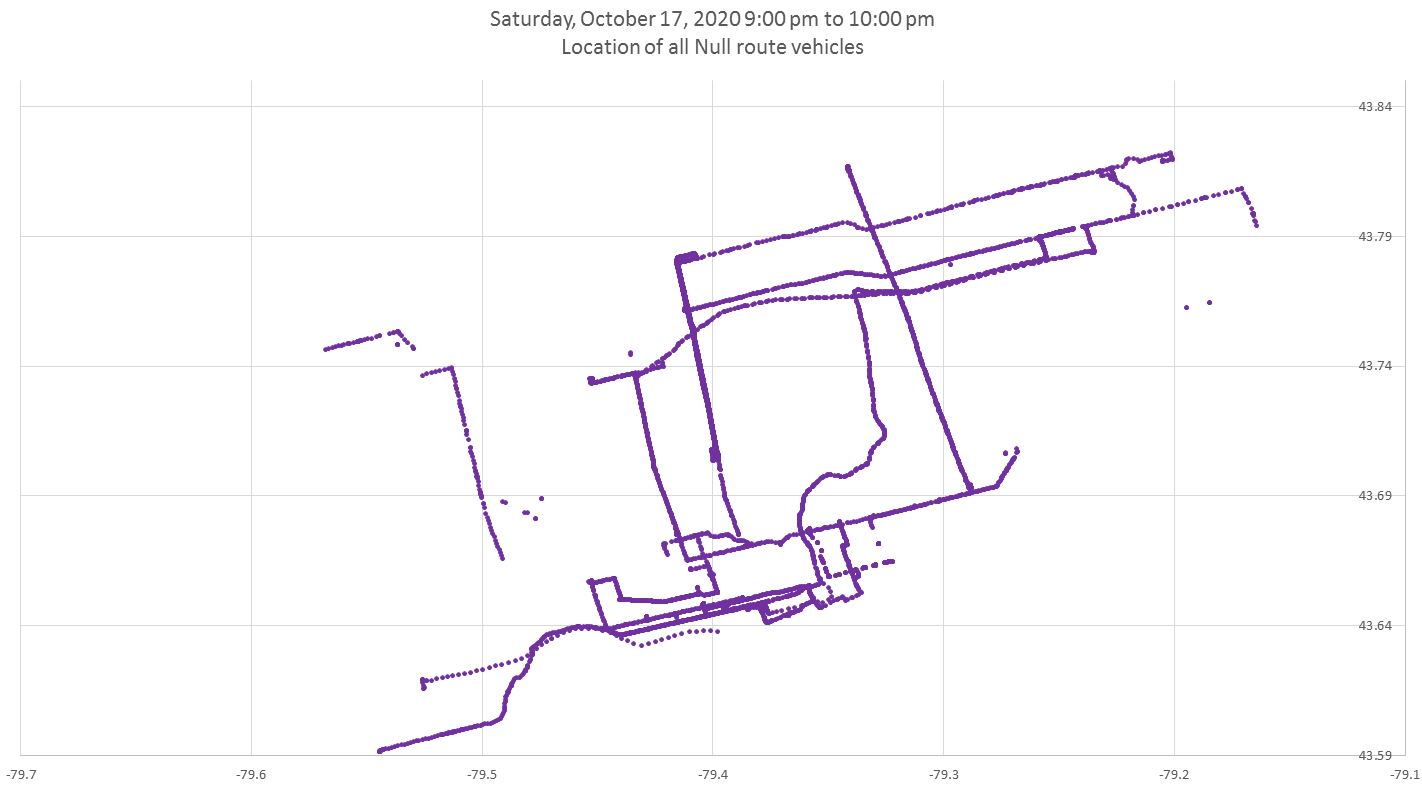
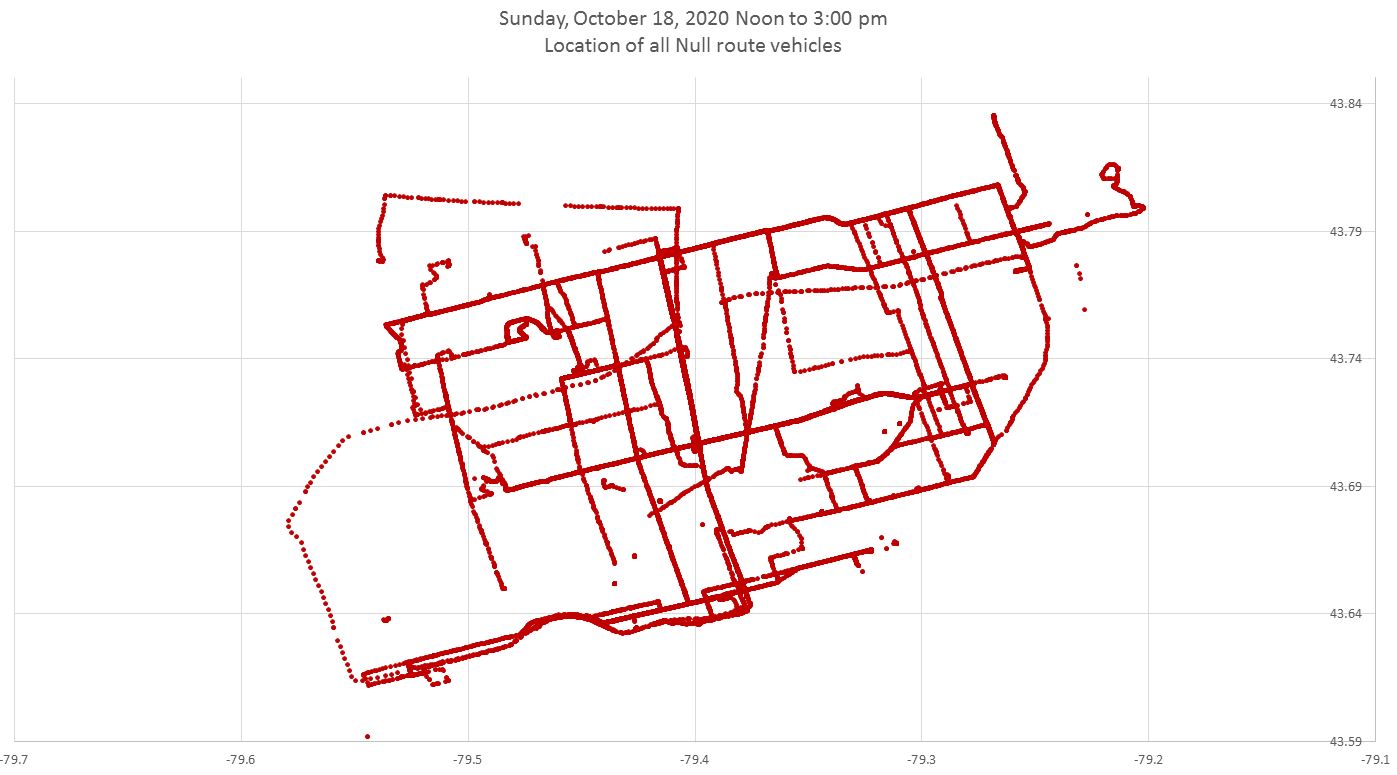
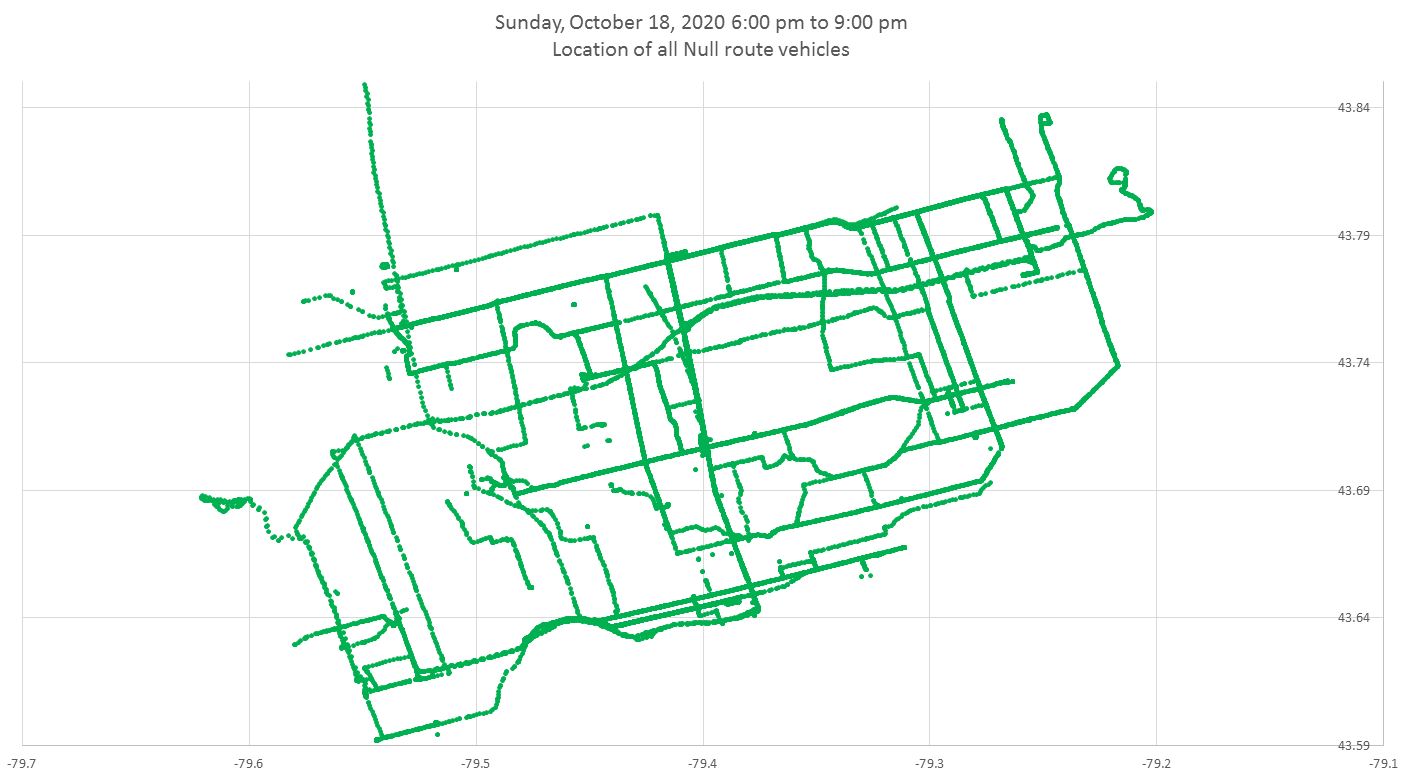
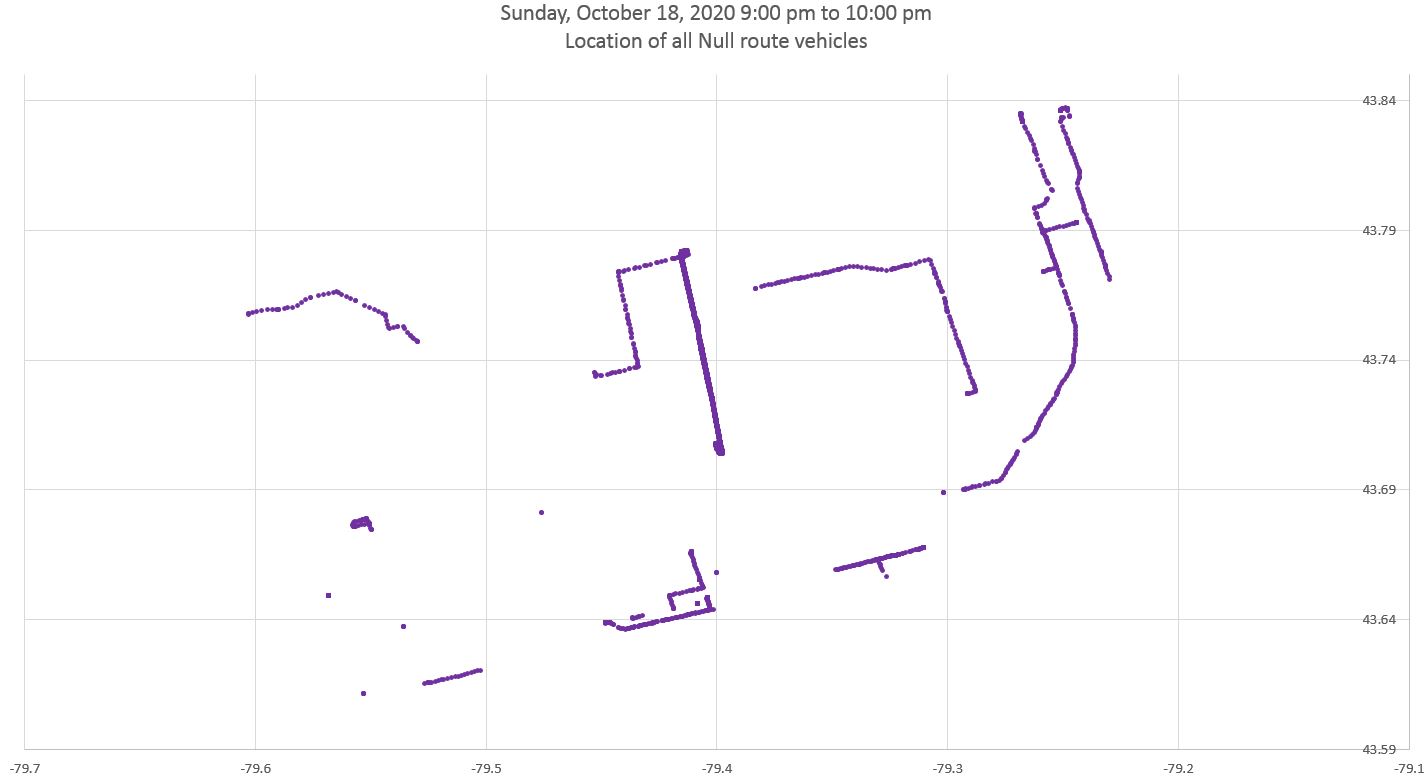
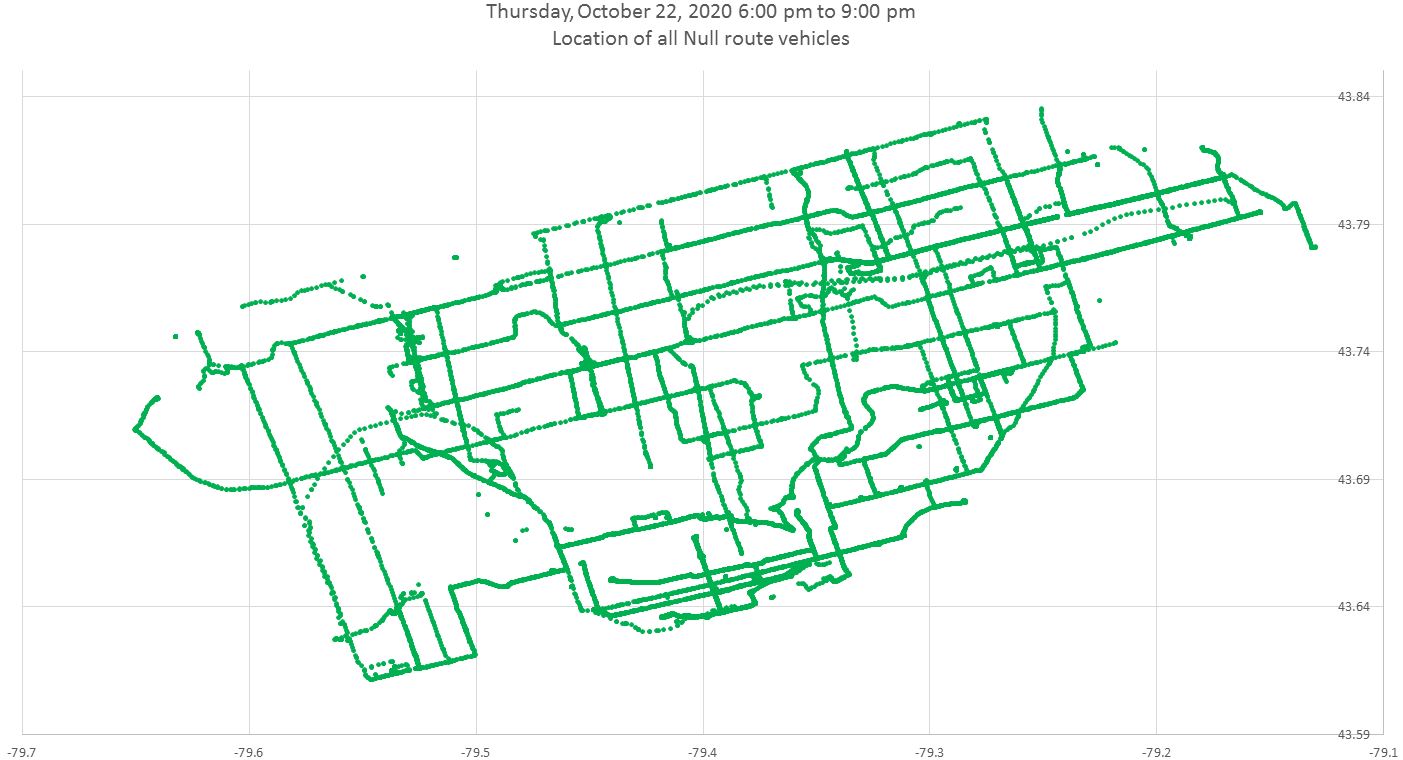
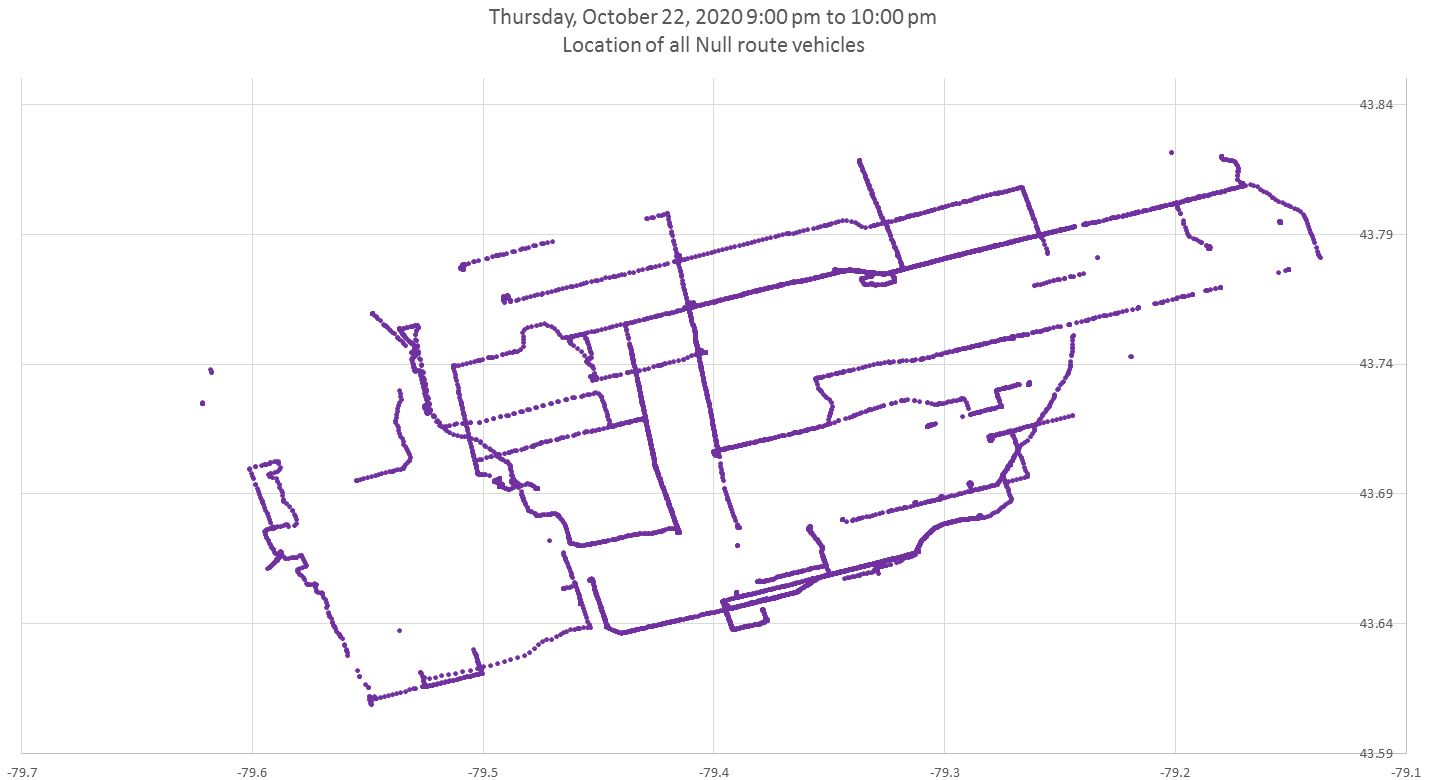
Each image contains data points for a three hour period except the final one which is only one hour from 9 to 10pm. Each dot on a chart is a single observation of a vehicle by the tracking system, although duplicates will overlap when a vehicle is not moving.
The overall map of Toronto is clear in the locations where the vehicles operate. A few notes:
- Buses can be found on Highway 401, the Gardiner and the DVP. They are enroute to/from service somewhere.
- Buses appear on fragments of routes. This can be caused by the three-hour window interrupting a trip, or because the bus only served a portion of the route.
- Isolated dots correspond to stationary buses and these are often at subway stations.
- The entire grid is tilted because Toronto’s streets are not strictly north-south, east-west. The grid is compressed slightly in the north-south direction because of the aspect ratio of the city and of a legal-sized chart.
- The build-up and build-down of service over the course of the day contributes a lot of observations that are dead-head mileage. These will have to be filtered out in route-level analysis.
Visible on both Saturday and Sunday, October 17-18 are the subway shuttle operations on Yonge Street.
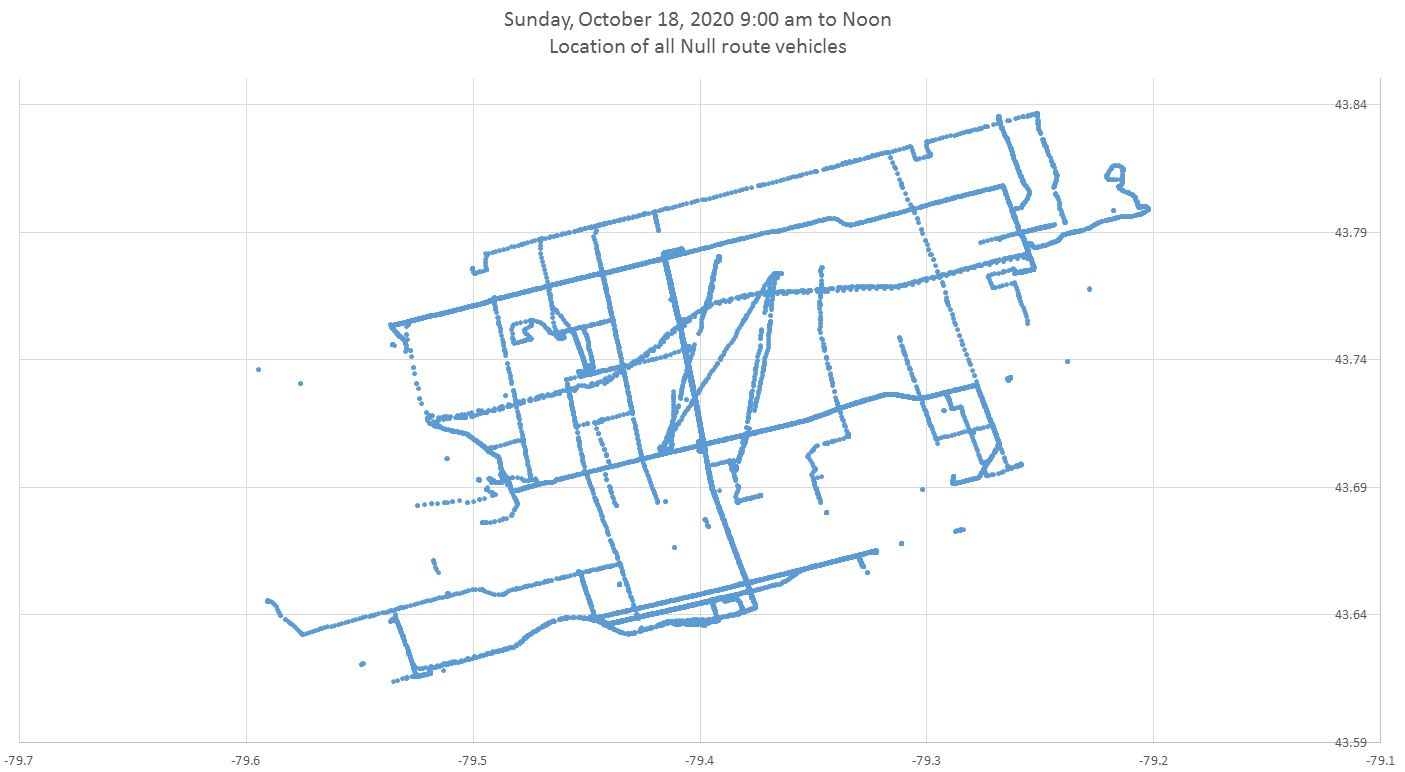
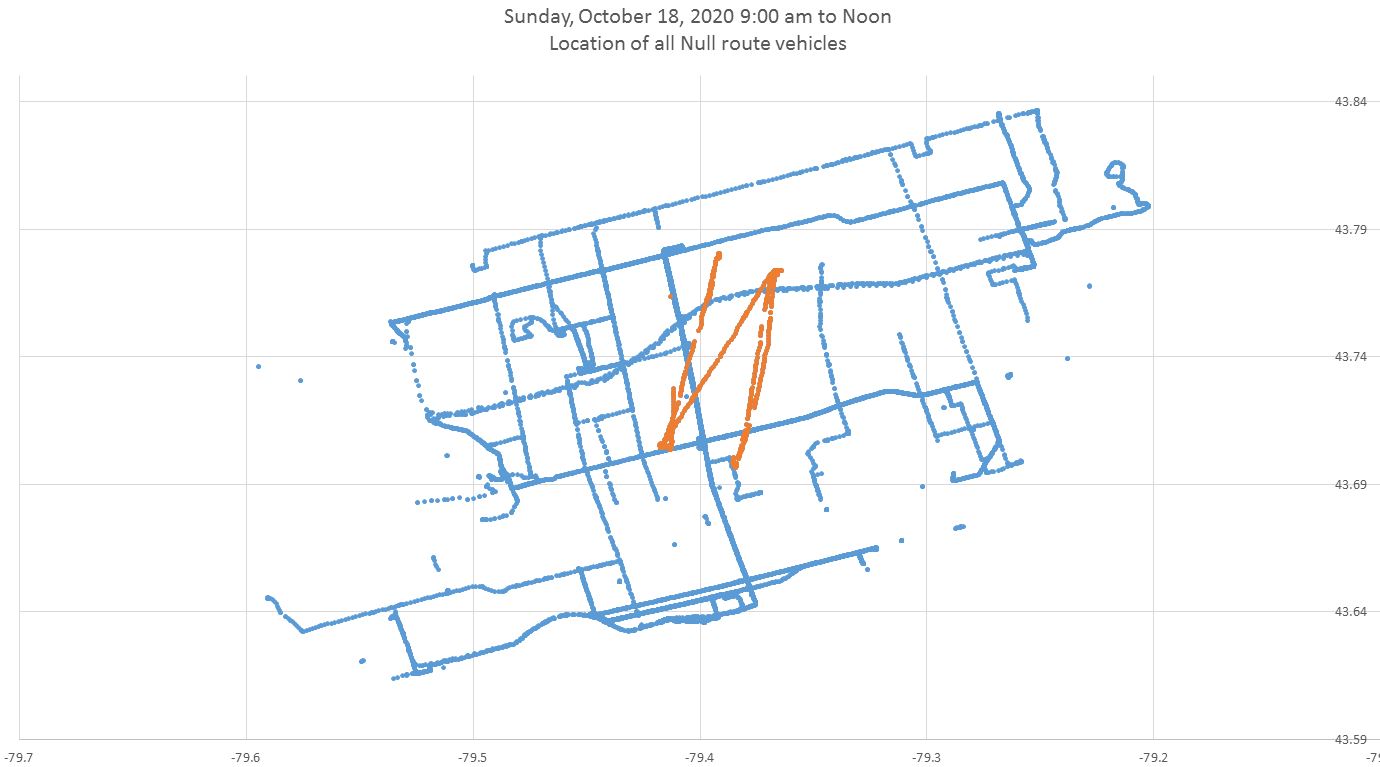
Here are the charts for Sunday, October 18 starting at 9 am. Something very odd was happening with a bus which was clearly reporting GPS locations that are rotated relative to the street grid.
The rogue data were coming from bus 9104. The problem appeared to be confined to one day. Here are the charts for October 18 while it was active highlighting all data points from that vehicle.
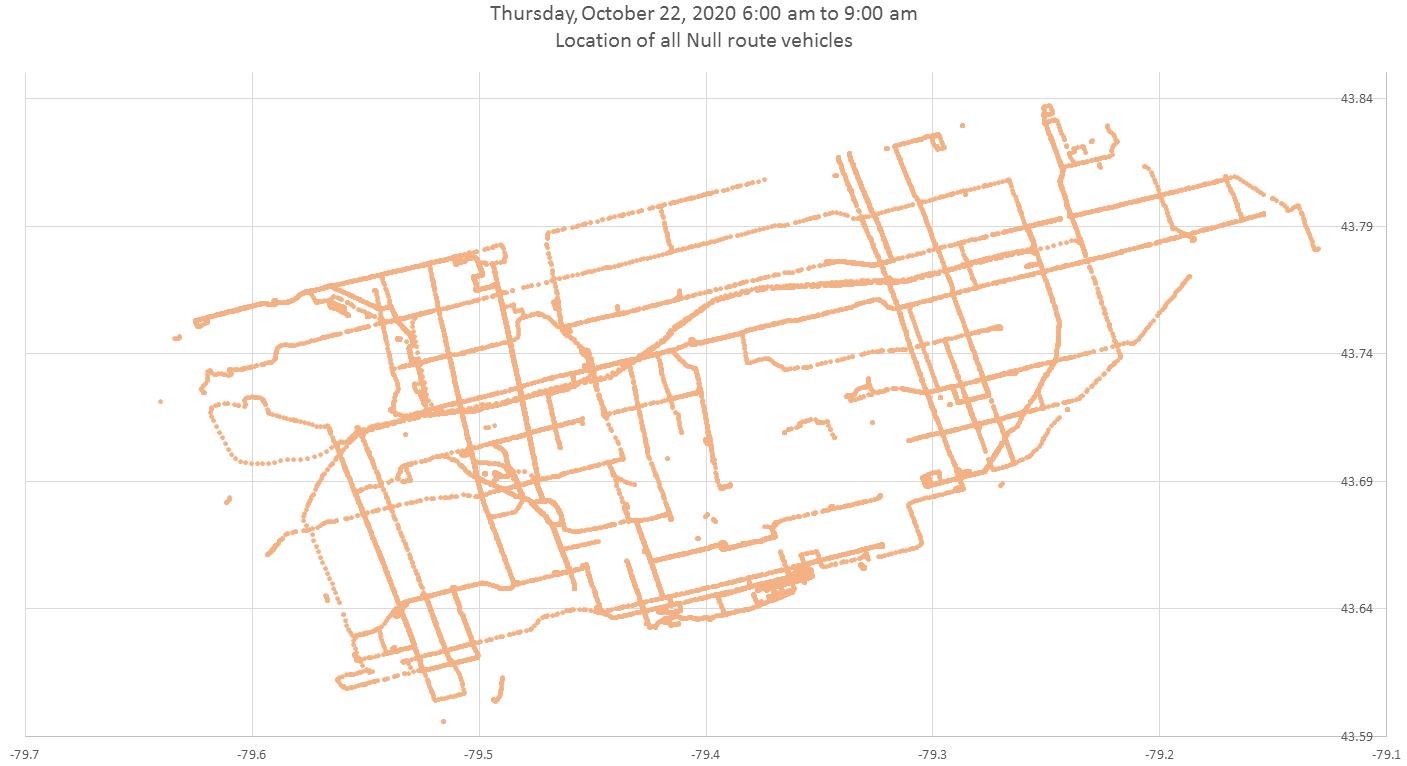
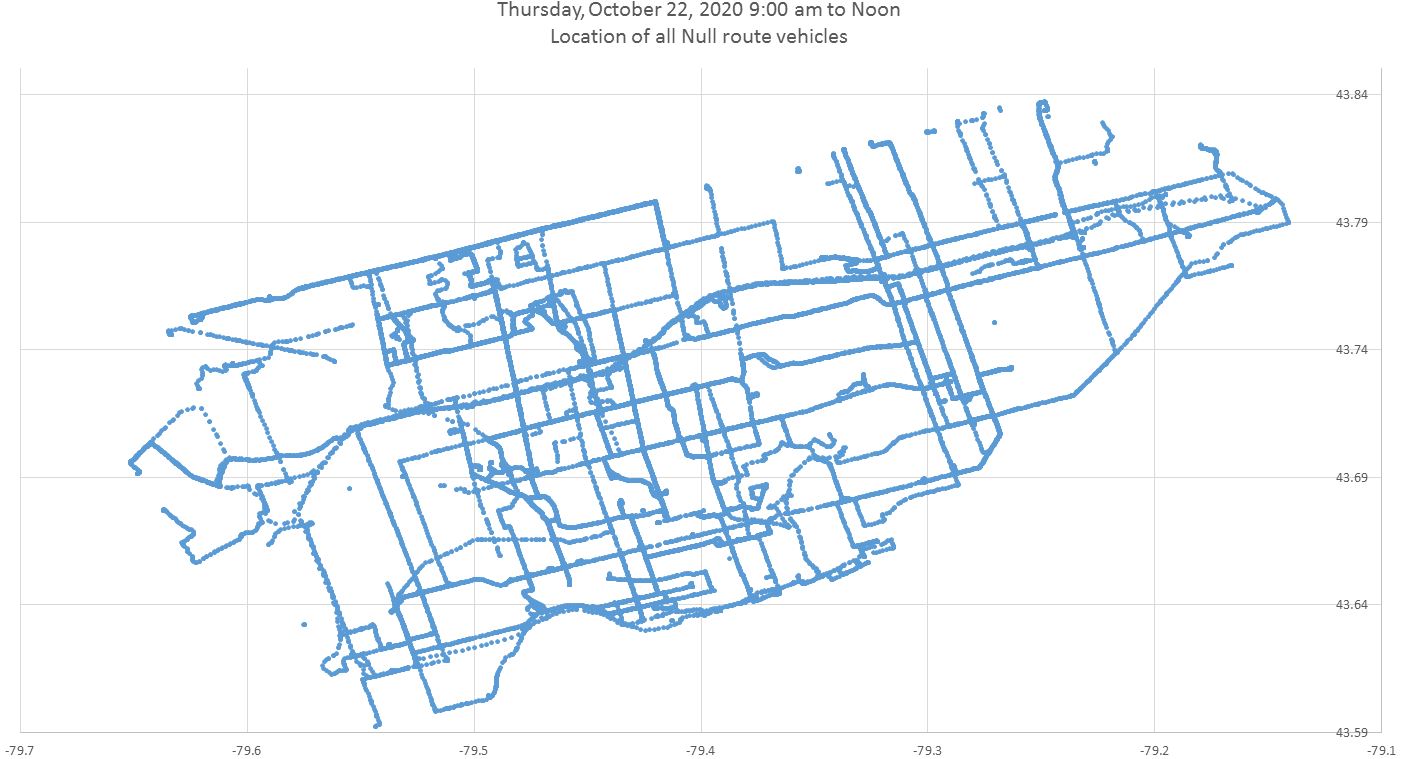
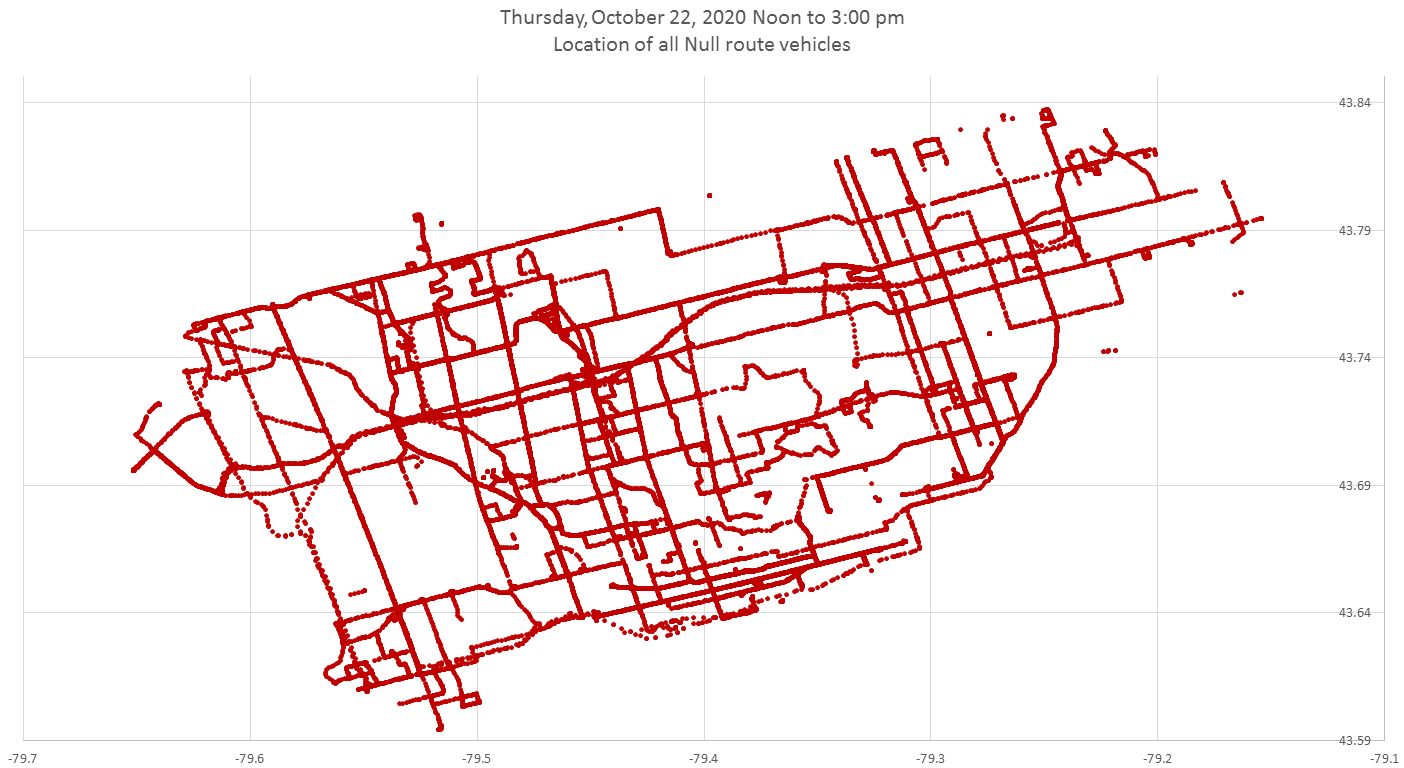
Thursday, October 22, is a weekday, and the charts show a somewhat different distribution of vehicles than on the preceding weekend.
It is quite straightforward to isolate the data for a specific vehicle to see where it spent its time (as with 9104 above), but tedious to do this for the number of RADs in service.
When I turn to individual route analyses, I will incorporate data from RADS on specific routes to see how they were used.
Stay tuned.

Are you including null route streetcars in your data? There appears to be vehicles following King and Queen routes, including going through the Humber Loop tunnel.
Steve: Any vehicle which reported a null route number to VISION is included. I checked the data, and there are vehicles in the 4xxx range. If there were cars on RAD service that are still on CIS, this extract would not pick them up. However, they are a declining portion of the fleet.
LikeLike
Who cares just wait for the next bus. You do all this work for what?
LikeLike
I wonder how much “BE” has ever tried to rely on an unreliable route.
Back in the darker days of 501 Queen service, I would crowd aboard the first 501 LONG BRANCH car that showed up, no matter how outrageously overcrowded it was. A few times I would only pay an hour later, when I was getting off, because there was no way to get to the farebox (ALRV, token, none of this Presto stuff) when I got on.
No one “just waits for the next bus”, because the next bus may never come.
LikeLike
Steve, when is the next schedule change? When is the Bathurst Street Bridge expected to be completed? Once that is completed, streetcars are expected to make their ‘triumphant’ return to the “511 Bathurst” route, then passengers on the streetcars will look out of the large windows and look at the fresh concrete surrounding the tracks.
Steve: The next change is for the Christmas board period, but after that January 3, 2021 is the next regular board. The TTC has not yet announced details for that.
LikeLike