How Reliable Are TTC Statistics?

Ben Spurr in the Toronto Star published an article on September 30 about the mis-reporting of vehicle reliability for the fleet of Bombardier Flexity streetcars.

In brief, the TTC reports defects for the new cars on a different basis than for the old ones (the CLRVs and the recently retired ALRVs), and this has two effects:

  • The reliability of the old cars looks worse by comparison to the new ones, and this supports the argument that the old cars should be retired as soon as possible.
  • The new cars have recently crested the performance specification from the Bombardier contract, but this is based on the way the failure rate is calculated.

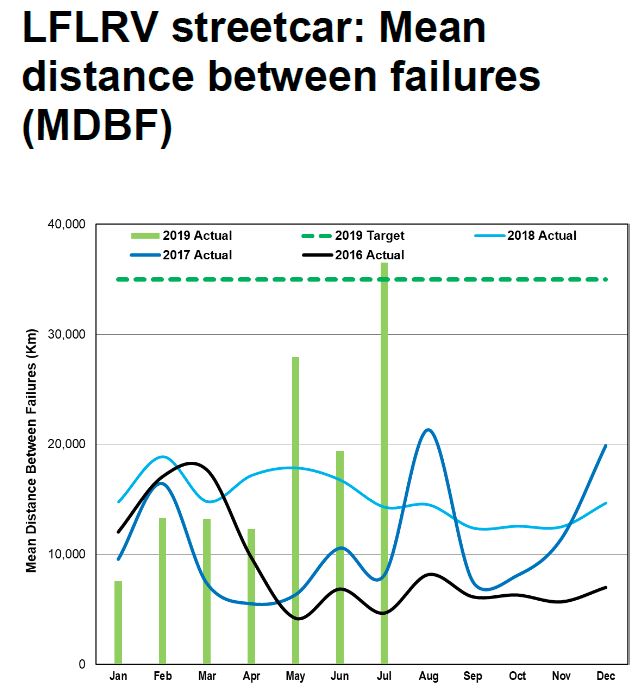
The September 2019 CEO’s Report contains Mean Distance Between Failure (MDBF) charts for both types of streetcars still in active service. August 2019 saw the new fleet’s reliability go about the 35,000 km MDBF, and CEO Rick Leary reported at the TTC Board meeting of September 24 that the current number was running above 50,000 km.

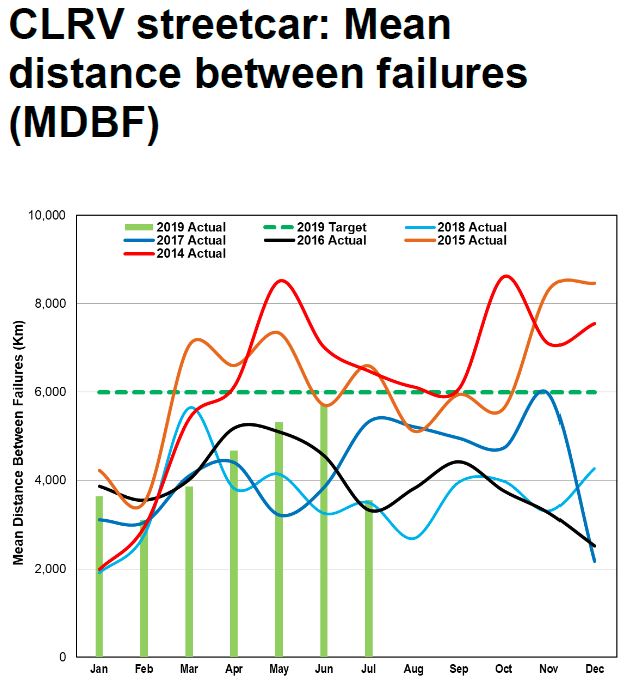
By contrast, the CLRVs have failed roughly every 4,000 to 6,000 km for much of the past three years with problems more common during the cold months. Note that the scales of the charts below are not the same.

However, according to Spurr’s article, the basis of calculation is different for the two fleets. In the case of the new cars, only failures chargeable against Bombardier’s contracted reliability level are counted while for the old cars any failure counts. This makes a big difference when one considers how many of the in service failures were not included in the calculation for the new fleet.

Spurr writes:

The vehicle contract the TTC and Bombardier signed in 2009 set a MDBF target of 35,000 km. The cars were supposed to reach that figure by the time the 60th vehicle was delivered. That car arrived in January 2018, but the new fleet failed to hit the target then or in subsequent months.

That changed this summer. As Bombardier edged closer to completing its delivery of the 204-car fleet, and the TTC weighed the option of placing an order for additional streetcars with the company, the publicly reported reliability figures shot up.

They showed the cars had an MDBF of 36,500 km in July, and 51,500 km in August, the best the fleet has recorded since the early days of the order. CEO Leary cited that most recent figure at last Tuesday’s meeting as evidence the cars are “performing exceptionally well.”

However, over the same period the unpublished reliability figures didn’t improve. The “legacy” numbers showed an MDBF of just 16,400 km in August, which while much better than the early months of the year, was virtually unchanged from the mark set in May.

The unpublished “legacy” figures are consistently significantly worse than those the contractual numbers.

He goes on to write:

Internal TTC documents reviewed by the Star show that in [August] the new streetcars experienced dozens of delays related to faulty brakes, malfunctioning doors, broken HVAC units, and short circuit warnings. The agency tabulated 43 significant delays during that period, but only 15 were deemed Bombardier’s responsibility and included in the version of the stats that are made public.

That lower delay figure led to the contractual number of the cars running more than 51,500 km without a failure.

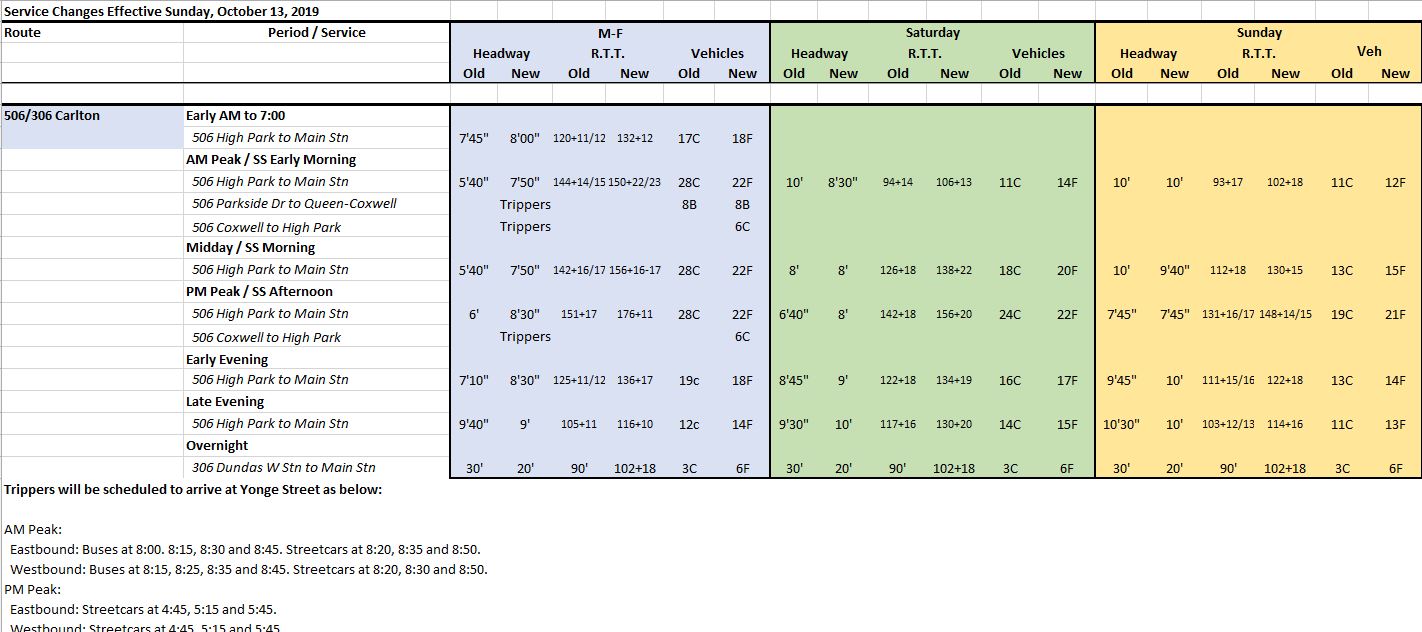
Readers can judge for themselves the type of delay that is omitted from the TTC’s reliability numbers from the following table which is compiled from TTC delay reports.

TTC_201908_LFLRV_DelaySummary

There are 56 items in the list and several patterns are immediately obvious:

  • Problems with the power collection system are common including pantograph failures, lost trolley poles or defective shoes, and dewirements snagging poles and/or damaging the overhead.
  • Brake problems
  • Mobility ramp problems
  • Failures early in the morning on cars that are probably just entering service

Many of the problems have nothing to do with Bombardier reliability stats and are not included in the calculation included in the CEO’s Report. If they were, the numbers would not look anywhere near as good.

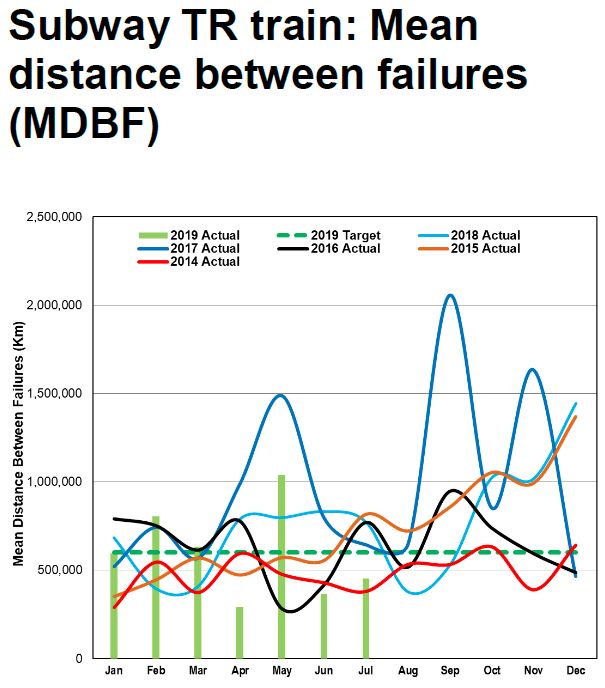
Something that is evident in reported reliability stats is that there can be large variations in MDBF values from month to month. The TTC does not make huge changes in the mileage operated by its fleet each month, and so the large swings must be due to a relatively low number of incidents. For example, if there were typically 100 incidents per month and this swings up or down by 10%, then the MDBF would not change much. However, if there were typically only 20 incidents per month, a small change in the month-to-month numbers would produce a big swing in the MDBF. This is evident in the Flexity reliability values and in those cited for the subway fleet, notably the newer TR trains on Lines 1 and 4.

Even if all types of failure were counted, the service delay it causes must be five minutes or more. This is a standard adopted from the NOVA group of rapid transit operators and really is more appropriate for rapid transit lines.

An important distinction is that vehicles that run in trains have the capability of “getting home” even if one unit is disabled under most circumstances, and reliability stats for this type of operation will be higher than for single vehicles on a streetcar system. Also, rapid transit lines operate at higher average speeds, and failures that are affected more by hours of service than by mileage are spread over a larger distance operated. This is quite evident in TTC subway stats where the MDBF is much higher than for streetcars.

By contrast, it is difficult to imagine how a bus breakdown can cause a significant service delay except in comparatively rare circumstances, and the five minute delay screen for a chargeable delay makes no sense for the bus fleet.

The question of just how reliable various vehicle types might be is part of a larger issue with the selective, and possibly misleading reporting of statistics by TTC management.

Delays to service, especially on the subway, are caused not just by equipment failures, but by a raft of other subsystems and problems such as signals, track, power supply, fires, passenger assistance alarms and track level incidents. The TTC tracks the various types of delay, but reports on them only rarely in public. This means that sources of service delay that might be under the TTC’s control are not tracked in a report that is routinely seen by the TTC Board, nor is there any tracking of the effects of preventative maintenance or capital works to reduce this type of delay. One obvious example is the new Automatic Train Control system which is now operating on about half of Line 1 YUS, but we know nothing of service reliability on that section, Vaughan to St. Patrick, compared to the old signals still in use from St. Patrick to Finch.

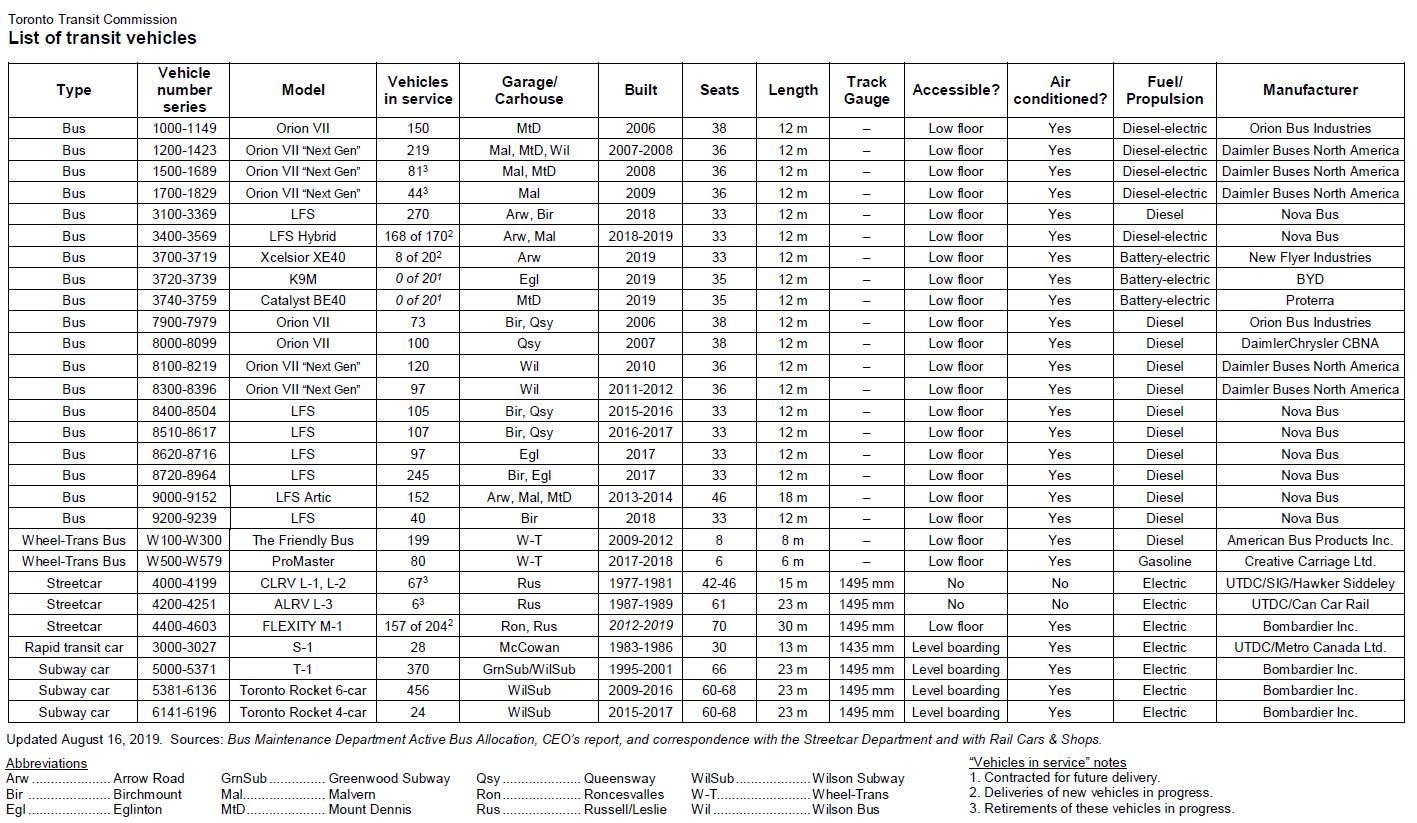
Bus reliability is reported in the aggregate for a fleet that ranges in age from brand new to over twelve years old. The TTC used to keep buses for at least 18 years, but now chooses to replace rather than rebuild old vehicles. Retiring a large tranche of 12-20 year old buses in recent years has had three effects:

  • The average age of the fleet is now quite low, and it will continue to drop. Half of the fleet is less than five years old, but as the “bulge” of new buses ages, the fleet reliability will fall.
  • With many new buses coming on stream, the TTC can keep old buses in service and maintain a high ratio of spares to service requirements. The situation is very different for the streetcar fleet where with the retirement of old cars, the fleet is too small to provide service on all routes with an adequate number of spares for maintenance.
  • The large order of buses soaked up the then-available funding for transit infrastructure as it was the only way Toronto could spend its allocation within the short timeframe dictated by the federal government.

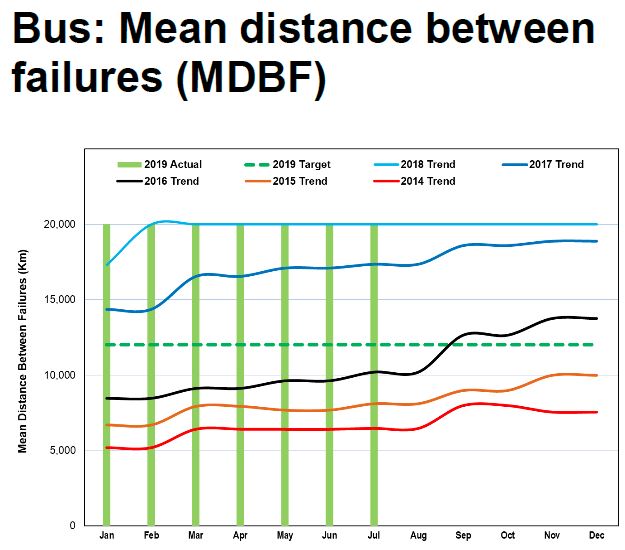
For reasons best known to the TTC, the chart above is clipped at 20,000 km rather than showing the actual variation, and this has been the case since early 2018. It is unclear whether the actual numbers are rising or falling over the past two years. Moreover, the values average the reliability for the entire fleet rather than showing subsets such as diesel and hybrid buses, or buses of varying ages or manufacture. This type of breakdown is vital in understanding fleet planning, not to mention tracking the benefits (or not) of technology changes such as the move to an all-electric fleet which is only just beginning.

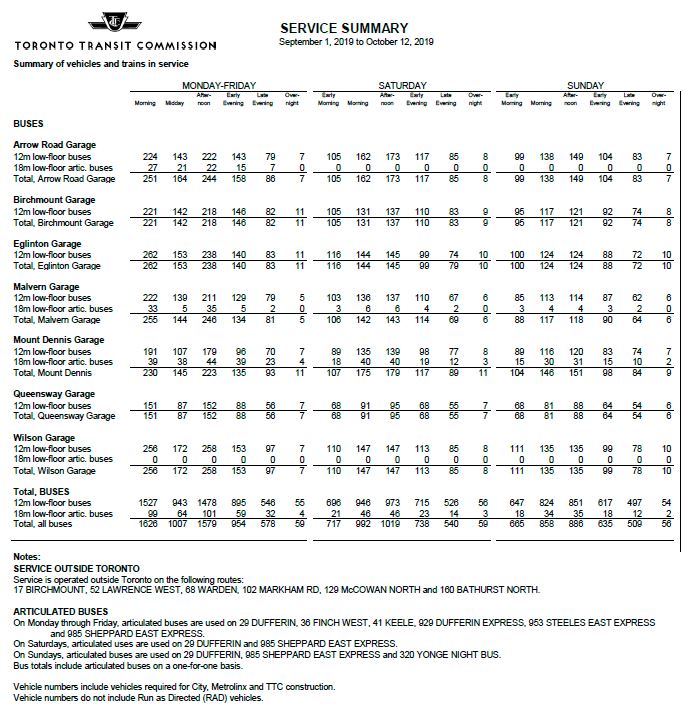
The TTC fleet of buses is much larger than its requirement for service. In total, as of the September 2019 vehicle list (taken from the Scheduled Service Summary, last page) shows a total of 2,076 vehicles as compared to a peak service requirement of 1,626 (p. 63 of the same document). This is a generous spare factor of over 27%, or one spare bus for every four in service. It is easy to get very good performance from your fleet with such a high ratio, but this also means that, in effect, the TTC operates one garage worth of spares for every four garages worth of regular service. This is far higher than the target spare ratio for rail vehicles.

In a separate post, I will turn to the question of service reliability, scheduling and the way in which service quality is presented by management to the TTC Board. This is another area where there has been a lot of work to make the numbers “look good” but with detrimental effects on the system.

Questions for the TTC:

I have posed a series of questions to the TTC and await answers from them. This article will be updated when they reply.

1. Has the Flexity reliability number always been quoted on the basis of failures chargeable to Bombardier, or was there a change in the methodology somewhere along the way? To put it another way, was there a change in what counted as a failure that created an artificial improvement in the reported numbers?

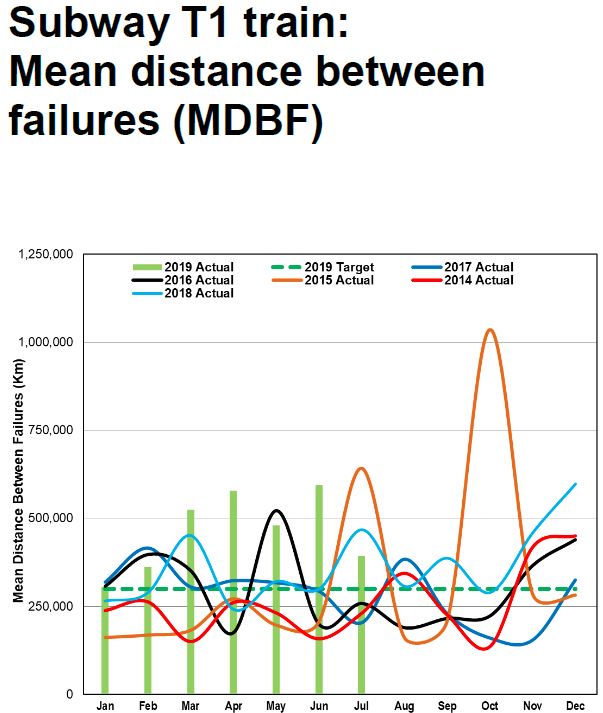
2. What is the situation with subway delays and MDBF numbers? Are all failures counted (at least those producing a 5 minute or greater delay) or only those considered to be the manufacturer’s fault? Is the calculation done the same way for the TR and T1 fleets?

3. The NOVA metric which the TTC uses is based on the idea of a failure that causes a delay to service. This only makes sense in the case of rail modes where a car/train failure can block the line. For buses, only a rare and well-positioned failure could actually block service. How is a chargeable failure calculated for the bus fleet?

4. Are numbers available for subsets of the bus fleet (e.g. all buses from the same order, age, technology) so that reliability figures can be compared as they have been with rail modes?

5. The CEO’s Report includes only stats for delays caused by vehicle faults, not from other sources such as infrastructure failure. Why is this info not also tracked in the report so that the effects are clear on a proportionate basis? In particular, there is no tracking of signal failures on various parts of the subway with older and newer technologies.

Summary:

TTC management should report vehicle reliability numbers on a consistent basis for all types of vehicles.

The calculation of service interruption rates should reflect what riders experience, not simply numbers to establish contract performance for suppliers or to artificially enhance the reported performance of some vehicle types.

The reliability statistics for the bus fleet should be broken down by major vehicle groups (manufacturer, propulsion technology, age) to allow meaningful comparisons and to ensure tracking of maintenance/reliability as parts of the fleet age.

The very large spare ratio for the bus fleet should be reviewed to determine whether this size of fleet is actually required, or if more service could be operated if only the TTC would budget for the cost of its operation.

Delays caused by infrastructure issues and other interruptions should be tracked and reported so that their effect on service quality can be seen in comparison to vehicle related problems.

TTC Service Changes Effective Sunday, October 13, 2019

The TTC will make many changes to its services on Thanksgiving weekend, Sunday, October 13, 2019.

These include:

  • The formal introduction of new Flexity streetcars on the 506 Carlton route on a scheduled basis.
  • Implementation of the route changes flowing from the Junction Area Study.
  • Construction at Runnymede Station for the Easier Access Program trigger some route changes and interlining.
  • Many “service reliability improvements” intended to make scheduled trips better match actual operating conditions.

Of particular concern in this round of changes is that a policy adopted by the TTC Board in June 2019 allows schedule changes intended to improve reliability to take precedence over loading standards. Several routes where service is nominally “improved” will also have crowding beyond the Board approved standards. This is caused by a shortfall in the budget which does not provide enough resources, the TTC claims, to operate service at a level that meets the standards. There are no numeric values given and so the degree of overcrowding is not known. The affected routes and time periods are shown in the chart below.

On a related note, a few routes which are now part of the Ten Minute Network will slip beyond that target headway.

The intent is to correct these situations either through the 2020 budget or by reallocation of service from other routes.

(The two charts above are included in the PDF containing all of the schedule changes at the end of this article.)

In response to my query about these practices, Mark Mis, Manager of Service Planning replied:

Q1:

SM: … it was my understanding that the table of crowded routes was going to be published regularly, but nothing has appeared after the first iteration … [earlier this year].

MM: The TTC will be reporting on crowded periods of operation in the CEO Report later in the fall when we have a complete board period of service reliability data. We think it is important to report on both crowding and reliability at the same time.

Q2:

SM: … does this footnote mean that the affected services are being scheduled at over the Service Standards for loading?

MM: The footnote is an internal note in the Board Period memo for record keeping purposes. It indicates a period of operation that is scheduled over the crowding standard because of a change in running time as opposed to demand. This strategy to address service reliability was approved by the Board on June 12, 2019 in the Improvements to Surface Transit Schedules report. This is important to note when you take the response to Q1 into account.

The June 2019 report included the following observations:

An effective transit schedule is comprised of two key components:accurate estimates of demand and cycle time—the time for an operator/vehicle to complete a round-trip. If the cycle time is insufficient, a transit schedule can not be delivered as planned resulting in customers experiencing unreliable service and higher levels of crowding than intended.

Customers value consistent and dependable schedules because it improves their trip planning, reduces wait times and reduces trip durations. This was demonstrated by the King Street pilot. A key outcome of it was more consistent and less variable service which resulted in tremendous increases in ridership. [p. 3]

The TTC is leveraging new technology and applying a new approach to preparing reliable schedules which includes setting cycle time at the 95th percentile of observed travel time along a route in a given period of operation. This is meant to ensure that operators have sufficient time to deliver service as planned and advertised during most of the operating period. [p. 5]

The TTC 2019 Operating Budget includes some funding to improve service reliability and capacity. It is not possible to bring all schedules that actually operate outside of the tolerances of service standards in line with them within existing funding. The new schedules will reflect actual operating conditions and will result in more reliable service for customers. [p. 7]

On several routes that already have new schedules, a common observation is that vehicles cluster at terminals because they generally arrive early and/or have long scheduled layovers. Despite this, the vehicles do not manage to depart on a regular headway (time between vehicles) nor do they achieve the “on time performance” goal. The TTC is quite generous with a six-minute window in which a departure is considered “on time”. Service becomes progressively more bunched as cars and buses proceed along their route, and there is no measurement of service reliability other than at terminals.

This begs the question of rejigging the schedules in the first place when service can be so irregular. In almost all cases, the “improved” schedules offer less frequent service because existing vehicle spacings are stretched to give longer trip times. Longer trips may reduce short turns, but this is only one of several possible measures of service quality. See Zero Short Turns Does Not Equal Better Service.

Streetcar System Changes

The 506 Carlton route is now officially a low-floor streetcar service with Flexitys scheduled at all hours. Bus and CLRV trippers will supplement peak services. Further details are in a previous article.

The 505 Dundas route remains a bus operation, but the schedules will change to remove extra running time added for water main construction in the central part of the route. This may relieve the worst of the bunching of Dundas buses now seen at terminals. Riders on the 505 will see improved service, or at least the bunches of buses will come slightly more often than they do today.

Conversion of 505 Dundas to Flexity streetcar operation is planned for the winter/spring after conversion of the overhead on that route for pantograph operation.

Routes 510 Spadina and 509 Harbourfront will get new schedules with blended services during most off-peak periods at Union Station. Scheduled headways will be the same on each route with the intent that cars will alternate on a regular, reliable basis. The downside to this scheme is that service on 510 Spadina will run less frequently, and layover times, which already cause queuing problems at the terminals are increased. 509 Harbourfront will see less frequent service as a regular seasonal change.

Overnight service on 306 Carlton will change to every 20 minutes, and on 310 Spadina to every 15 minutes to push a few more cars out of the crowded carhouses. It is unclear how long this practice will actually last once the CLRV fleet is retired because capacity will be lost at Russell Carhouse for construction starting in 2020.

Bus Network Changes

Construction of the new mouth of the Don River in the Portlands has progressed to the point that on October 30, 2019, Commissioners Street will be closed between Cherry and Saulter for excavation of the new river. A new Commissioners Street road bridge will cross the river, but at this point there is no money in the Portlands project for a streetcar bridge although provision exists in the plans. This would allow the eventual connection of an extended Cherry Street service east to Leslie Barns via Commissioners.

The route changes from the Junction Area Study will go into effect concurrently with route modifications to accommodate elevator construction at Runnymede Station.

The new route structure, in brief:

  • Route 30 High Park will operate from High Park Station to Runnymede Loop taking over the route number formerly assigned to Lambton.
  • Route 40 Junction – Dundas West will operate from Dundas West Station to Kipling Station with a short turn service to Jane Street.
  • Route 71 Runnymede will keep only its branch to Industry Street in Mount Dennis.
  • Route 189 Stockyards will provide service from the subway at High Park and Keele Stations to St. Clair and Scarlett Road.

Due to construction, no buses will be able to loop at Runnymede Station triggering the following changes:

  • Routes 71 Runnymede and 77 Swansea will be interlined.
  • Route 79 Scarlett Road will loop via Annette, High Park and Bloor Street as shown below.

Seasonal service will end on:

  • Weekend evening service to the Zoo on 85 Sheppard East and 86 Scarborough
  • 121 Fort York – Esplanade to Ontario Place and Cherry Beach
  • 175 Bluffers Park

The details of all changes are in the file linked below.

2019.10.13_Service_Changes

Metrolinx Board Meeting September 12, 2019

The Metrolinx Board met on September 12, 2019, but there was not much of substance on the public agenda. Presentations consisted as much of rehashing old news (including he oft-announced service improvements on GO Transit), but almost no substantive policy discussions.

Links here to the Agenda and Video for the meeting.

Ontario Line Initial Business Case (Video at 23:35)

This report was presented by a team of four from Metrolinx:

  • Mathieu Goetzke, Chief Planning Officer (Acting)
  • Malcolm Mackay, Project Sponsor for the Ontario Line, and until 13 days ago an engineer at TTC with 13 years experience, now transferred to Metrolinx. His previous major TTC projects included the Relief Line and the Union Station second platform.
  • Duncan Law, Head Sponsor for the subway program
  • Becca Nagorsky, Director for Project Planning

As I have already reviewed the Initial Business Case (IBC) in some detail, I will not dwell on that here, but will flag comments during the presentation and discussion of particular interest.

There were two threads on which nobody remarked, but which were significant given the way that the Ontario Line was announced:

  • The project details are far less advanced than the bluster of the original announcement might have indicated, and Metrolinx acknowledges that significant technical challenges remain for the design.
  • Language implying the general incompetence of the TTC to build a “modern” rapid transit line is much reduced if not eliminated from the discussion.

These are welcome changes, but we now face the need to build something because the Premier announced it.

Mathieu Goetzke introduced the presentation saying that although the Initial Business Case (IBC) was published in July, they are now going into more details. The Preliminary Business Case (PBC), the next step in the process, must resolve some issues and Metrolinx needs to “activate all possible levels” to address project costs. (See video at 27:00.)

Duncan Law continued in this vein saying that it was important to recognize that the IBC is an early stage of the project. Both the Relief and Ontario Lines are underpinned by the recognition that more capacity is needed. With roughly 50 per cent of the Ontario Line being at or above grade, there would be cost savings. Moreover, with the line separate from the existing subway system, there is an opportunity for technology change that would not otherwise be possible. There is a big difference in this outlook from saying that the TTC uses out of date technology.

Becca Nagorsky echoed the remark that the IBC is a first phase saying that its purpose is to define the project’s goals that must be preserved through the life cycle of more detailed design. She continued what has become a standard Metrolinx comparison of the original Relief Line project to the Ontario Line considering only the Relief Line South. This works from the assumption that the Ontario Line’s technology change will save so much money that the Relief Line North, as a conventional subway, does not even come into the discussion. This precludes the possibility that future design work might discover that the Ontario Line could be more expensive than originally thought, but by then the idea of going back to a subway project will be difficult, if only for political reasons. (There are parallels with the now-entrenched concept of a Scarborough Subway.)

The capital cost projections include anticipated savings due to “risk transfer” to a private sector partner in a Design-Build-Finance-Maintain (DBFM) P3 arrangement, but as with so many P3 schemes, there is little explanation of how exactly this is achieved. In particular, there is always the possibility that circumstances and designs will change, and the private sector “partner” will not assume this risk.

Note that none of the Benefit-Cost ratios exceeds “1” indicating that any version of the project does not produce a “profit” within the Metrolinx benefit-cost methodology. This came up in discussion a bit later (see below). The important issue here is that a large project such as the Ontario or Relief Line has benefits (and possibly costs) that the methodology does not capture notably the value of increasing resiliency in the rapid transit network by provision of alternate routes, and the enabling of projects such as the Richmond Hill extension that would otherwise overload the system.

A new addition to the discussion is a map showing the supposed benefit of the Ontario Line to residents of low income areas. It is no surprise that the OL (and the full RL to Eglinton that preceded it) benefit low income areas such as Thorncliffe Park and Moss Park, but there is a bizarre problem with the map which shows a reduced access to low-income jobs for residents between the Spadina Subway and the Barrie GO corridor south of Eglinton, far from the Ontario Line, not to mention Flemingdon Park north of Eglinton. There is something wrong here with the underlying model, but nobody at the meeting picked up on this.

Duncan Law bravely observed that “we are trained to challenge how things have been done” and this will lead to cost avoidance in the design (video at 38:00). He noted that early works on the route would be accelerated, although this is a tactic already in place (after much political fighting with Mayor Tory who eventually embraced it) for the Relief Line. At this point, Metrolinx is considering what their options for the OL design are before they take them to the public for comment, and they are still at an early stage.

In other words, they have a line on a map, but even that may change, and they fear alarming the locals with designs that are not yet definitive.

Malcolm Mackay spoke about the early works and the importance of co-ordination with large programs in the corridor to “leverage” contracts and consultants for other projects such as delivery of the (now) six track structure from East Harbour to Gerrard (four GO tracks plus two for the OL). There is also the potential role of Transit Oriented Development (TOD) works where some OL work could be combined with private development. However, it is not clear whether the likely construction timeframes of East Harbour and other projects would mesh with the schedule for construction of the OL.

In a marvellous piece of bafflegab, the presentation notes:

To demonstrate visible progress and to de-risk the schedule, a progressive works program is being contemplated with a ground breaking target of 2020 – 2021. [p 20 of the PDF]

What this means is that if Metrolinx actually undertakes some work soon, there will be political benefits of “progress” (shovels in the ground) and would-be bidders for the larger project will see that it has progressed beyond a political slogan and a line on a map. It is unclear just how much will actually be achieved by 2020 when the requests for qualifications and proposals (see chart below) occur.

Among the potential early works is design work the Don Valley crossing and possible launch sites for tunnel boring machines (TBMs). The decision to place some of the OL at or above grade means that there are more transitions in and out of tunnels than would be the case with an all-underground line, and launch sites at the transitions are required. These have significant effects on their locations as recent experience on the Eglinton Crosstown shows.

Mathieu Goetzke observed that the Queen Street corridor has challenges, but of course that would also have applied to the RL at least as far west as Osgoode Station. There is the larger question of the choice by the RL project of Queen versus a route further south, and again that is both a technical and political decision that is now set in stone.

The Next Steps slide below contains the troubling observation that Metrolinx will work to “understand community engagement” as if somehow Metrolinx has been operating in the dark while the Relief Line project went through its assessment and consultation stages. In a telling, but common, misuse, Metrolinx describes what they will undertake as “fulsome” intending to imply “copious” or “substantial”, but the word can also mean “excessive and insincere”, the fawning behaviour of one who insults by being overly complimentary. Metrolinx and GO before them have a long history of insincere public participation.

Discussion by the Board raised various questions starting with one from Michael Kraljevic who asked how much of the work already done on the Relief Line can be used for the Ontario Line? Mathieu Goetzke replied that work on the Queen Street corridor “feeds in” to the OL project, and Queen is “incredibly complicated”. The northern branch of the OL was built in part on the Relief Line North study. Malcolm Mackay stated that all of the work done so far will still be used giving the example of an underground station where geological information would inform design for a nearby structure. Some strategies that were “not successful” will not be pursued for the OL.

Regarding the construction challenges listed in the IBC, Vice-Chair Bryan Davies asked about “showstoppers” in the project. Duncan Law stated that there are none in the project “at this stage”, and he claimed that the benefit is that we see the risks now. Undoubtedly there will be several challenges, but the team will work through them, he said. The objective is to get people to jobs and home. Integration with GO for local and regional travel is important, Low continued. Environmental Assessment amendments will be required including a review of technical options for the OL. There is a “significant mountain to climb”.

Consultants have been engaged for the EA process, but subways tend to be environmentally positive, said Mackay, Metrolinx claims, and challenges with the elevated sections will be overcome.

These comments really are a dodge of the main question about the ability to reuse work already completed. The basic fact is that the OL alignment diverges considerably from the RL in places, and the detailed RL work, including public consultation, does not reflect the OL plan as it now stands. Again, we hear that this is a complex, challenging project, a rather different characterization than the self-confidence of the line’s announcement.

Director Paul Tsparis asked how the OL project helps to alleviate pressure on Line 1, and how is the TTC helping on that front.

Malcolm Mackay trotted out the usual list of TTC efforts including:

  • Larger trains
  • Painted tiles on the platforms at St. George and Bloor-Yonge to channel waiting passengers
  • Automatic Train Control
  • Bloor-Yonge Station expansion

The reference to larger trains is getting tiresome whoever cites it because the “new” Toronto Rocket (TR) equipment has been operating for some time now, and their extra capacity was long-ago consumed by latent demand. The painted floor directions may have some effect, but the big problem at busy stations is that platforms become totally filled even with a slight delay and this prevents easy exchange of passengers with trains. As for ATC, Mackay despite his years working at TTC, was unsure of the dates when it will be implemented. He also neglected to mention that more service requires more trains and, eventually, more train storage when the TTC exhausts what it now has. If the province takes ownership of the subway, this problem will land in their lap.

This was capped off with an observation that going north to meet the Eglinton Crosstown is a “beautiful addition to relief” to Line 1. Well, yes, many advocates have been saying this for a very long time while others downplayed the importance of continuing north of Danforth. Even Metrolinx flagged the added relief of the northern extension, and this informed support for work on it by the previous provincial government.

Michael Kraljevic asked about the benefit cost ratio where the value is less than one, although the P3 arrangement is alleged to improve that factor. How does this line up against other subway projects?

Mathieu Goetzke replied that it is hard to get a ratio beyond 1 with brand new infrastructure. GO improvements have good numbers because they build on legacy infrastructure. Moreover other modelling techniques would pick up economic development issues that are not included in the Metrolinx model. Phil Verster explained that Metrolinx does not consider benefits outside of purely transit ones, and the wider economic benefits would make every transit business case a good one. A case will always be touch-and-go for tunnels to get to a ratio of 1. Goetzke added that the OL can enable other works [e.g. the Richmond Hill extension].

This is quite an admission for Metrolinx who have wrestled with their business case analysis for some time. In a political climate where projects must at least break even, the benefits that are balanced against costs have a huge influence on the results. This can include both the scope of benefits (how wide a net is cast to capture benefits) and what payback period is used in the calculation. If the scope is too wide, there is a risk that presumed benefits are not entirely due to the project itself. If the timeframe is too long (Metrolinx uses 60 years), there is a financial problem of substantial expenditure in the short term for savings that might or might not accrue over the very long haul. Moreover, a large proportion of the “benefits” do not capture revenue that can be used to pay off project debt, but rather accrue to transit riders in reduced travel time and increased mobility.

These approaches can be defended on the grounds of “city building” and the long term, cumulative effect of having more transit infrastructure. However, the attempt to make any one project “pay its way” can distort how it is evaluated for political reasons.

Footnote: The Metrolinx Blog includes an article which emphasizes that the Ontario Line will not be built on unproven technology. The ghost of the UTDC and the Scarborough RT still haunts provincial decisions.

Ridership Initiatives (Video at 1:13:19)

Metrolinx ridership for the second quarter of 2019 is up 4.1% over the same period in 2018. However, children did not ride free a year ago, and when they are removed from the “before” numbers, the remaining ridership rose by 5.2%. It is worth noting that the TTC attempts to count children even though they ride free on the system, and so ridership numbers for the two systems are not directly comparable, at least on that basis. There is also the challenge of defining a “ride” when trips can involve a series of transfers and the benefit of the two-hour fare on Presto. The whole question of reporting demand on the GTA network needs work, including granularity about when and where people actually travel.

Statistics reported by APTA show commuter rail up 2.1% among reporting agencies, and bus ridership down 1.0%. GO bus ridership is up 4.5%.

A detailed map (PDF) shows the ridership by station across the rail network. There is no data for the bus network where there has been some controversy about which services should be maintained and which should be cut. Moreover the rail network counts do not distinguish by time of day to break out growth, if any, in off-peak travel as GO moves beyond peak period, peak direction commuting service to downtown Toronto.

Ridership growth varies by corridor and station. The high roller is Barrie with a 10.6% growth in the corridor. Kitchener us up 5.6% and Lakeshore East is up 4.8%.

GO is doing a lot of online marketing which they report as being quite successful, and there is an uptake of e-Tickets as a way of purchasing fares. Many of the promotions are for attractions in the off-peak period and for casual users who would be new to the system.

GO regards riders in Toronto as “transit natives”, people familiar with what transit can offer, and markets to them differently than to potential riders in the 905. Whether this is valid all the way out to the 416/905 boundary is hard to say.

The lower base GO fares are driving ridership within Toronto, but there was no discussion of the effect that will occur if the GO-TTC co-fare arrangement ends thanks to lack of funding from Queen’s Park. This has already affected riders on the UPX who no longer get a UPX+TTC discount. All the marketing efforts in the world can be undone by fiscal policies that affect fares and service.

Presto Quarterly Report (Video at 1:28:08)

Director Janet Ecker asked about efforts to minimize TTC criticisms of Presto. From what she is reading, criticisms of the system way off base. She asked how Metrolinx is trying to deal with this.

Phil Verster replied that it is illuminating to see how some comments get headline status and do not reflect what’s happening on the ground. Things are challenging, he said, and Metrolinx continues to work closely with TTC. There are claims that Metrolinx feels are not valid, and they have encouraged the TTC “to put this behind us”, not to go to dispute resolution.

Annaliese Czerny, Executive VP, PRESTO, felt that it was a shame the story is not about new products and better experiences. Verster was optimistic about making progress with TTC to move to a better future – new devices, open payments – and that this will be the story rather than problems. Czerny noted that TTC is an active and positive partner in the process for future developments.

This was the usual positive Metrolinx spin on PRESTO, but it was undone by the TTC when they released their agenda for the Board Meeting to be held on September 24. In it, the CEO’s Report is quite clear that the TTC will pursue arbitration under their PRESTO contract in an attempt to obtain payment of lost revenue due to non-delivery of a working fare system.

With PRESTO readers on every bus, streetcar and fare gate, and with PRESTO fare vending machines and self-serve reload machines at every station, the provincially-led fare card system has given our customers many benefits, but also many challenges.

Over the summer, I met with Metrolinx President and CEO, Phil Verster, to discuss the outstanding claims between the parties and the status of the outstanding deliverables of the contract for the implementation of PRESTO on the TTC. It is clear from our discussions that Metrolinx considers the contract deliverables complete.

So, while these discussions were informative about the positions of each organization, we were not able to reach a common understanding and agreement. We did agree that the next step is to proceed with arbitration, which is the dispute resolution process provided in the contract.

We are working with external counsel to review the process and finalize material and submissions. As we outlined in our report to the Board in June, the TTC does not consider the contract closed. Rather, there are significant deliverables outstanding, including open payment and account-based technology (which includes equipment), equipment to provide PRESTO Tickets on buses and streetcars, an acceptable third-party distribution network and Service Level Agreements for all equipment.

[TTC CEO’s Report at p. 14]

A major problem with Metrolinx’ perception of a “working” system is that they assume that any rider who encounters a fare machine that is out of service will use an alternate just as they would at a GO station. However, on crowded transit vehicles getting to another reader, let alone another fare machine for tokens or cash, can be very difficult and many riders do not bother to try. If they have a Metropass on their card (or a two-hour fare from a previous tap), this really does not matter because they have already paid, but for other riders this represents lost revenue to the TTC. Credit card holders cannot pay at all because this function rarely if ever worked.

Regular riders are familiar with the situation and just shrug when their tap does not register. I personally encounter this problem at least once a week, and see others having the same problems with unresponsive machines even more often. Things may be improving, but perfection is some distance off and Metrolinx has a lot to answer for from the earlier days of their PRESTO implementation.

Metrolinx tests the availability of fare equipment by “pinging” each device (sending a signal to a machine that elicits a response simply saying “I am here”). However, that function takes place at a low level within the hardware and the application software could be hung even though the “ping” gets a positive response.

Metrolinx measures of PRESTO access are likely too rosy because of assumptions about how easily riders can access the machines and about what constitutes a “working” box when tested remotely.

Kingston Road & Queen Reconstruction (Updated October 10, 2019)

The junction at Kingston Road and Queen, including Woodbine Loop, is getting a total rebuild in September 2019. The main part of the track work on Queen will be completed in a few weeks, but other works will stretch into November. Buses now diverting around the construction zone are expected to return to standard routings before streetcar service resumes on November 24, 2019.

For those unfamiliar with the intersection, it is unusual in two respects. The roads involved cross at an angle rather than at 90 degrees, and there are separate tracks for through streetcars headed to Neville Loop and for those turning northeast onto Kingston Road.

As part of this project, the geometry of the intersection is changing slightly.

  • The eastbound safety island for users of the 502/503 Kingston Road services and the 22A Coxwell bus will be widened to meet standards for accessibility. This requires that the space occupied by the three-track section is widened to make room for the expanded island.
  • The north sidewalk of Queen Street will be widened by taking space from the existing very generous westbound curb lane.

Most of the special work, including two rarely-used curves (west on Queen to northeast on Kingston Road, west on Kingston Road into Woodbine Loop) will be retained. Only the switch within Woodbine Loop that once led to a tail track on which no car would fit since the retirement of PCCs will be removed.

All of the overhead has been taken down for replacement with new pantograph-friendly hardware.

This post will be updated periodically as work progresses.

Sunday, September 15, 2019

Wednesday, September 18, 2019

Friday, September 20, 2019

Friday, September 27, 2019

The TTC, bless their hearts, has restored the curves westbound from Kingston Road into Woodbine Loop, and westbound from Queen to eastbound on Kingston Road. These were last used in revenue service in 1933 by a peak period Kingston Road shuttle service.

Considering how often the TTC has missed the opportunity to add curves the system actually needs, claiming either that they “forgot” or that it would be “too expensive”, this is one of the odder examples of TTC “planning” in recent memory.


Tuesday, October 1, 2019

Wednesday, October 9, 2019

Service Changes Coming to 506 Carlton in October 2019

With the shift to the larger low-floor streetcars, the TTC will begin schedule changes on Sunday October 13 (Thanksgiving weekend) for route 506 Carlton. In many periods of operation, the headways will widen in recognition of the capacity of the new cars, although the change will also bring a capacity increase.

The schedules are designed on the basis that most service will be provided by Flexitys, especially in the off-peak period. This could lead to problems such as those seen on other routes where CLRVs operate on headways designed for larger cars and are badly overloaded as a result. A lot depends on there being enough new cars to fully populate the route.

On the schedules, the only CLRVs remaining in operation will be the 506 Carlton trippers and 511 Bathurst (which is planned to start conversion late in 2019).

The TTC Service Standards set design capacities for vehicles which in theory dictate the level of service a route received. The standard is more generous for off-peak than for peak service.

Peak Off-Peak
CLRV 74 42
Flexity 130 70
Ratio Flexity:CLRV 1.76 1.67
Ratio CLRV:Flexity 0.57 0.60

If service were replaced purely on the basis of scheduled capacity, then there would be about 60% as many Flexitys/hour as on a schedule for CLRVs.

The new service design (click to enlarge, or retrieve PDF version) is shown below.

The change in AM peak and midday headways is from 5’40” (340 seconds, 10.6 cars/hour) to 7’50” (470 seconds, 7.7 cars/hour), a decrease in cars per hour to 72% of current service. This will be partly offset by the larger capacity of the new cars plus the benefit of trippers scheduled during the height of the peak period.

The change in PM peak headways is from 6’00” (360 seconds, 10 cars/hour) to 8’30” (510 seconds, 7.1 cars/hour), a decrease in cars/hour of to 71% of current service.

This change comes on top of wider headways introduced in August in an attempt to improve route reliability by giving streetcars more running time and longer terminal layovers in a bid to cut down on short turns.

The capacity goes up, but the service frequency worsens. This will almost certainly be compounded by the TTC’s inability to maintain even spacing of vehicles as they move across the route. Even though they might leave their terminals somewhat “on time”, this situation quickly deteriorates into bunches and gaps.

There is always a challenge when the TTC substitutes larger vehicles on a route and widens the headway. Laissez-faire route management that might work tolerably on shorter headways falls apart when headways are wider. If two vehicles nominally ten minutes apart actually operate as a pair, then there is a twenty minute gap and the service might as well not exist at all. Equally, the short-turn stats might look wonderful because both cars have time to reach their terminal, but riders see the same gap they would have if one of the cars short-turned.

The TTC has a huge challenge in this regard, but shows little sign of trying to fix the problem preferring to assume that more running time and longer layovers will do the trick.

Continue reading

The Last (Official) Trip of the ALRVs

Today the TTC officially retired the last of the ARLV (Articulated Light Rail Vehicle) fleet with 4204 and 4207 doing the honours running a 501 Queen shuttle between Russell Carhouse (east of Greenwood) and Wolseley Loop (at Bathurst Street).

In what has become a tradition with the TTC’s older cars, there was an emergency truck and a “pusher” CLRV whose job would be to push its partner ALRV back to the carhouse (or at least off of a main route) if something went wrong. 4117 shadowed 4204 while 4156 partnered 4207.

Nothing went amiss, and the ALRVs ran their three hours of service without incident. Indeed, 4207 did double duty making an early trip as part of the Labour Day Parade before making the first eastbound trip on the 501 ALRV shuttle from Bathurst Street.

Many people are posting photos from the day on Twitter and Facebook. Here are the best of my own.