
Although the TTC Board takes a long siesta through the summer, the CEO produces a monthly report even in months when the Board does not meet. The August 2019 edition was recently posted on the TTC’s site.
This report continues a format established some time ago by CEO Rick Leary in which the focus is on measures of system performance. There is no financial information here, and only summary ridership numbers with no sense of the associated revenue. All of the financial reporting was hived off of the CEO’s report into a quarterly CFO’s report, but we have not seen one of those since April 2019, and that covered the year ending December 2018. One might have expected an update at the July Board meeting, but the abrupt and unexpected departure of CFO Dan Wright in early June appears to have iced the short-lived report.
I spoke with Wright at the Audit & Risk Management Committee meeting the day before he left the TTC, and he gave no indication of his impending departure. We spoke about the problems of counting “rides” in an environment where there is only a tenuous link between fare payment and the actual number of trips (or trip segments) taken.
The TTC has been wrestling with the possibility that ridership has been over-reported for some time, and the situation is further complicated by Metropasses, the move to Presto and the two-hour fare. Just what is a “ride” for statistical purposes? I had planned to follow this up with Wright for an article here, but alas he vanished like so many other senior TTC staff in the past year. The problem is summarized in the CEO’s Report:
Higher PRESTO adoption appears to have affected measured ridership in two ways. First, we now have more precise ridership data compared to counting tokens and weighing paper tickets. Second, more than 25% of our former monthly pass customers have converted to PRESTO pay-as-you-go e-purse each month in 2019, likely to take advantage of the two hour transfer and for some, the TTC/GO discounted co-fare. This would affect measured ridership to the extent that these customers may ride less often than the monthly average of 71 rides per adult monthly pass. [p 25]
Josie La Vita, the Executive Director of Financial Planning for the City of Toronto, replaced Wright on an acting basis pending recruitment of a new CFO, a process expected to take 12-24 months.
The CEO no longer reports financial data on operations or capital projects, and the absence of a CFO’s report leaves a major gap in information available to the TTC Board and Council on the system’s actual performance.
Moreover, riding counts (i.e. vehicle occupancy) are only rarely reported at a route level, and a “crowding report” has not recently seen the light of day. When crowding data are released, they are averaged and this gives no indication of the effects of bunching and gapping on individual vehicle loads. Performance metrics that do appear in the CEO’s Report do not fully describe the service quality actually experienced by riders particularly on surface routes.
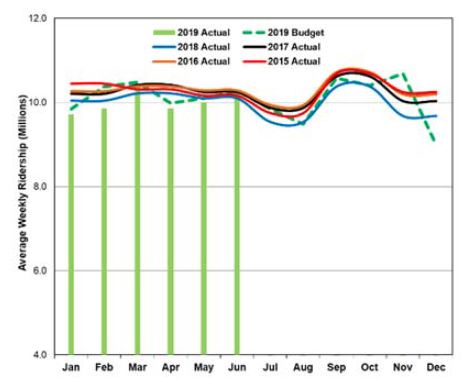
Ridership for 2019 to the end of June is reported as 267.8 million as against a target of 271.9m and a 2018 figure of 270.3m (down 1.5% and 0.9% respectively). For the month of June itself, ridership is on target. As the chart below shows, the shortfall in 2019 came primarily in the winter months which were unusually cold. June’s ridership was boosted by the Toronto Raptors Championship Parade without which the number would have been down 0.6% compared to 2018.
Weekend ridership is down, and this is thought to be due to various factors including the number of subway shutdowns. These are not going to end any time soon with the ongoing signalling projects and other infrastructure upgrades, and at some point the TTC cannot treat their effects as unexpected. A follow-on problem for the TTC is the perception by riders that “the subway is always closed” and this can affect ridership as much as the actual shutdowns.
Presto fare card usage continues to increase and by June 2019 the adoption rate reached about 80%. Presto ridership for the first half of 2019 was 214.2 million out of the total reported ridership of 267.8m.
Vehicle Reliability
The fleet benefits from improved preventative maintenance and from the retirement of older vehicles. Before the onset of hot weather, there was a concerted effort to get air conditioning systems in good order, and AC failures were rare even with the particularly hot weather in 2019. (Personally, I never encountered a “hot car” on the subway, a first for several years running.)
On the streetcar fleet, the decline in the proportion of service provided by the nearly 40-year old CLRVs and the disappearance of their ALRV cousins (of which a few are still officially active but never seen in revenue service) contributes to a reduction of in service failures. The Flexity fleet has its ups and downs for reliability, but even running below its target, these cars are much more reliable than those they replace.
On the bus fleet, the retirement of old buses and the recent purchases of hundreds of new vehicles has substantially lowered the average age of a bus and increased the proportion of buses that are “spare” relative to service needs. The fleet is over 2,000 vehicles, but the peak requirement in June was 1,641 including buses used on streetcar lines. This generous spare ratio has benefits in service reliability but also a cost in both capital and in garaging.
