
Recent discussions about TTC ridership and fare evasion included references to the numbers of riders who use each fare medium, but this was not published in detail in reports and presentations.
The TTC publishes a breakdown of ridership through the City of Toronto’s Open Data Portal including values for each type of fare annually back to 1985. Charts in this article use the data from 2005 onward. [Click on any chart to open an expanded version.]
Adult Fares
With the availability of Presto, Adult fare payments have been migrating to that medium for the past few years. The chart below shows the number of rides by fare type and the evolution of the preferred medium is clear over the years.
- In 2005, the number of token fares (red) was lightly greater than the ticket fares (orange), but ticket use dropped off as this medium was withdrawn.
- Metropass fares (dark blue, an estimated count of trips based on user diary records) grew considerably to 2014, and then began to drop as Post Secondary passes (green) and later Presto (yellow) and Presto-based Monthly Passes (dark green) ate into Metropass usage.
- Weekly passes have never accounted for much of the total. Other small fractions are broken out in a separate chart below.
- Total Adult ridership has been falling since 2014, although this was masked in overall counts by the rise in Children’s trips with the advent of free travel.
- Note that 2015 is shown with an asterisk. Ridership due to the Pan Am Games is not included in the totals to allow consistent year-over-year comparisons.
- A Presto “SRVM” is a “Single Ride Vending Machine”.
- Presto usage jumped substantially in early 2019 with the discontinuation of Metropasses, but this is not reflected in data to 2018 below.
The bands associated with monthly passes could overstate actual ridership depending on the accuracy of diary-based estimates. There is likely a drift between the ridership multiple (rides/pass) used to calculate the published figures and the actual ridership as discussed in my previous article about the Auditor General’s Report.

The data above show ridership values, and these are reformatted below as percentages of all Adult trips.

In order to make the low-usage media values clearer, the chart below includes only media for which less than five percent of Adult fares were paid with each type.
- The Weekly Pass (turquoise) tops out at about 2.5% of all Adult fares in 2012 and then drops again on a clear downward trend by 2018. This pass will likely be replaced by some form of fare capping later in 2019, but there is no definite decision yet on this.
- The two hour fare only came into use in mid 2018, and it does not yet represent a large number of trips. Indeed, counting these as “trips” is a challenge in comparison with the previous fare structure where a “free” transfer may have been valid, or not, depending on the nature of the trip.
- The Presto Monthly Pass became available in mid-2018, but Metropass users opted not to convert to it in large numbers until 2019.

Senior and Student Fares
Seniors and Students receive approxiately a 1/3 discount over Adult fares at the ticket/token rate, although their discount for passes is lower. This means that more trips must be taken by a passholder to “break even” compared with paying by tickets.
- There was a steady growth in Monthly Pass usage (dark blue) up to 2016 that was since reversed by Presto-based fares. Weekly passes (turquoise) accounted for a trivial number of trips.
- Tickets (orange) and Cash (grey) have long been the dominant payment medium for this group of riders.
- Presto fares (yellow) made a considerable inroad into ticket use in 2018.
- Total ridership by Seniors and Students dropped slightly in 2018.

The chart below shows the same data as percentages of all Senior and Student fares.

The low-usage media for Seniors and Students are a small percentage of that market, which in turn is considerably smaller than the Adult fare market.

Children
The advent of free rides for children 12 and under more than doubled the estimated riding from this group. Presto “children” (although there is some dispute about how many of these are genuine) have added a few more.

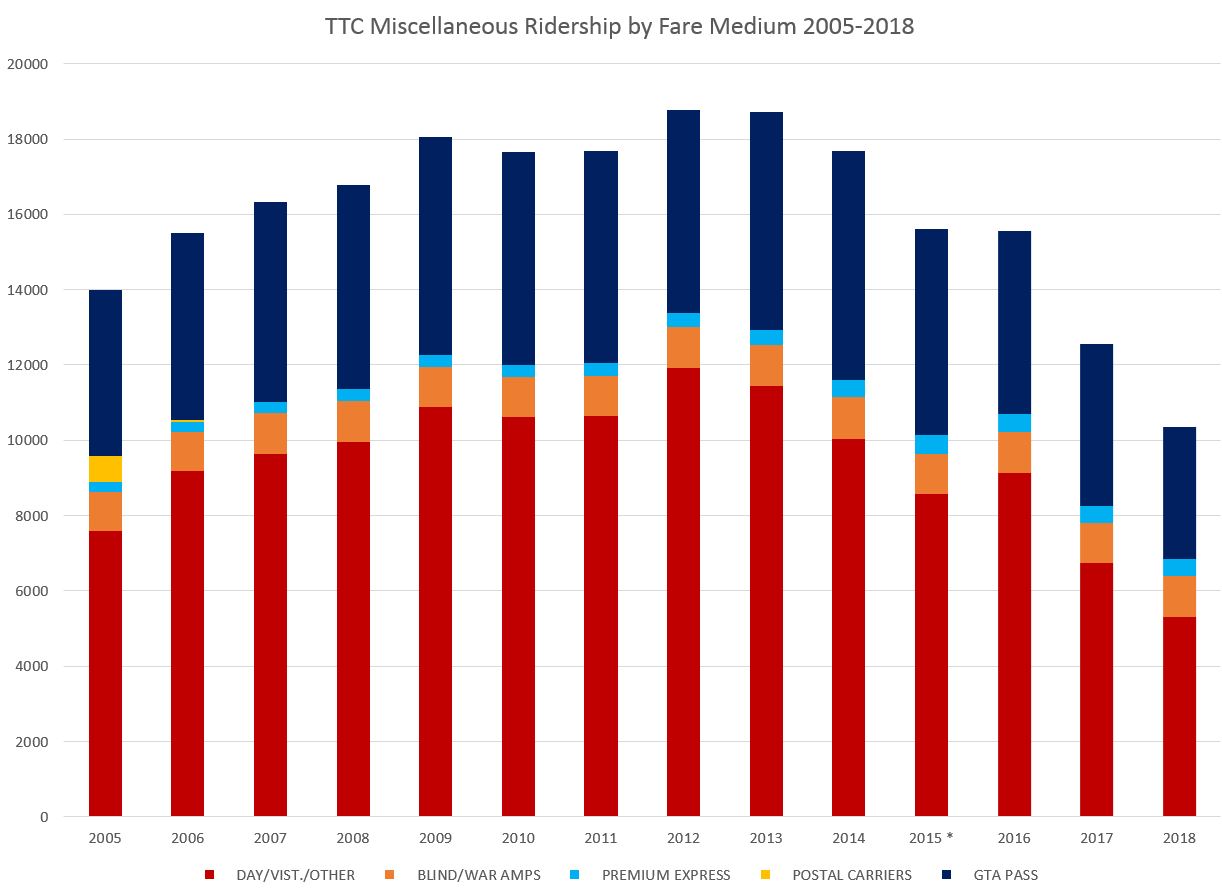
Miscellany
Finally we come to a collection of fare media that collectively account for a small and declining amount of total ridership. Day Pass usage has been dropping thanks to Presto, and this medium will disappear entirely later in 2019.
Total Ridership
The jump of over 10 million rides associated with free children’s travel offset a chunk of the adult ridership loss as noted above. This also partly blinded the TTC Board and Senior Management from what was happening to their system overall. The decline of total ridership began in 2017, but the Adult decline had already been underway since 2015.

The complete set of charts in PDF format is linked below.
