
The TTC Board will meet on October 16. Among items of interest on the agenda are:
- CEO’s Report October 2017
- Update on Service Reliability (Added October 17)
- Bus and Streetcar Fleet Planning (Added October 17)
- King Street Pilot: Monitoring and Evaluation
- Auditor General’s Report – Review of Complaint Regarding the June 29, 2016 Toronto Transit Commission Briefing Note (Updated October 17)
- Advancing Fare Integration (Updated October 17)
- Regional benefits of a major mobility hub at Toronto Pearson (Added October 17)
Financial Projections
Media reports have already appeared flagging the so-called surplus that the TTC will have in 2017. It is vital to understand that the TTC is not making a profit, but rather that its need for subsidy is less than expected in the operating budget. This will mean that payments the City of Toronto will make will be lower, and funds originally earmarked for the TTC can go toward other accounts or into reserves for future years.
This type of surplus has appeared in past years at the TTC, although the dollar value for 2017 is somewhat higher than normal. A surplus can arise from a combination of factors:
- Fare revenue might be greater than anticipated due to strong ridership, or because more riders pay undiscounted “full” fares.
- Extraordinary, one time revenue might come to the TTC (this is fairly rare).
- Expenses could be below expectations because less service is operated than originally planned, or because components such as fuel or benefits turn out to cost less than budgeted.
2017 was a year in which the threat of an overrun in subsidies was touted fairly early on thanks to weak ridership, and the TTC reacted by cancelling planned service improvements for the fall schedules. However, a review of financial projections month by month from CEO Reports shows how the surplus actually developed. (In the table below, the months refer to the publication date of the CEO reports.)
![]()
From the outset, ridership has been predicted to fall 5.5 million below budget, and this number has not changed through the year to date. However, the projected revenue from the reduced ridership estimate has grown to the point that total revenue will almost hit the budget target with a shortfall of only $2 million. The reason for this change is that TTC riders are on average paying a higher than projected fare (tokens and Presto versus pass-based discounts).
Annual ridership is running 0.3% below the previous year (adjusted for statistical differences such as the calendar), and this continues a long trend at the TTC. During recent years, although ridership was still growing, the rate of growth was in a long, slow decline. This was not an overnight effect, but a cumulative trend that was ignored in rosy projections for transit demand.
Through 2016, there appeared to be a recovery, but this has fallen off and the rate of increase is again negative. That turnaround in 2016 was responsible for an aggressive ridership target in 2017, although it was clear early in the year that this would not be achieved.


[Note: Data for the chart above are taken from the monthly CEO Reports. Because there are less than 12 regular Board meetings per year, some months are missed in the cycle. The blue line shows the current moving average of ridership for the previous year, while the green line shows corresponding values for a year earlier, adjusted to remove calendar effects. Both of those lines are TTC data. The yellow line showing the percent change from previous to current values trends downward from left to right corresponding to the gradual shift in the ridership lines as they grow closer together and then cross.]
Meanwhile, the projected total expenses have fallen by $46.8 million or 2.6% relative to budget.
The “surplus” of $44.8 million arises mainly from savings on the expense side, while there is almost no lost farebox revenue compared to the budget.
The originally projected subsidy requirement of $560.8 million was reduced by $14 million reflecting a draw from the “Transit Stabilization Reserve”, moneys that were set aside from past surpluses for a rainy day. This draw will not be required, and moreover the City will have $30.8 million less to pay in operating subsidy.
When there are “savings”, it is important to understand whether these represent permanent reductions in costs, or if they are transient effects. The factors listed in the report include:
- Labour savings of $14.3 million.
- Non-labour savings of $8.8 million due to better bus reliability, and deferral of some subway car preventative maintenance due to delays in parts supply.
- Presto fee savings of $7.0 million because fewer people were using Presto than anticipated (this saving runs contrary to rosy claims about the rate of Presto takeup usually touted by the TTC and Metrolinx).
- Employee benefit savings of $6.0 million.
- Diesel fuel savings of $5.0 million due to a lower rate of consumption than expected (this is thought to be weather related).
- Hydro and utilities savings of $2.0 million due both to lower consumption and lower than expected rates.
- Depreciation savings of $2.0 million because self-financed capital expenses in 2016 were lower than planned when the 2017 budget was struck.
Some of these savings may continue into future years, but some are simply questions of timing or of market conditions. Some of these can be credited to management actions to limit total expenses, but some are windfalls.
Wheel-Trans will contribute a further $13.7 million to the “surplus” primarily because ridership has not grown as quickly as expected (4.312 million projected vs 4.723 million budgeted). This produced a reduction in contract taxi service costs of $11.1 million.
Wheel-Trans ridership grew for the first few months of 2017, but has since plateaued. No explanation for the discrepancy between anticipated and actual riding is offered in the report.
![]()
Service Quantity and Quality
The amount of service operated on the streetcar system was considerably less than budgeted, while the bus fleet ran roughly to budget.

From time to time, the TTC will speak of this shortfall as being the result of a large amount of construction activity, but that is already factored into the service budget. The heart of the problem is a shortage of streetcars:
In the July 2017 Board Period, 22,305 streetcar weekly hours were budgeted for service, while 17,013 streetcar weekly hours were scheduled to operate, which represents a -23.7% variance.
This variance can be attributed to the reduction of the streetcar fleet from a budgeted 196 to 160 AM peak cars required in the 2017 May Board Period. [p 43]
With fewer streetcars operating than were planned for in the budget, the result is that when lines are “stretched” to include diversions, this is done primarily by increasing the headway between cars rather than by adding cars to a route. There is a compound result that scheduled capacity is lower than before, and service tends to be more ragged thanks to the diversions.
A related problem is the TTC’s ability (or willingness) to keep old streetcars operating. As new cars come into service, they can either make more “old” cars available for service on other lines, or allow the worst of the old fleet to be retired. The TTC has not published a plan showing how they intend to transition the fleets assuming Bombardier manages to keep roughly to its published schedule (about which more later).
On the bus side, there is a slight shortfall versus budget, but not as great as for the streetcar network. One problem that these charts do not reveal is the degree to which buses are repurposed from regular services to:
- streetcar replacements due to equipment shortages
- streetcar replacements for construction projects
- effects of construction on bus routes (e.g. the Crosstown LRT in the Eglinton corridor)
- changes in the number of vehicles available for service due to increasing spare ratios for maintenance activities
Most of this information can be culled from other reports, and I will turn to that in a separate post later this year about bus fleet planning.
Overall, there is no indication of the degree to which service operated is constrained by the budget. In other words, routes may deserve more service based on demand and the TTC’s loading standards, but the budget may not provide enough headroom to actually operate this even if vehicles were not an issue. The TTC does not publish ridership stats on a route by route basis with any indication of crowding problems, but only occasionally reports these on an ad hoc basis when issues arise. For example, when 512 St. Clair is formally rescheduled to operate with Flexitys in spring 2018, the scheduled capacity will be higher than it was with CLRVs to reflect actual demand levels.
Subway service operates roughly at budgeted levels.

As to service quality, the streetcar routes continue to fall well short of on-time departure goals at terminals, albeit with some improvement in 2017 over 2016. The standard for being “on time” is quite generously defined as between 1 minute early and 5 minutes late. This means that routes with frequent service (most streetcar lines) can operate with cars running in pairs and still be considered “on time”. Terminal departure patterns vary considerably from route to route (including on bus routes), and this is as much an issue of “TTC culture” as it is of congestion-induced irregularity. Even when departures are fairly regular (often because they are actively managed by a Route Supervisor), vehicles quickly catch up to each other and run in pairs. This behaviour has been documented in past articles on this site, and will be the subject of a future review later this fall.
A major problem with TTC service is that management sets “Key Performance Indicators” that are wide enough to embrace less than ideal service, and still they do not manage to achieve these targets.
Elsewhere in the CEO’s Report, there is a review of the “Customer Charter” and the degree to which promises to riders have been kept [pp 25-28]. One item is glaring by its absence:
We will continue to deliver on the positive initiatives that we started with our first Customer Charter in 2013:
- Posting the performance of all surface routes on our website so you know how your route is performing.
[From the Customer Charter webpage.]
In fact, route level performance data have not been posted since the first quarter of 2015.

Both major subway lines continue to deliver service at below scheduled levels. This begs the question of whether it is physically possible to operate the scheduled capacity and to what degree the shortfall will be fixed by a move to automatic train control and moving block signalling over coming years.


Delay statistics are compiled quarterly, and the info for the third quarter of 2017 is not out yet.
New Streetcar Deliveries
The CEO’s Report states that 43 of the new cars are now in service. As of October 14, this number is up to 46, and two more cars are in various stages of acceptance testing with 4448 being the most recently delivered to Leslie Barns. This brings us to the end of “September” deliveries. There remain 7 cars due according to the schedule for October, 8 in November and another 7 in December.
The TTC estimates that Bombardier will fall ten short by year end, while Bombardier itself claims the shortfall will be only five cars. Although production capacity has been increased at Thunder Bay, Bombardier continues to have “supply chain problems”. They do not specify whether this is due to a third party’s being unable to deliver parts on time, or other plants within the company running behind schedule.
Bombardier’s inability to meet its much-revised delivery schedules invites ridicule, but the situation is serious both for Toronto’s transit service and for the credibility of a long-standing transit vehicle manufacturer.
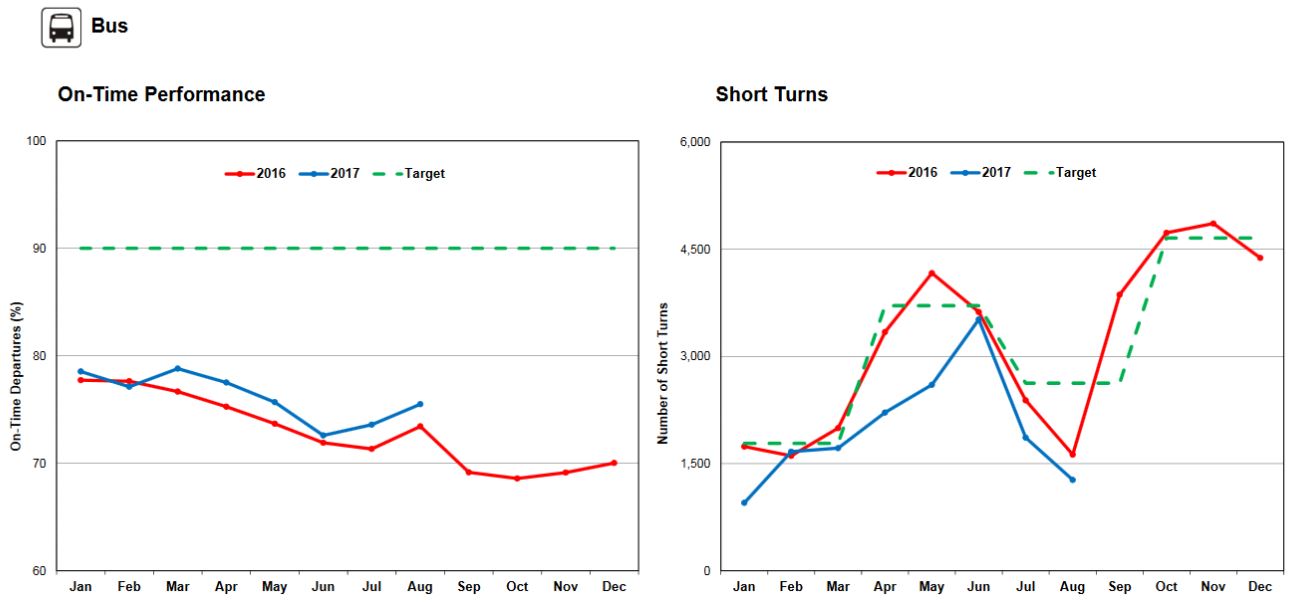
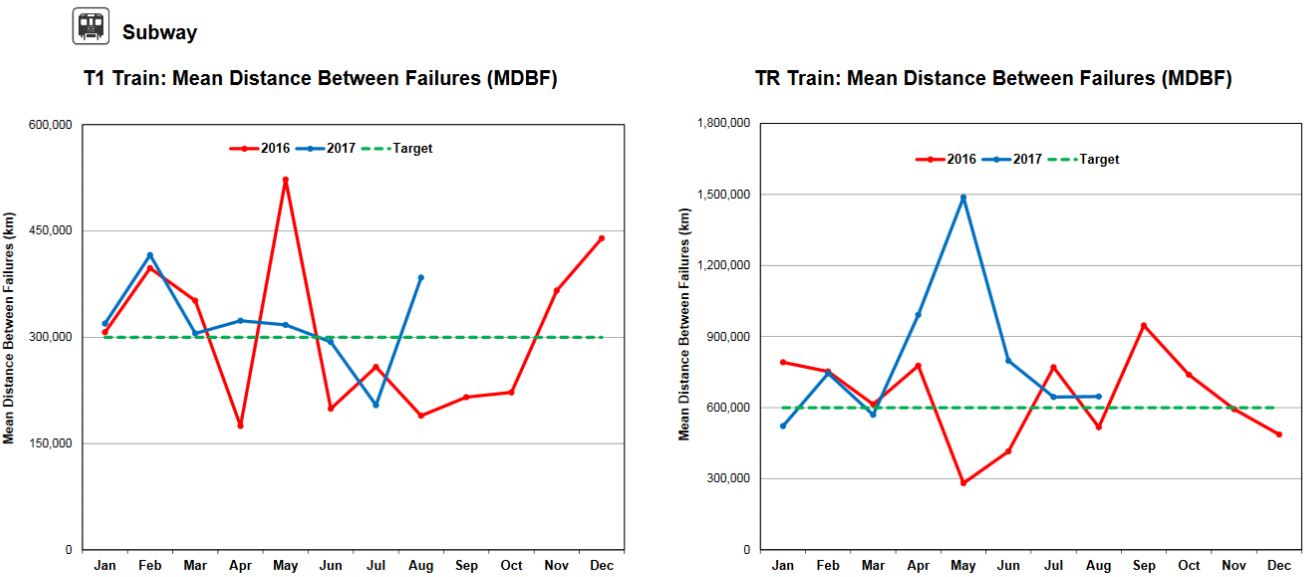
Vehicle Reliability
In the following charts, a “failure” is defined as an event causing a delay of five minutes or more.
Although there are occasional peaks of better than target reliability values, it is important to remember that the number of events per month is small. This makes the charts “spiky” because the events are not uniformly distributed. The more important issue is the long-term trend of values.
The two subsystems responsible for many of the subway delays are doors and brakes, and overhaul/retrofit programs are in progress to address them. However, the actual effect has not yet shown up in a visible trend in the data.
For the older streetcars, the reliability numbers have increased recently, especially for the ALRVs. This is due to the combined effect of major overhauls and of the retirement of the least reliable cars in the fleet.

Reliability of the new Flexity cars has improved, although it remains to be seen whether this will be sustained. As on the subway, a major source of problems lies with the doors, and the CEO’s Report states that “a major door modification program is in progress”.

Bus reliability continues to improve as new vehicles replace the worst of the older fleet, notably the Hybrids, and as the spare ratio is increased to allow more preventative maintenance.

The King Street Pilot aims to reconfigure that street between Bathurst and Jarvis Streets to give greater priority to transit and pedestrians while discouraging through auto traffic in that area. Exact details of the implementation, planned to begin in November 2017, have not yet been posted on the pilot’s website.
An important component of this work will be to measure its effect both on King Street and on the nearby road network to determine whether the new arrangements provide a benefit overall.
From the transit point of view, there are three measures by which the effect of the pilot could be judged:
- Does it improve reliability? Is the wait time for vehicles at stops improved by having more consistent headways?
- Does it improve ridership?
- Does it reduce travel times through the pilot area, or at least make them more predictable?
An important issue for the TTC is that headways entering the pilot area are determined by route behaviour some distance away. If service inbound through Parkdale is already ragged, this will not magically change in the pilot area. The only potential linkage here is that more predictable travel times through the core could lead to more reliable service on return trips from the outer ends of the line.
Within the pilot area, headways can be affected by local delays including illegally stopped vehicles and local congestion (e.g. theatres and clubs), and this is of more concern to riders awaiting an outbound trip where headways are irregular and delays trigger short turns.
Ridership is itself a challenge when the shortfall between existing service and demand is already a known problem for the streetcar routes. Unless there is an increase in capacity, handling more riders can be difficult. However, this is also related to headway reliability. If streetcars run in bunches, there is a good chance that they will be unevenly loaded and potential capacity will be wasted. Again, even headways are an issue outside of the pilot area, not only within it.
The roll out plan for new, larger streetcars shows some of them coming to 504 King in November. Whether, and to what degree, this actually happens remains to be seen. Meanwhile, the TTC has been cutting back on bus trippers on King, and they have been completely eliminated effective with the October 15, 2017 schedules for use on Queen. To what degree they might return in mid-November has not yet been announced.
The TTC and City will monitor a wide variety of transit and general traffic issues not just in the pilot area but along the affected routes of Front, Wellington, King, Adelaide, Richmond and Queen, as well as the north-south streets linking them. The latter are particularly important because they will provide the local access to segments of King that are isolated by turn restrictions. See the report for a complete list [pp 6-10].
There will be a final report to Council in late 2018, but data will be reported out through the TTC CEO’s Report (and likely other channels at the City) on a monthly basis. The page below is an example of the “dashboard” that would summarize some of the transit information. Readers of my analyses of route behaviour will know that there are challenges with monthly averages in that unusual events can be lost or smoothed out.
The question is not simply what the averages are, but how common and how large are the deviations. It is the irregularity of service that riders notice the most and which affects its perceived convenience. Too much of TTC’s performance data is already reported on an average basis thereby masking events affecting reliability.
Also, if “reliability” is judged against the TTC service standard with a six-minute wide “on time” window, this will hide almost all of the bunching and gapping effects commonly seen on King Street.

Auditor General’s Report – SSE Briefing Note
The Scarborough Subway Extension, and its replacement of the originally proposed conversion of the Scarborough RT to LRT technology, has been the matter of much bitter debate at the TTC, in Council, and in the wider community. Claims and counterclaims about the value and validity of each proposal, both in their own right and within the context of political aspirations, have included many distortions and deeply insulting remarks causing any debate to occur in a heated and very polarized climate.
In the June-July 2016 cycle of committee and Council meetings, a TTC briefing note “Issues Relating to Re-introduction of LRT Replacement for Line 3 (SRT)” appeared and this was used by subway advocates to buttress their position. In brief, they argued that the likely cost of the LRT was close enough to the already estimated cost of the subway that a reversion to LRT would save little while providing an inferior solution to Scarborough’s transit needs. This briefing note had not been made available to all members of Council, and the clear impression was that it was a private undertaking by the TTC to support the Mayor’s Office and the pro-subway position contrary to the basic policy that any staff advice should be to all of Council without favour.
This led to a formal complaint in January and February 2017:
- requesting “an examination of the circumstances involved with the decisions to construct the SSE instead of the SLRT” and alleging that the briefing note “erroneously and deliberately inflated the price of the SLRT option by approximately $1 billion”,
- requesting an investigation of whether politicians and city administrators “appropriately exercised their responsibility of stewardship over public funds” in the SSE decision, and
- requesting an investigation of whether the SSE would achieve “value for money”.
The Auditor General’s investigation and comments focus on the first of these points on the grounds that the second would amount to a review of a political decision which is outside of her jurisdiction, and that the third would be an after-the-fact audit of the completed project.
The AG concluded that:
- there was “no evidence of any lack of integrity” by the TTC in preparation of the note,
- there was “no evidence of a systemic problem of political interference” in relation to either the preparation of the note or of the ridership estimates used to justify the subway option, and
- estimates in the note were within the acceptable range of values for a project at the then-current state of design.
It is worth noting that the range for cost estimates is huge, so great that a difference of over $1 billion could be considered to be “acceptable”. This speaks to the problem that Council is presented with major spending decisions before costs are nailed down, and options could be precluded on the basis of very preliminary estimates. This is supposed to be addressed in future by the implementation of a “stage gate” mechanism to allow cost reviews when the “acceptable” range is much reduced, although it is far from clear whether this would have helped the SSE/SLRT debate. Typically, options in transit studies are narrowed down long before design and cost estimates reach a high confidence level simply because that degree of work brings expense that will be thrown away for the rejected options.
That said, the AG did find that there were problems with the distribution of the briefing note which are ascribed, in effect, to everyone thinking someone else was looking after ensuring that the note was circulated to everyone who should see it at the same time. Moreover, there was a general problem with the content of the note not fully revealing the underlying assumptions used in its content.
To that end, the AG recommended:
- That the TTC Board request their CEO “to provide more clarity in relation to the assumptions being relied on” in briefing notes.
- That City Council request the City Clerk to establish a repository for “briefing notes, bulletins, announcements and similar communications issued by City divisions and agencies” similar to the one already in use in Vancouver, and that the City Manager ensure that this database is used by all.
- That the TTC Board request their CEO to ensure that “its briefing note distribution protocols align with and seamlessly integrate with the City distribution protocols”.
The AG’s report gives an extensive history of the SSE/SLRT decision [pp 5-10] and the circumstances of the briefing note’s creation and distribution [pp 24-28]. This is useful if only to sort out the chronology. It is clear that the briefing note was originally created to support the TTC Chair and management in responding to possible questions, and that it was later shared with members of the TTC Board and others, including the Mayor’s Office, at City Hall. The ball was dropped in that both the TTC and City appeared to assume that distribution to all of Council would be handled by the other party. However, the fact that a note created to support debate at Executive Committee in late June did not find its way to the full Council until mid-July gives the impression that the information was withheld from subway critics until the last possible moment.
There may be no “smoking gun” evidence on this, but the impression is hard to escape in the highly politicized environment of this debate.
As to the content of the note, there are two major issues: ongoing changes in ridership projections and the validity of cost comparisons between the options.
Ridership
Ridership projections are a dark art, and it is no surprise that in just about any transit study they will support a preconceived desire to build or provide transit infrastructure and service, or to not do so if that is the prevailing political will. Many factors come into these projections including:
- assumptions about land use, jobs and population
- the modelled network including competing services in the same general corridor
- the target date for which demand is modelled
- the projected service level and, more generally, the access time for potential riders to transit service
- the assumed fare tariff
For example, early projections for the Sheppard Subway depended on major redevelopment near and at the Scarborough Town Centre. This has not materialized, and ironically has only recently resurfaced as part of the justification for the SSE. Projections for networks including both the SSE and SmartTrack show strong effects both from assumed service levels on ST (wider headways drive down ridership especially when an alternative is available) and from fare (will ST operate as part of the “TTC” fare zone or not).
A common response when planners are asked about these models is that they are (a) too complex and (b) there are too many permutations of factors to be boiled down into a report for public consumption. Indeed, when some of this information was requested by the Toronto Star through an FOI request, the data were released in an unformatted manner with little explanatory text that could allow easy interpretation. Either detailed presentations of the data complete with comparative explanations were withheld, or they never existed in the first place.
Over the years, projected demand for the SSE/SLRT options has ranged from a level easily achieved with LRT (high thousands per peak hour) to the low end of subway capacity (mid teens of thousands per peak hour). Although there is a plausible explanation for this as studies and assumptions evolved, there is a distinct odour that assumptions and numbers were tailored to suit the prevailing political mood. This brings us to the difficult problem of when advice is “professional” and when it is “political”.
Redevelopment and intensification of the STC district has long been a goal for Scarborough, but there is a big jump from desire to reality. One can argue that the lack of rapid transit is the reason development did not occur sooner, a chicken-egg problem that rarely addresses the many parts of Toronto and the GTHA which have developed more or less independently of transit improvements, or failed to develop even with good transit present.
The type of intensification is also important to demand projections. Jobs tend to attract many trips over short time intervals to one node, of which the core area is by far the strongest, but not the only example. Residential density creates a different type of demand, and it can just as strongly be affected by the available road network as by transit. Even today, commuting travel in Scarborough is not only to downtown, but to other places within Scarborough and to locations in the 905.
In any event, the history of the demand modelling is sufficiently cloudy that just about any number could be used with professional justification. The difficulty with past reports is that the reasons for ongoing changes have not been explained beyond the most superficial levels, and some changes conveniently coincided with new political directions. A question “what happens if we assume more development here” can be read either as a request for a professional opinion, or an attempt to get a different answer to a policy question. The boundary is difficult to pin down.
Cost Estimates
Questions about the validity of estimates for the SLRT’s cost arise from the implication that it would cost almost as much to build the LRT (just under $3 billion) as compared to the cost for the subway that was then floating about 10% higher. (Since the 2016 debate, the subway cost has risen because of greater complexity at the planned bus loop, and further increases are expected as the line reaches 30% detailed design.) Again it must be emphasized that the LRT estimate was for a seven-stop line from Kennedy Station to Sheppard and Progress, not for a one-stop Kennedy-STC link.
TTC staff reached their estimate by starting with the $1.88 billion (2010$) LRT figure and inflating it to a late 2025 opening date. The change was roughly 60% spread over 15 years including the effects of compounding. Further increases were possible because of design issues at Kennedy and Lawrence East Stations.
When Council first opted to replace the SLRT with the SSE, Metrolinx took advantage of this to simplify the design of the LRT interchange at Kennedy. The Eglinton Crosstown route, formerly at the same level as the subway tracks and under the SLRT’s loop, was moved up to concourse level taking the space the SLRT would have occupied. Reverting to the LRT plan would have required a new Kennedy design, or a change order to the Crosstown project. There is some debate as to how much this would cost and whether work had progressed to the point of no return (the revised design is under construction now).
There are also problems at Lawrence East because there is not enough room for co-existence of a SmartTrack station and an SRT or SLRT station at this site. Of course, if there were a local transit station here, the need for a SmartTrack station would evaporate.
Another issue for the LRT is the question of its maintenance facility. In early versions of the SLRT (which in turn descended from a proposed RT extension), the line would have its own carhouse at Bellamy replacing/expanding the McCowan Yard. In the Transit City network, the SLRT would share the Conlins Road carhouse with the Sheppard East LRT. Indeed, Metrolinx planned to build this carhouse and a few kilometres of track on Sheppard for vehicle testing in advance of the SLRT opening. These plans ended with the decision to build a subway extension, although initially that would have run through to Sheppard. If the SLRT is revived, it will need a carhouse and, at this point, there is no Sheppard project to share the cost.
Finally there is the question of whether part of the SLRT could have been built concurrently with existing SRT operations and at least some of the construction at Kennedy Station.
The debate here is less of the way inflation was calculated (2% in early years, but 4% for most of the project’s life) than with assumptions about the time needed to complete the project and the cost of undoing some of the design modifications.
If the City had not decided to switch to LRT back in July 2013, or at least had kept the option open pending further study, some events would not have progressed as far. However, the political reality was of a subway, no matter what, and by the time of the 2016 debate, going back to the SLRT faced not just a political battle but a technical one. Given the political will, anything could have been done, but the will to build a subway took precedence and, if anything, paths to an LRT option were closed off.
The AG concludes that the TTC’s assumption that the SLRT would have to await completion of the Crosstown as designed might have been erroneous, but she does not come down to the point of saying the TTC was wrong or deceptive on that point.
LRT or Subway
To me, this debate has been over for some time at the political level with candidates and parties in every government showing how badly they wish to support Scarborough’s dream of a subway, flawed though this might be to LRT advocates. Only a very large increase in the estimated cost of the subway project will derail it now, and even that would not be without difficulty because so much political capital has been invested in the subway option.
In parallel, there remains the question of whether the Eglinton East or Sheppard LRTs will ever be built and whether Scarborough will have a rail transit network, not simply one more subway stop and a gigantic bus terminal.
Updated October 17, 2016 at 9:00 am
Discussion of the Auditor General’s report at the TTC Board meeting was fairly low-key, although the degree to which Chair Josh Colle reiterated the vindication of staff and CEO Andy Byford did go on rather longer than necessary.
Scarborough Councillor Glenn De Baeremaeker, a strident subway advocate, was comparatively restrained in gloating over the outcome, but in his remarks showed precisely how the briefing note had been misused at Council. He reiterated the comparison of a $3 billion LRT with a $3.6 billion subway while ignoring that (a) the LRT would have served more riders over a larger area with potential for extension, and (b) the timeframe for LRT construction was misrepresented by the TTC as confirmed by the AG.
The heart of the problem is that the briefing note was not intended as a thorough review of options, but as a once-over-lightly review of the issues that could come up were the subway decision reversed. The note is written from the point of view that the subway was a done deal, not as detailed advocacy for reversing that policy. Having said that, the way the note was written and came to light at Council gives the taste of closely held information and advice, especially in the delay between its creation for an Executive Committee meeting in late June and wider appearance at the July Council meeting.
The TTC Board endorsed the AG’s recommendations, and we can only hope that there will be more transparency in the provision of advice to Council in the future.
After the meeting, in an interview of CEO Andy Byford by the Star’s Ben Spurr, the question of a future change to the subway’s projected cost came up. Byford stated quite clearly that if the SSE’s cost when the project reaches 30% design goes up too much, he will have to revisit his support for the subway option. The new estimate is expected in the spring of 2018, and Byford did not indicate the magnitude of change that would trigger his decision.
This report provides some of the details behind the integration of GO and TTC fares to provide for the recently-announced co-fare between the two systems. Under this agreement, transfers between the systems will provide a discount from the TTC fares of $1.50 for Adults and $0.55 for Seniors and Students for full fares (not passes) paid by Presto.
Several technical and administrative details are set out in the report:
- The TTC will continue to pay the full fee to Presto for transactions on its system as if the rider had paid the full fare.
- For GO-to-TTC transfers, the credit will be applied to the rider’s Presto card when they tap into the TTC.
- For TTC-to-GO transfers, the credit will be applied when the rider taps off of GO Transit because this is the point at which the GO fare is calculated.
- The exception will be for GO riders who have a default trip set on their card and who do not tap off. Their credit will be applied when they tap on to GO. [This nuance is not mentioned in the report, but was clarified by the TTC in a follow-up email.]
- This discount will replace the fare integration pilot at Rouge Hill and the Metropass sticker program at Exhibition and Danforth Stations.
- Trips using TTC, GO and a 905 system with a co-fare arrangement will receive discounts for both their TTC and 905 trip segments.
- The agreement will run to the end of the Provincial fiscal year on March 31, 2020. It will provide up to $7.15 million in the 2017-18 fiscal year, and up to $18.4 million in each if the following years.
- Metrolinx will assume the cost of implementing the discount. If the program is terminated, the cost of undoing the change, estimated at $500,000, will be shared between Metrolinx and the TTC.
- Under certain conditions, the agreement could be reopened:
- If a broader regional fare integration strategy is implemented before March 31, 2020.
- If TTC fares change, there could be a change in the discount, but absent an agreement between the parties, the discount would continue at the same rate (e.g. $1.50 per adult regardless of the level of the TTC fare).
- If quarterly reviews of actual usage and rebate payable project that the total payable to the TTC would exceed the provincial contribution caps.
The principles behind calculating the actual take up of the new discount are shown in the report, but not the actual calculation. The numbers will come from a combination of existing GO/TTC users who are already using Presto, GO users who make net new TTC trips using Presto, and riders who are completely new to the system and are attracted by the lower combined fare.
The TTC expects to see an annual ridership increase of 350,000 relative to the approximately 8 million rides that will receive the discount. This shows that the overwhelming beneficiaries of the change will be existing GO Transit users.
It is truly astounding to think that undoing this fare change would cost $500,000 for software modifications (which should consist simply of an “on/off switch”) plus any updates to signage and other channels of customer information. This says something about the design and implementation of the Presto system.
From a political point of view, the new co-fare is an attempt to show that “something is happening” on fare integration despite a long deadlock on the question of what a regional fare scheme would actually look like. It also allows Mayor Tory to claim “progress” toward a “SmartTrack” fare on GO Transit even though it is actually a TTC fare discount with the much larger hurdle of GO fares yet to be addressed. The report notes:
The combined cost of travel using both GO/UP and TTC is a barrier to GTHA fare integration and discourages use of GO services within the city of Toronto. [p 3]
It is the much higher GO fare that is the primary barrier, and even if travel on the TTC leg of a journey were free.
The report notes that two-hour timed transfers are already available between systems in the 905, and that:
Providing discounts for GO-TTC and 905-TTC customers would encourage more cross-boundary ridership using multiple transit systems. [p 4]
The new co-fare addresses the first part of this (GO/TTC), but leaves 905-TTC riders with no improvement.
Furthermore:
GO pricing is such that GO trips within the city of Toronto are priced significantly higher than comparable trips on the TTC. Amending the GO fare structure to address this issue will encourage better use of all transit services within Toronto. [p 4]
The situation is not simply one of providing co-fares, but:
… concession, transfers and fare products should be harmonized to simplify the rules for customers when travelling between GTHA transit systems. [p 4]
What this will actually translate into will depend in part on whether “integration” is used as a sledgehammer to flatten all fare policies to a common scheme, or if local options such as free rides for children within Toronto or discounts for low-income groups could remain. Local discounts should be possible, but “the computer can’t do it” is a too common excuse to end discussions.
An important as-yet unsettled issue is the integration of fares on the portion of the new Vaughan subway extension that will serve 905-based riders.
Upon the adoption of a fare discount, TTC and GO will continue to work together to adjust the York University GO bus/rail service to feed into the Line 1 Subway Extension to Vaughan. Concurrently, the TTC, City of Toronto and Metrolinx will continue to work towards greater GTHA fare integration. [p 6]
Even if arrangements with GO are sorted out, this leaves York U commuters who now ride local 905 services into the campus with a double fare. There is no agreement yet as to which government(s) would fund reduced or free travel on the subway between York U and local services at stations further north.
Updated October 17 at 9:20 am
During discussion of this report, a question arose about whether the TTC Board was on record as opposing fare-by-distance. Back in December 2015, the Board approved staff recommendations that included:
3. Approve that no further analysis is required at this time for:
a. 2 hour time-based transfers
b. all-door boarding on buses
c. fare by distance/zone
d. cash fare proof-of-payment receipt for bus customers
The key phrase here is “at this time”, and it is easy to read between the lines of staff remarks that the FBD option is still an active proposal at Metrolinx. Comments at the Metrolinx Board suggest that other methods of “regional integration” could well be an “interim” step beyond which the fare structure never progresses. The most obvious part of such a scheme would be to provide two-hour transfers across the 416/905 boundary with Presto so that a trip could begin and end on any local transit system without facing a full extra fare at the Toronto boundary.
The estimated cost of such a scheme would be $20-30 million annually, of which the TTC would be responsible for half.
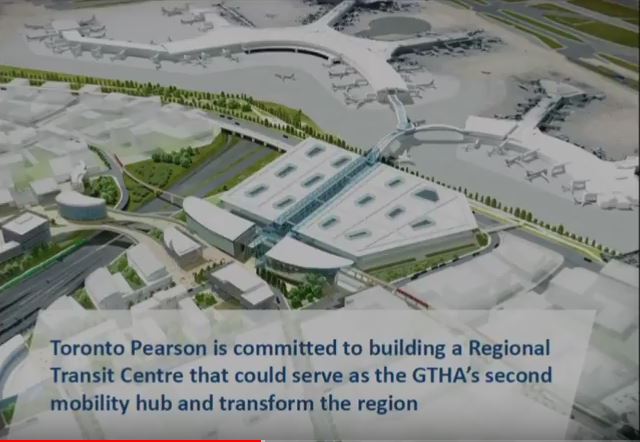
A Mobility Hub at Toronto Pearson Airport
[The illustrations in this section are taken from the GTAA’s presentation as captured on the TTC’s YouTube record of the meeting.]
Hillary Marshall, Vice President of the Greater Toronto Airport Authority for Stakeholder Relations and Communications, presented an overview of plans for a large “mobility hub” at Pearson Airport. The hub would be located on the north side of Terminal 3, and would be linked to the existing terminals with an internal circulation train. Some reconfiguration of these terminals may be required, but there are already plans to revise the airport to cope with increasing demand.
The GTAA has ambitions to become a first tier airport with over 50 million air passengers per year, but it lies far beyond major airports in Europe and Asia in the proportion of travellers who reach the airport via transit. Pearson’s transit share is just under 10% while transit provides far more of airport access internationally. Even Vancouver’s airport is over 30% showing how Toronto has fallen severely behind.

This shows how easy it has been for a major destination in the GTA to depend on road access thanks to huge investments in highways serving the western part of Toronto, but eventually that road space filled up. Now Pearson and the many businesses clustered around the airport face limits on growth.
An important component of the hub will be extensions of the Eglinton West and Finch West LRT lines as well as the Mississauga busway. Further in the future, access to the rail corridor and services including GO/RER and a high speed line to southwestern Ontario must be improved. The UPX link now in place only serves trains coming from downtown.
When UPX was opened with much fanfare, an issue regarding its usefulness was the degree to which airport trips do not originate downtown. If the transit share is to be increased, then transit must serve where passengers and airport district workers actually are and this requires a much more extensive network of services. Even though a transit map of the airport today shows many lines radiating from it, none of them is a frequent service capable of handling a major share of the overall demand.

Passenger handling at the airport would be fundamentally reorganized with the hub acting as the check-in area for all flights, and the air terminals becoming the secure side of the airport. This plus other circulation needs will require substantially more capacity and coverage than the existing airport link train provides, but this was not addressed by the presentation. An important distinction in travel to “the airport” is that it is a huge district, with jobs and supporting businesses spread over an area comparable to downtown Toronto. Getting someone to Pearson does not provide them with convenient access to or circulation around that extended area.

Studies are planned of transit services coming into the airport, and these are expected to take two years or so. An option raised by Chair Josh Colle was to loop the Eglinton and Finch LRT lines as a through service. Whether this is operationally feasible remains to be seen, but it is refreshing to see LRT lines discussed as part of improved circulation and development in this very car-oriented part of Toronto.
Vice Chair Alan Heisey asked about the jurisdictional vacuum in regional planning and why this proposal had not come from Metrolinx. Heisey also noted that wayfinding at the airport for basic transit service, the 192 bus to Kipling Station, has been less then helpful compared to other revenue-generating options such as taxis and limos.
Marshall replied that Metrolinx has flagged the airport as a major centre in its plans, but there are many stakeholders in the area. The GTAA is a federal agency, and their interest in becoming a major transit centre is comparatively recent. Indeed, their focus on parking revenue produced an absurd proposal to charge Metrolinx for every UPX passenger to offset lost parking fees. This proposal was dropped before UPX began operation, but that it could even be floated shows how blinkered the GTAA’s thinking was. When Transit City and the Eglinton West LRT was first proposed, the GTAA was not interested. The issue now is growth, and without better transit, growth is impossible.
As for signage at the airport, Marshall stated that improvements are now in progress with Terminal 1 already done and Terminal 3 in progress.
The first phase of the new hub, with a hoped-for opening date in 2027, will cost about $500 million and this will be funded by the GTAA. They might also assist with the capital cost of transit links, but operating funding is an issue for future discussion.
Update on Service Reliability
As part of the CEO’s Report, Rick Leary made a short presentation on efforts to improve service reliability by adjusting schedules to match actual route conditions. For three routes he showed both the “on time” performance for the past three years and short turn counts.
-

- 60 Steeles On Time Performance
-

- 60 Steeles West Short Turns
-
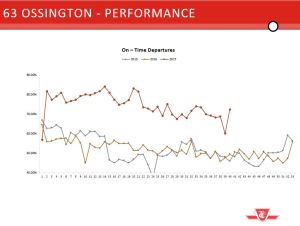
- 63 Ossington On Time Performance
-

- 63 Ossington Short Turns
-

- 7 Bathurst On Time Performance
-

- 7 Bathurst Short Turns
As I have discussed on this site before, “on time” means that a vehicle left the terminal within a six minute range (1 minute early to 5 minutes late) of its scheduled time. The performance charts do not give any indication of how reliability may have declined as vehicles travelled along the route. Moreover, data are averaged by week and the degree of variability by time of day or date is smoothed out by this presentation.
There is no doubt that the values improved following schedule changes, but the problem of irregular service is still present on many routes. I will be exploring this for a selection of suburban bus routes later this fall after I receive September and October tracking data.
In 2018, the TTC plans to continue with schedule adjustments to improve performance on many routes as shown in this map.

Bus and Streetcar Fleet Planning
Rick Leary also made a presentation on the situation with the bus and streetcar fleets where there are constraints on bus service because Bombardier is late in delivery of the new streetcars.
At the September Board meeting, there was discussion of delaying part of a pending bus purchase so that it could be redirected to some form of new technology bus. Leary explained that the TTC faces a large requirement to procure new buses, and only some of this is covered by the federal PTIF program as it is currently structured.
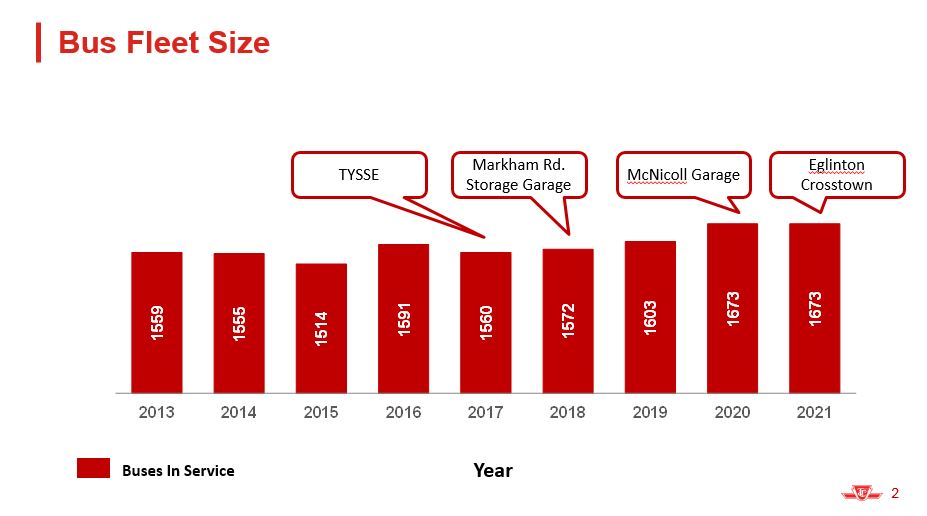

The chart showing the bus fleet size refers to vehicles required for service, not to the total fleet which includes various classes of spares: buses available to replace vehicles that fail in service (change offs), regular maintenance spares, major overhaul spares and warranty spares (retrofits to recently purchased buses).
The reduction in service in 2015 was implemented to increase the spare pool and allow more preventative maintenance to occur, and this continued into 2016. In late 2017, the TYSSE will open and this reduces the overall fleet requirement, although some buses will be reallocated to service changes elsewhere in the network.
In 2018, an additional storage space at Malvern Garage will give that crowded site a bit more elbow room. Buses will be allocated to service improvements and to offset delays from Crosstown construction activities.
McNicoll Garage opens in 2020 and this will allow the fleet to grow. Much of the new space will be used to accommodate buses from existing overcrowded garages.
When the Crosstown line opens in 2021, the fleet will stay the same size, but many buses will become available for use on other routes.
On the procurement side, the TTC has many vehicles that are in striking distance of retirement, particularly now that the target is 12 years, not the former 18. Although the City would like the TTC to flatten out its purchase quantities, every so often a grant program comes along that encourages the purchase of many buses in a short period. That is the origin of the nine-year old bulge in the fleet demographics.
The green box shows the vehicles for which replacements are on order, and but there are over 400 buses for which a replacement must be sought in the next few years.
Under current plans, the last of the vehicles whose emissions trouble the Ministry of Environment should be retired by the third quarter of 2018 leaving only Hybrids or Clean Diesels in the fleet.
Changes in maintenance practices are improving vehicle reliability (see the CEO’s report for details) and even the Hybrids, once reviled as bad buses, achieved 15,300 km MDBF (meam distance before failure) in summer 2017. This begs the question of what proportion of the TTC’s problems with this portion of the fleet was simply a case of inadequate preventative maintenance, or conversely whether the hybrids needed more than the TTC was willing to give based on their experience with diesels.
In any event, the number of daily in service failures requiring change-offs has been dropping for some time.

Meanwhile, the situation on the streetcar fleet is much different. The “contract baseline” chart below shows the demographics for the streetcar fleet that would exist if Bombardier held to their original delivery schedule for Flexitys, while the “current status” chart shows the actual situation. Considering that the design life for the CLRV and ALRV fleets (the older cars) was only 30 years, the fact that they continue to run is impressive, but there are limits to what the TTC can do. An overhaul program is rebuilding a portion of each fleet, but nowhere near all, and one challenge is to find cars in good enough shape to put through the program. Also, several of the cars counted below are actually being used for spare parts to keep the rest of the fleet running, and the available fleet is smaller than the numbers shown here.


The changeoff rate on the streetcar routes continues to rise.

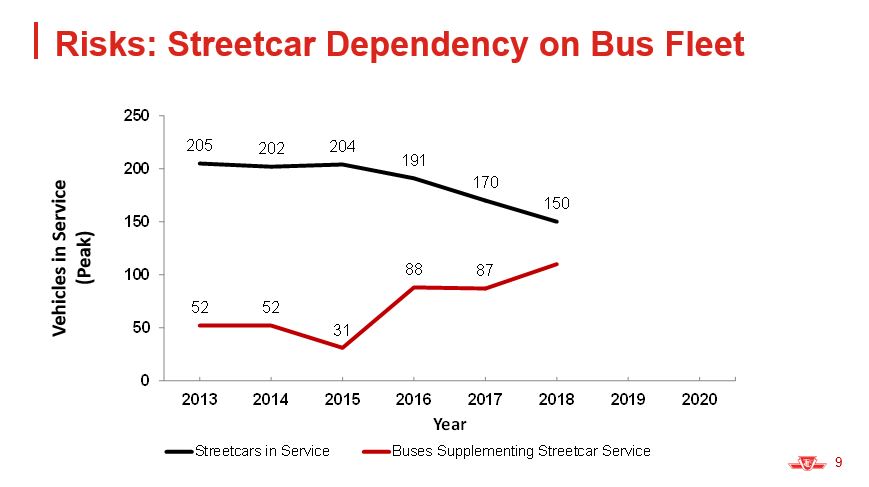
Vehicle reliability showed an upturn (see the CEO’s report) in the most recent period, but this could well be due to the relatively small number of cars in service with bus replacements operating on several routes, notably on 501 Queen. The TTC’s ability to field the required service on all of the streetcar routes is limited by the number of cars available. Until the rate of Flexity deliveries overtakes the rate of old streetcar retirements, the TTC cannot get ahead of the game. This makes the planned ramp up of production to almost 2 cars/week from Bombardier critical, and they have yet to demonstrate that capability.
Meanwhile, the TTC projects that the need for buses running on streetcar routes will continue to increase in 2018 as the availability of old cars declines. I plan to explore these numbers further because 2017 was a particularly bad year for needing buses on streetcar routes with replacements or parallel services on a very long list of routes. Some of this was thanks to construction, and some to the vehicle shortage. In any event, looking at plans for 2018 where there is no equivalent scope of work to the many projects on 501 Queen in 2017, the demand for buses should fall offsetting some old vehicle retirements.
TTC staff plan to bring forward a “Green Bus” proposal in November (responding to the Board’s direction in September). Reading between the lines of some comments at the Board meeting, they appear intent on using the streetcar/bus vehicle shortage to justify accelerating new vehicle purchases and simultaneously improving their ability to replace streetcars.
If Bombardier does not get its act together soon, Toronto could be facing a serious threat to the future scope of its streetcar network just at a time when population patterns require considerably more service on the areas that network serves.
All of these projections assume a minimal increase in TTC service over coming years in response to budget pressures and to the limit on garage space. Later this year, the TTC will present a Ridership Growth Strategy, and the challenge will be how to tell an upbeat story of better service when past decisions about budgets, garages and fleets have left the TTC with inadequate resources to handle more demand, should it materialize.
Background Data on Bus Emissions
- Conventional Diesel = 73.9L/100km; 2.02kg CO2/km
- Clean Diesel = 53L/100km; 1.45kg CO2/km
- 1st Generation Hybrid = 52.3L/100km; 1.43kg CO2/km – 30% lower than Conventional Diesel
- CNG = 1.23kg CO2/km – 39% lower than Conventional Diesel
- 2nd Generation Hybrid (2017) = 40L/100km; 1.09kg C02/km – 46 % lower than Conventional Diesel
(Average bus mileage for 1 year is appox. 70,000km)
[Source: Notes to TTC presentation slides]
While there are arguments that “clean diesel” is a misnomer, the figures above show that there is an improvement compared to conventional diesels. However, that type of engine has almost completely passed out of use and is no longer a valid comparator.
The issue for any new “green” bus will be how it compares to technologies the TTC is actually using, and what the cost of that improvement might be both in up front capital and ongoing operating/maintenance costs, not to mention wider social costs and benefits.

The LRT would have ended at Sheppard and Progress, not Finch and Progress (which does not exist).
Steve: Thanks for catching that. I will fix the article. It was the potential extension that would have gone further north to Malvern, but that was not part of the 7-stop LRT cost estimate.
LikeLike
Hello Steve, Did you see if my correspondence was added to the agenda? Thanks for your reply.
Steve: Unless they add it to the online agenda, it’s invisible because there is no longer a printed agenda or correspondence package at the meetings.
LikeLike
This is off topic but I’m wondering about the new Presto fare gates that are being put in, especially at automatic entrances. Any reason why no provisions have been made to put them at full height? There have been instances where less-than-savoury characters have been clambering over them for fare evasion purposes, Lawrence West being the best example that I have seen so far.
Steve: This is the TTC’s way of doing entrances now, and it will be interesting to see how much fraud there is not just at secondary entrances, but at primary ones when the former collector, now a roving station agent, is not standing by.
LikeLike
In London every tube station has someone there to help with passenger flow and monitor the gates. There is always someone there to spot fare evasion along with helping passengers.
Mind you, they are not as compelled to make things accessible and there is only one exit/entrance in many cases.
This will be fun to watch because I can see them crying foul when they are scrambling to find more money to cover for the fare evasion. I wonder if they will say “oh s**t” and replace the automatic gates eventually with something like STC where is essentially a two stage vault. You enter the vault and the other door opens once the other one closes. You cannot open the first door to enter the vault without first swiping a metropass or Presto Card. This is at the Brian Harrison Way exit.
Steve: A change in “TTC Culture” will be required. Ever since construction started on the new gates at Broadview Station, the little sign saying that the collector is away and will be back soon is much more commonly seen. Monitoring the formerly “automatic” entrances will require more bodies, and yet under the new station management scheme, they are also supposed to be roving about checking on the station and providing assistance to riders. The whole thing is not well thought-out.
LikeLike
The one thing to keep in mind as well is that many of these automatic entrances were originally supposed to be staffed as denoted by the collector booths there.
When first constructed nobody would have considered they would put these gates in otherwise the stations would have been designed differently.
LikeLike