Updated September 22, 2016 at 11:30 am: Information from the Budget Committee meeting has been added. It is organized by topic so that readers do not have to wade through the meandering nature of a discussion that lasted a few hours.
Fare Evasion:
This topic came up early in response to a deputation from TTC Riders. Commissioner Byers asked whether money could be saved by reducing evasion. TTC management claims that the numbers remain low, but later came to acknowledge that increasing the fare inspection from 80 to 100 would be beneficial. The committee requested that this be addressed in the overall budget.
For reference, a fare inspector costs the TTC at least $100k/year including benefits, and so 20 more would represent an increased operating cost of at least $2 million. Fare revenue stands at about $1.1 billion, and a 1% change in fare recoveries (either way) is worth about $11m annually. The TTC would like to get the fare evasion rate down to 2% or less.
CEO Andy Byford noted that the intent of inspection is to make the chance of being caught and the penalty for this both high enough that few attempt to evade fares. Inspection will actually become more labour intensive with the shift to Presto because the cards must be scanned to determine whether a fare has been paid, while transfers and Metropasses can be quickly checked visually.
Service on Lightly Used Routes
Commissioner Byers also asked whether there were savings to be had by cutting service where buses were running “empty”. This is a complex issue for several reasons.
Before the TTC returned to guaranteed full service on all routes (a John Tory initiative to reverse one of Rob Ford’s cuts), a standard was developed to screen out the worst performers. The metric used was riders per vehicle hour, and the value was set at 10. In other words, if there are two buses on a route, they must carry at least 20 riders per hour between them. Note that these riders are not on the buses all at the same time, but the loads will often be concentrated in location and direction. This leaves the bus running “empty” some of the time.
Many routes have outer edges and branches that do not achieve the same level of demand as the core part of the system. If one were to look only at these sections, one could prune the “poor performing” bits around the edges. However, this would leave major routes operating on a shorter extent than during “normal” hours, and the degree of cutback would vary from place to place. This is a recipe for riders abandoning routes because they are unsure of when service will be available, or that they might miss the “last bus” for a trip home.
Without question, riders on these segments are carried at a higher cost, but that is part of the cost of doing business on a network. One might also add that there is a double standard where it is acceptable to subsidize riders on a subway line at a very high rate, while decrying the “waste” of such an expense on a bus route.
This issue comes up regularly, and there is an underlying implication that vast amounts of public money are wasted where service is not required. The actual numbers tell a very different story.
When the full service to all routes was restored, the cost to do so was pegged at $1.7m for the partial year implementation in 2015, and at $5.5m for the projected full year cost in 2016. This shows that the amount of money available if the policy were reversed is marginal unless the standard for “poor performance” is set much higher and correspondingly more service disappears.
Provincial Subsidy
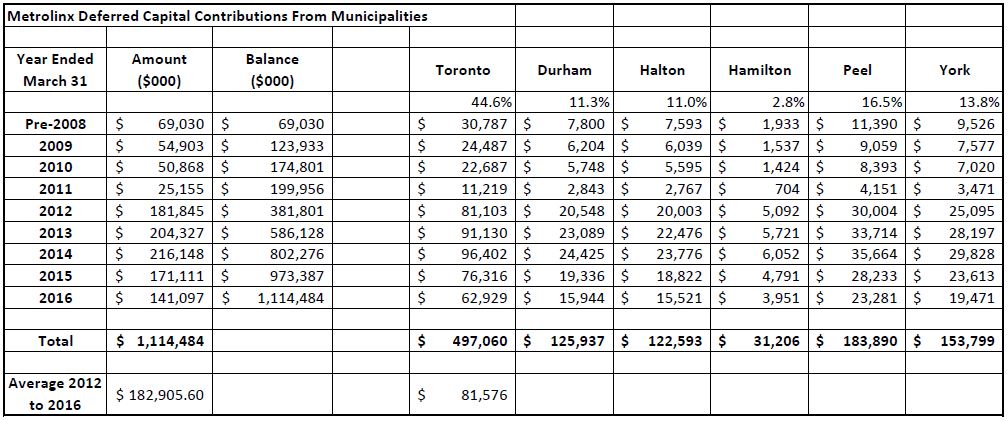
Commissioner Mihevc raised the perennial question of getting more money from Queen’s Park as an alternative to higher fares, taxes or service cuts. In doing so, he is longing for an era over two decades ago when Ontario paid 50% of the TTC’s operating subsidy, an amount that would roughly have been $305m in 2016. The actual subsidy from Queen’s Park is about $90m which comes from the Provincial Gas Tax allocated to the City of Toronto (a further $70m from this source goes to the Capital Budget).
Queen’s Park might be forgiven for wondering whether any new transit cash would actually improve the TTC’s lot, or simply be used to reduce City expenses and preserve lower property taxes and/or fares. Recent sleight-of-hand in the Capital Budget where nearly $1 billion of proposed expenditures simply vanished from the books, thereby neatly providing the City’s “contribution” to a shared federal-municipal funding scheme at no cost suggest that senior governments are right to distrust municipal intentions.
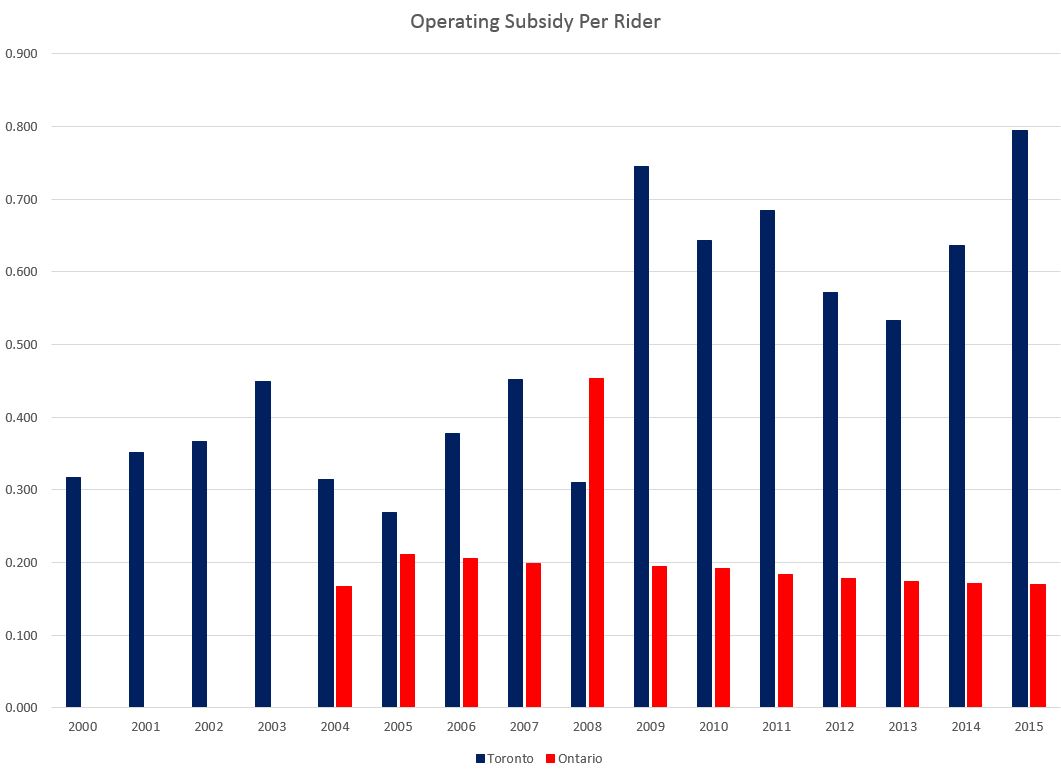
Mihevc claimed that the subsidy per rider was higher under Mayor Miller. The actual numbers appear in the chart below. Miller’s last budget year was 2010. Note that except for 2008, the provincial gas tax contribution has remained constant, but on a per rider basis is declining due to growth.

Where Is The Additional Service?
TTC Riders observed that people at a Jane-Finch community meeting laughed when told that the TTC had increased service. The problem here is that the service adds vary by time of day and location, and not all riders benefit equally. There is also the discrepancy between advertised and actual service as I have discussed in other articles.
The following are changes in the Jane-Finch area between September 2014 (pre-election) schedules and those in use today:
                2014       2016

35 Jane
AM Peak         5'00"      4'45"
M-F Midday      8'00"      6'15"
M-F Evening     11'00"     10'00"
Sun Morning     11'00"     10'00"
Sun Afternoon   10'30"     10'00"

195 Jane Rocket
AM Peak         10'30"     10'00"

36 Finch West
AM Peak         3'00"      3'37" *
M-F Midday      5'00"      5'20" *
PM Peak         3'34"      4'37" *
M-F Early Eve   7'15"      7'45" *
M-F Late Eve    7'30"      9'20" *
Sat Early AM    9'00"      9'30"
Sat Morning     6'30"      6'00"
Sat Afternoon   5'30"      4'30"
Sat Early Eve   9'00"      8'00"
Sun Early AM    10'30"     10'00"
Sun Morning     6'45"      6'30"
Sun Afternoon   5'30"      5'00"
Sun Early Eve   9'00"      7'15"
Sun Late Eve    11'15"     10'00"
* Changed from regular to articulated buses on 36A Humberwood service.
Saving 2.6 Percent
Roughly two thirds of the $15.8m savings cited by TTC management came from reduced Health Care costs. The reason cited for this is that the ongoing investigations into Benefits Fraud have resulted in lower claims. This effect will bottom out at some point, and so further savings in 2018 cannot be counted on.
In a “normal” year, the $15.8m would have been part of the overall budgetary review, but because of the Council request for an across the board 2.6% cut, these have been separately identified. What has not yet been addressed is the remaining $172m shortfall between the City subsidy and the TTC’s projected needs.
Saving $172 Million
TTC management has a long list of requirements totalling $172m, although they continue review of their budget to see if added savings can be found that do not affect service quality. Andy Byford strongly made the point that he does not plan to cut service. We will have to see what Council and the TTC Board actually direct him to achieve.
The 2016 budget provided for service improvements in September 2016, but these are not required according to the TTC because ridership is lower than anticipated. There has been no public review of actual loading conditions and whether there are routes requiring more service. A common problem is that for peak service the TTC has no spare vehicles, and so budgeted improvements could not be implemented even if the loading standards showed they were required. In years past, the TTC would list the improvements that could not be made due to various constraints (typically fleet, budget and availability of operators), but this list has not been published recently.
Much of the “savings” against the originally foreseen $215m budget pressure does not arise from management actions. The delay in Presto rollout is laid at the feet of that agency (see below), and the saving is simply a case of delaying the onset of the more expensive period where TTC and Presto fare collection systems and staff co-exist. The draw from the “stabilization reserve” (surplus subsidy from past years that was not required) will exhaust this reserve in 2017 even though 2018 is expected to be a difficult budget year too.
TTC management often cites “savings” in diesel fuel costs through hedging, and claims an $11m saving for 2017. The total fuel budget for 2016 was $84m, itself down almost $10m from 2015. How much of this reduction is simply a question of market pricing and how much comes from hedging is not broken out. One is a management tactic while the other is simply good fortune that would be reversed if fuel costs go up again. Indeed, this saving will be offset in 2017 by carbon taxes.
The problems with Presto arise from two issues:
- Presto’s IT provider (Accenture) has not yet provisioned sufficient back-office computing power to handle the volume of transactions that Metropass sales will generate. This is being remedied, but will delay the rollout.
- The delivery of fare media vending machines from Presto is running late, and station collector staff cannot be reduced/redeployed because they will continue to sell legacy media.
Commissioner Myers described Presto as a “mini Bombardier” in their inability to deliver a product on time. It would appear that Presto faces a similar problem – the lack of investment in sufficient capacity.
Long Term Savings
The TTC is midway through many changes in how it does business such as the replacement of its archaic vehicle monitoring system and the implementation of computer systems using modern, integrated software. These are expected to produce savings once completed, but there is a short-term hump while changes are developed and implemented.
The Committee asked management to produce a report listing all of the projects together with their projected costs and savings so that short-term funding increases can be justified as “investments” in future savings. The Catch-22 here, of course, is that those savings will have to actually materialize. A more common situation is that new systems and procedures allow improved or expanded functionality and service, part of the justification for undertaking them, but do not necessarily reduce costs.
Collective Bargaining Agreements
The current agreements run into 2018 and bind the TTC to cost increases. In preparation for the next round of negotiations, they will continue to examine ways to reduce costs, but this issue is not debated publicly unless it explodes into the media from specific proposals.
How The Budget Works
Commissioner Campbell is frustrated by the way in which the budget is presented, notably that it shows previous year budget figures, not actual results, as the basis for comparison. One problem here is that work on “next year’s” budget often starts before “last year’s” numbers are finalized, but more generally this is an issue with municipal budgets generally. The use of previous budgets as a starting point is not a problem if budget and actual numbers do not vary by much, but this can be thrown off by unexpected revenue or cost changes.
Moreover, Council is always wrestling with amounts at the margins. For example, the TTC subsidy is almost $500m, but a 1% change in the gross costs (the full budget, not the net after fares and other revenue) amounts to about $17m, equivalent to roughly a 0.6% property tax hike. Moreover, if that $17m were to be entirely recovered through subsidy, it would represent a 3.4% increase on that $500m base sending the budget hawks screaming about “out of control” costs.
Ridership
Ridership changes occur at different rates both by time of day and by location. The overall numbers appear in the monthly CEO’s Report, and a current issue is whether the downturn will be sustained or if it is a short-term effect. Ridership for 2016 is up slightly over 2015, but not by the amount originally forecast.
This is an underlying problem with TTC budgets. At times, simply to produce more revenue on paper and thereby reduce the “required” subsidy, the TTC has aimed high for ridership. Many times, they got away with this, but the tactic failed in 2016. The shortfall (as the numbers above show) represent large percentage hits relative to the subsidy and this creates a funding crisis thanks to overly optimistic projections. Conversely if the TTC aims low, but does better than expected, it is criticized for demanding too much.
Commissioner Mihevc observed that an 8 million drop in projected ridership came with a projected revenue loss of $32m, or $4 per ride. Management explained that there was actually an offsetting additional 4m free rides by children meaning that for paying customers, the shortfall was actually 12m rides at a cost of about $2.65 each. This value is still higher than the average fare paid, and the discrepancy has not been fully explained.
The modal share is growing downtown, according to Deputy CEO Chris Upfold, but falling elsewhere. The boundaries of this effect were not discussed, and we will not have a detailed look at the issue until the 2016 Transportation Tomorrow Survey reports out sometime next year. (This is a quinquennial survey conducted by the University of Toronto for the Ministry of Transportation and many other agencies/cities.)
Problems with capacity arise from a lack of sufficient fleet to carry riders coupled with the ongoing effects of service delays and interruptions. For example, service capacity on 504 King is planned to be substantially improved, but this will require a fleet of new low floor streetcars.
TTC management routinely cites employment stats as the closest indicator of ridership. However, this number is affected by many factors including:
- Core area jobs tend to have conventional hours and produce the well known peak travel effects on transit.
- Off peak workers and those located outside of the core face the double challenge of lower service levels and a network that is not oriented to their travel requirements.
- Many jobs are now part time, and more trips are required for a worker to get between them.
Off-peak service levels and reliability can work against making transit attractive for many outside of the core because of long travel times and transfer connections at inhospitable locations.
The Budget Committee appeared to be interested in more details about the times, locations and causes of demand changes, but did not actually pass a motion to this effect. Chris Upfold remarked that the drop has not been concentrated in specific times and locations (although this contradicts an earlier comment about modal share), and that the TTC does not have the technology to track riding in detail. This begs the question of how they track riding at all, and what data they do have on route behaviour.
Wheel-Trans
Wheel-Trans is a large growth area in the TTC’s budget thanks to several factors:
- 12-13% increase in basic demand.
- 5% increase in demand due to new eligibility criteria.
- Improved call centre performance means fewer calls are abandoned and more rides are booked.
- The unaccommodated rate (requests that got through, but could not be booked) has dropped from 2% to under .5%.
Chair Josh Colle would like to see Queen’s Park contribute to the cost of Wheel-Trans given that it is provincial legislation driving some of the growth. Given that transportation is considered as a human right, this is a cost that must be widely absorbed just as businesses deal with the cost of accessibility and accommodation. For several years, the TTC held its elevator program hostage to demands for more provincial funding, but that charade ended in 2016 when the Easier Access program moved back into the “funded” part of the Capital Budget.
Toronto faces additional costs, and it’s time for Council to accept the responsibility.
Commissioner Campbell moved that staff report on the option of letting registered WT users ride for free on the conventional system so that at least some trips might be diverted. This gets into a difficult territory of the general problem of groups who ask for reduced TTC fares, a population substantially larger than the WT community. This really should be dealt with as part of the City’s overall review of subsidy programs, not as a one-off scheme to avoid WT costs at the TTC.
The original post follows below.
Continue reading →