TTC Transfers: 1954/55

Transfers as a physical fare medium are set to disappear from the TTC in 2017 with the completion of the migration to Presto fare cards.

Here are the transfers as they existed in 1954 and 1955, the first year of the “Toronto Transit Commission” by that name. These include many suburban bus routes that were amalgamated into the TTC’s network with the formation of Metropolitan Toronto in 1954.

A few items worth noting:

  • Many of the suburban routes used red ink on white paper as a distinct colour scheme to identify cases where a check for a “zone 1” fare on a city route would be necessary. When coloured paper was abandoned for the older routes, Carlton was already using the “suburban” colour scheme and was missed in the conversion. For many years, it was the only “downtown” route with a red transfer.
  • There are two Yonge transfers. One is for the “Yonge T.C.”, the trolley coach operation from Eglinton to Glen Echo. The other, simply “Yonge” might suggest that the streetcars were still operating in 1955 over a year after the subway opened. This is for the night service.
  • Many route names are recognizable, but the outer ends of the suburban routes are a lot closer to the old city than they are today.
  • The text on the back of the transfer exhorting riders to only make their connections in the proper TTC way has not changed in years (it can be found on transfers from 1921). The use of the word “Conductor” is amusing considering that by 1955 two-man operation had ended. The term even appears on bus transfers.
  • “Up” and “Down” refer to directions of travel and correspond to the “U” and “D” cutoffs along the edge of the transfer. Generally, “Up” is westbound or northbound, but there are exceptions sometimes caused by route changes and amalgamations with segments in the “wrong” direction.

For a look at pre-TTC transfers, please refer to this article.

TTC Budgets for 2016: City Analyst Preliminary Notes

As the budget cycle begins, analysts from the City’s Finance Division publish reviews of the budgets submitted by every department and agency. These will eventually show up on the City’s general “budget” website, but most of them are now part of the agenda for the Budget Committee’s meeting of January 5, 2016. This article reviews the notes for the TTC’s Operating and Capital budgets.

All illustrations within this article are clickable for a larger version.

Operating Budget

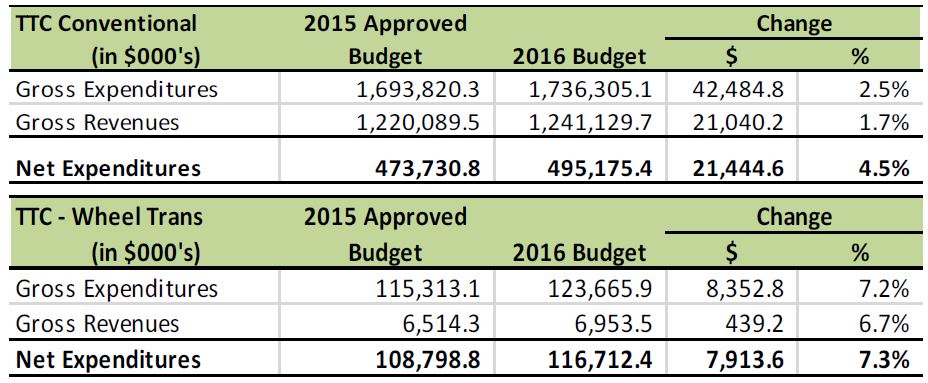
The notes begin with an overview of the “conventional” and “Wheel-Trans” budgets:

PrelimANotes_OpsSummary

This chart shows how the total budget, fares and subsidies interact. Although the gross expenditure for the conventional system goes up 2.5%, the subsidy goes up by 4.5% because revenues do not keep pace. There is always a tug of war between providing more service to handle both growth and political promises, while keeping fares down, again for political reasons. Council can hardly complain that the subsidy grows well above the inflation rate under these circumstances.

For Wheel-Trans, the growth of the subsidy is dictated almost entirely by the growth in costs because so little farebox revenue comes from that service. Ridership is growing thanks to eligibility changes and increased service, while fares grow by only a small amount.

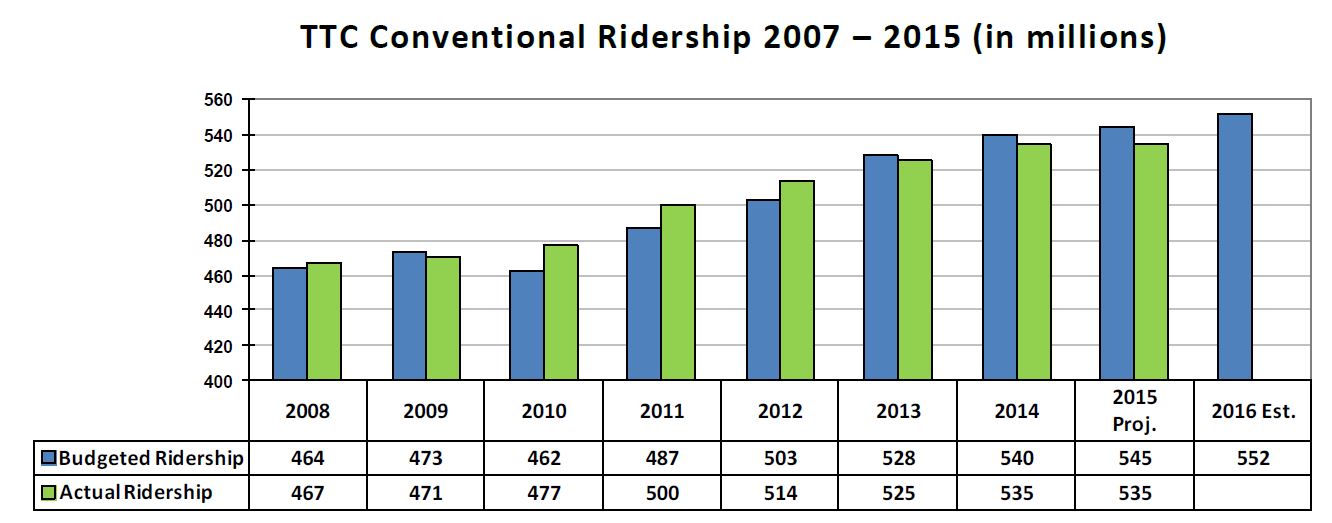
On the conventional system, ridership has not been growing at the expected rate not just in 2015 but for a few years previous. The routine claim from TTC is that this is due to bad weather in early 2015, but this does not explain the ongoing shortfall in previous years, nor the fact that ridership continues to run below budget into the fall of 2015 when the weather, if anything, has been quite balmy.

PrelimANotes_OpsRidership

Since 2013, actual ridership has been below budget, and the 552-million figure for 2016 shown here will be a challenging target to meet.

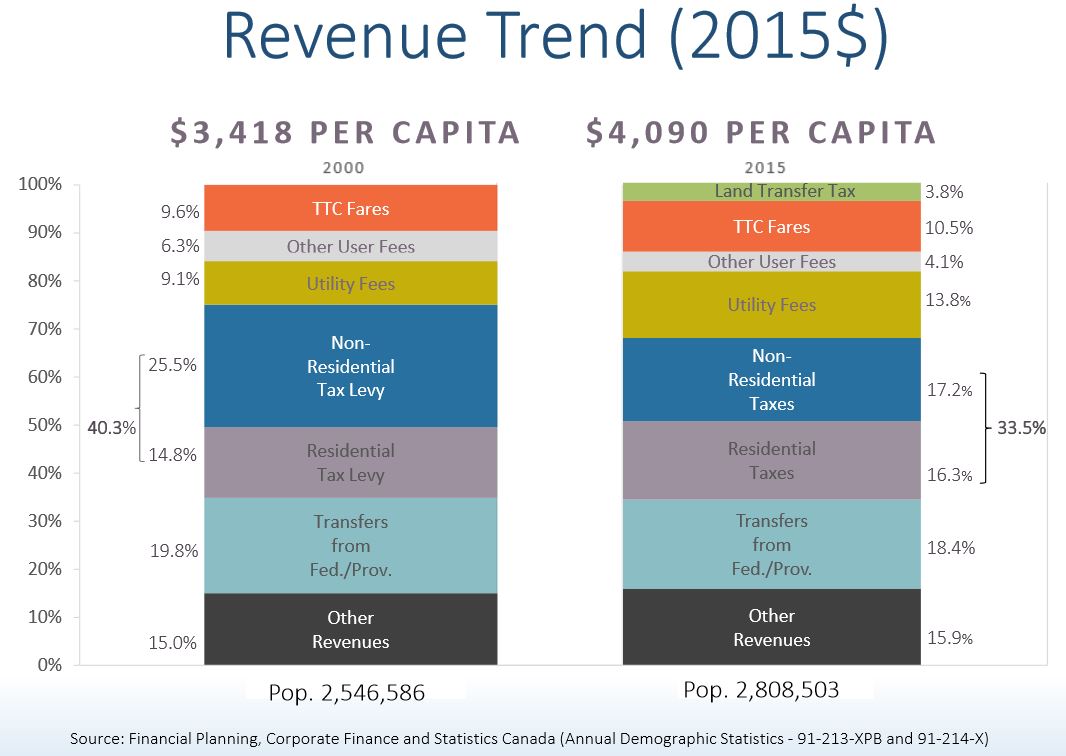
The TTC is funded primarily by fares, with much of the remainder coming from subsidies.

PrelimANotes_OpsSourceOfFunds

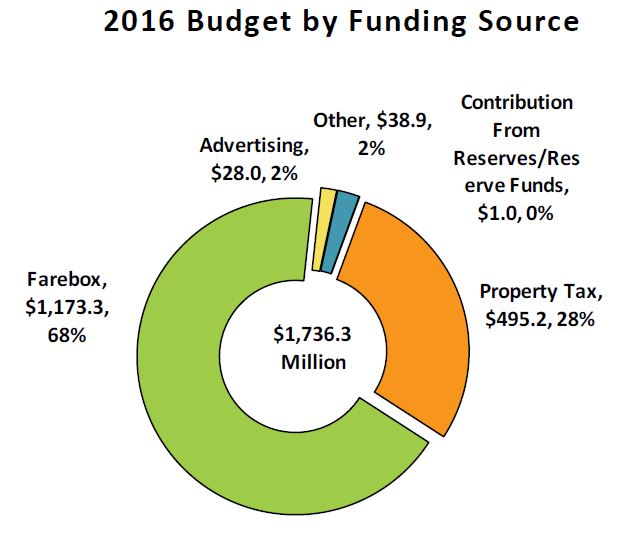
This chart is actually in error in that Property Tax does not supply all of the $495.2-million shown here. The City also receives Provincial Gas Tax revenue of about $160m of which $90m is dedicated to the Operating Budget where it appears as part of the City subsidy. (No Provincial subsidy is directed to Wheel-Trans.)

An outstanding issue for the City is that the TTC does not have “Service Standards” for its departments. These should not be confused with the standards applied to service design (crowding, maximum headways, etc.). These values the City seeks relate to departmental performance, and it is difficult to say just how meaningful such standards would be and how closely they would relate to the actual “service” the organization provides to riders.

The Preliminary Budget included here is not the same as the TTC’s version because it omits $18.4-million in various TTC-approved improvements for 2016.

PrelimANotes_OpsServiceImprovements

Note that “Earlier Sunday Transit Service” applies to the surface network, primarily bus lines, where many routes do not now begin service until 9:00 am. Although earlier rapid transit service on all routes will begin at about 8:00 am effective January 3, 2016, the feeder surface routes will not see earlier service until later in 2016, and assuming that this budget line is approved at Council (or the TTC takes some other action to fund the service without affecting the subsidy level).

The POP Fare Inspection is a particularly amusing item because Proof of Payment and All Door Boarding were implemented with great fanfare by the TTC on its streetcar system quite recently. However, Council might well not approve funding of the Fare Inspectors the TTC requires.

Operations in 2017-18

Future years’ operations pose a challenge for the TTC and City beyond the usual pressures of inflation and ridership growth. These include:

  • Garage leasing: To accommodate a “hump” in total bus fleet requirements that will last until new rapid transit lines replace bus services in the early 2020s, the TTC will lease a “temporary” garage at an annual cost of $25-million starting with the 2017 budget. This is a net new operating cost to which must also be added the cost of staffing and maintaining the new garage.
  • Presto fare card: The cost in fare handling fees to the TTC from Presto is estimated to grow to over $50m in 2017. The TTC has not yet identified offsetting savings from the reduced scope of existing fare collection systems. The Analyst notes recommend that Council require the TTC to report to Executive Committee by June 2016 on the savings that will be used to offset Presto costs.
  • Wheel-Trans costs are projected to rise at well above inflation due to demographic changes and increased eligibility.
  • The additional cost of operating the subway system once the TYSSE opens to Vaughan (net of new revenue) is projected to be $11m in 2017 (startup and commissioning) and a further $20m in 2018 for an annual added cost of $31m.
  • Further “significant funding increases” will be required for operation of the LRT lines and the Scarborough Subway, and there is “currently no funding strategy in place” to address them.

Another way of looking at this is that before Toronto even manages to spend any new money it might find to support improve transit service, it must deal with a backlog of unavoidable demands on the operating budget.

Capital Budget

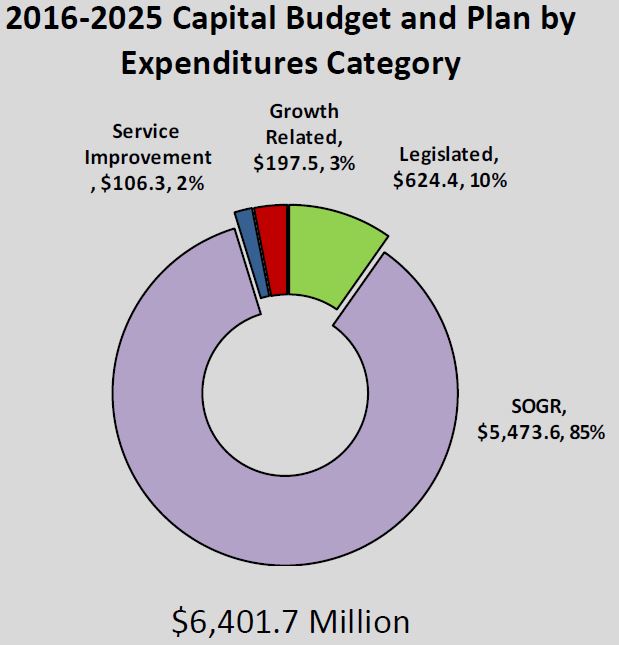
The Ten Year Capital Plan for 2016-25 includes just over $6-billion in proposed spending. As discussed in a previous article, this is nowhere near the total of the TTC’s capital needs, but stays within the City’s “affordability” target.

The budget is subdivided by type of work with “State of Good Repair” consuming the lion’s share. Assignment of some projects to these categories can be misleading because some projects address more than one area. For example, a project to increase subway car storage capacity for the TR trains is booked as “SOGR” although, in part, this is a cost related to system expansion. Similarly, part of new fleet costs are related to replacement of old vehicles, and some to system growth. By contrast, the cost of McNicoll Garage is divided equally between “SOGR” and growth [see p2 for details], while Presto costs related to new fare gates are booked against “growth” when they are really “SOGR” and “legislated” because they address accessibility at automated subway entrances.

PrelimANotes_CapSpendingBreakdown

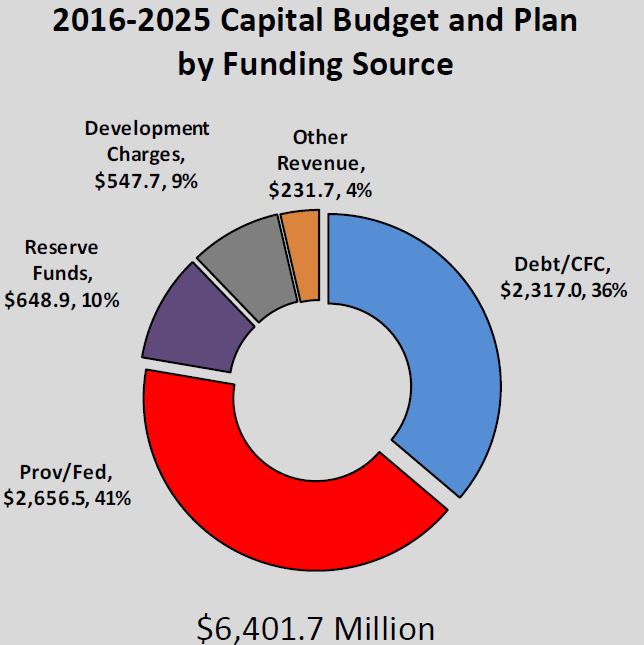
Over 75% of the funding for this plan comes from Provincial and Federal subsidies, and from City debt or capital-from-current spending. Of the subsidy moneys, only about $230m ($160m from Ottawa and $70m from Ontario) comes from Gas Tax and is not tied to any specific project. On a long-range basis, the subsidy will fall based on current commitments placing great pressure on the City’s own ability to raise capital.

Development Charges are mentioned from time to time as a funding source, but as they now provide less than 10% of the total (and that for an underfunded plan), the ability of DCs to offset much of the shortfall is limited.

“Other Revenue” is primarily money from Waterfront Toronto’s budget for projects that they are funding such as the Queens Quay rebuild and Union Station second platform.

PrelimANotes_CapSourceOfFunds

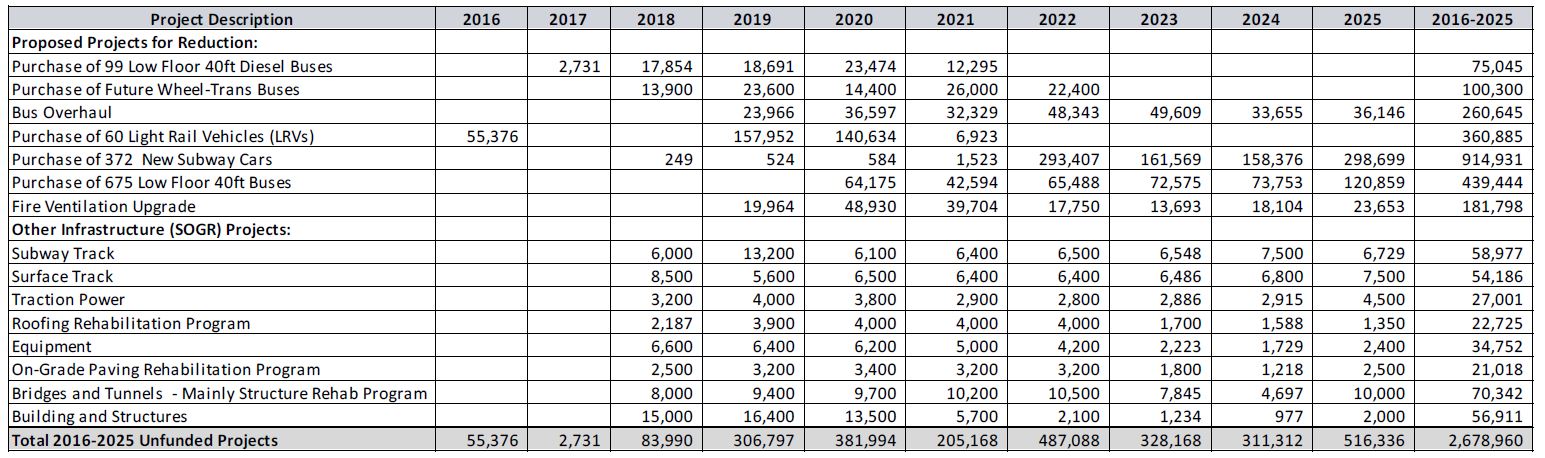
There remains almost $3-billion in projects that the TTC has approved in principle, but for which there is no funding, and another $5.5b worth of projects that have not even made it into the 10-year plan.

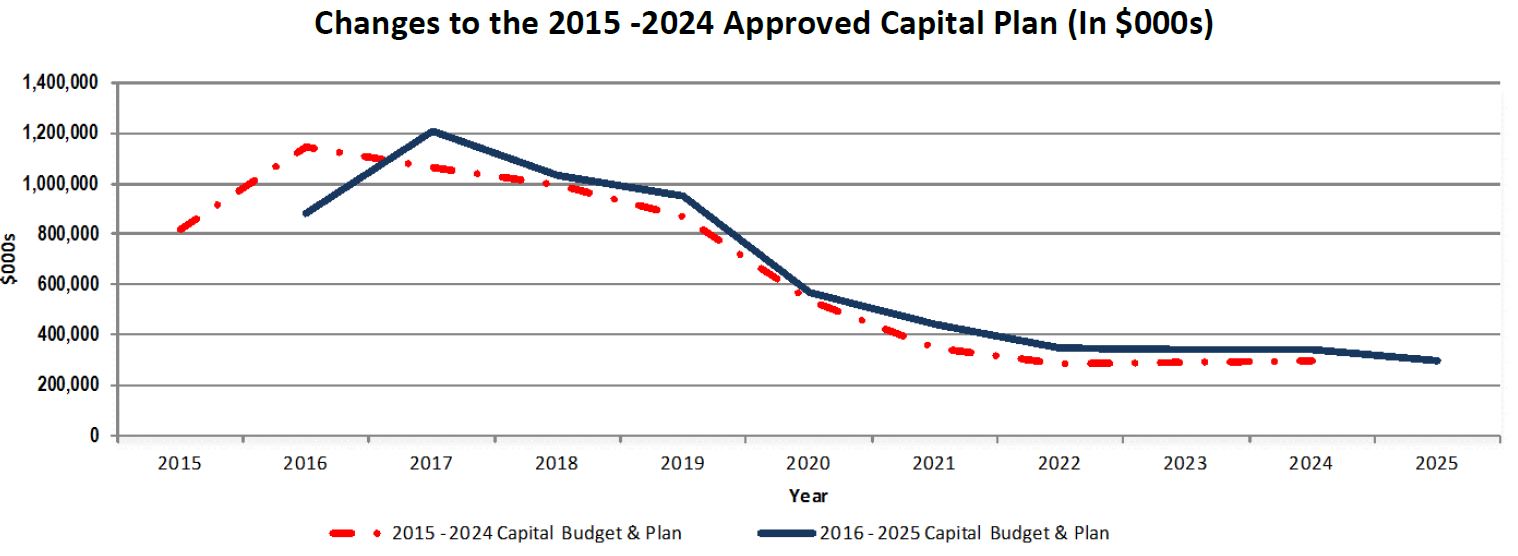
Some Capital spending planned for 2015 has moved into future years, and 2016 now has the peak spending rate.

PrelimANotes_CapChangeFrom2015

There is a steep decline after completion of the TYSSE (Spadina extension), the Yonge-University resignalling, and the new streetcar procurement projects. These have subsidy funding from one or both senior governments, and the spending rate beyond 2019 reflects the City’s own ability to fund ongoing capital needs. (Metrolinx projects such as the Crosstown LRT do not appear on the TTC’s books.)

Among projects that have fallen “below the line” to unfunded status are:

  • Bus heavy rebuild program
  • Bus replacement program

Projects with increased funding include:

  • Easier Access Program: full accessibility to subway stations is now funded for completion by 2024. This project was formerly “below the line”.
  • Subway car overhaul
  • “Finishes” which includes roof rehabilitation and station modernization costs.

Spending of less than $400m/year cannot sustain a $9b 10-year plan.

The constrained rate of capital spending brings a growing backlog of unfunded “SOGR” work. Such a backlog cannot be allowed to accumulate forever, and one must wonder what sort of catastrophe will be required to wake up City Council and other potential funders analogous to the Russell Hill subway disaster in 1995. With all the claims that the TTC is focussed on an improved experience for its riders, taking pride in restoring the system to its former premier status, the underfunding is an uncomfortable reminder of what has happened before.

PrelimANotes_CapBelowTheLine

The replacement of the T1 subway car fleet (which operates on the BD line) first appears in 2018 with early contract payments. The Analyst notes that the T1s will be reaching the end of their life in 2025. This timing is also related to the resignalling of the BD line and conversion to Automatic Train Control which the T1s cannot use, and the existing signals cannot be decommissioned until the T1 fleet is retired.

A program to overhaul Hybrid Buses in 2019-25 has been moved below the line. The TTC has already planned to retire the oldest of its Hybrids rather than trying to keep them in operation, but treating maintenance of those remaining in service as unfunded begs the question of which buses will be available to provide service when these fail.

A plan to buy 99 additional buses to improve loading standards has been placed below the line.

Among the projects that are not part of the approved capital plan are:

  • Fire ventillation upgrades ($1.5b): This is not a legislatively mandated program except at sites where construction triggers a need to meet the current building code.
  • Yonge-Bloor capacity improvements ($1.1b): This project dates back to the era before the TTC accepted the need for and benefit of a “Relief Line”. If Metrolinx demand projections are to be believed, the future demand at this junction could be reduced substantially. This begs the question of exactly what “capacity improvements” are really needed, and whether savings in this project can be used to offset the Relief Line’s cost.
  • Waterfront ($1.1b): This project is described as being for the West Donlands LRT and four vehicles for the Bremner LRT. These lie beyond the timeframe of the East Bayfront LRT which is not included in the TTC’s list presumably because Waterfront Toronto is expected to pick up the tab.

Notable by its absence here is the Relief Line itself which, by virtue of its distant commencement date (if ever), is not within the plan’s 10-year scope.

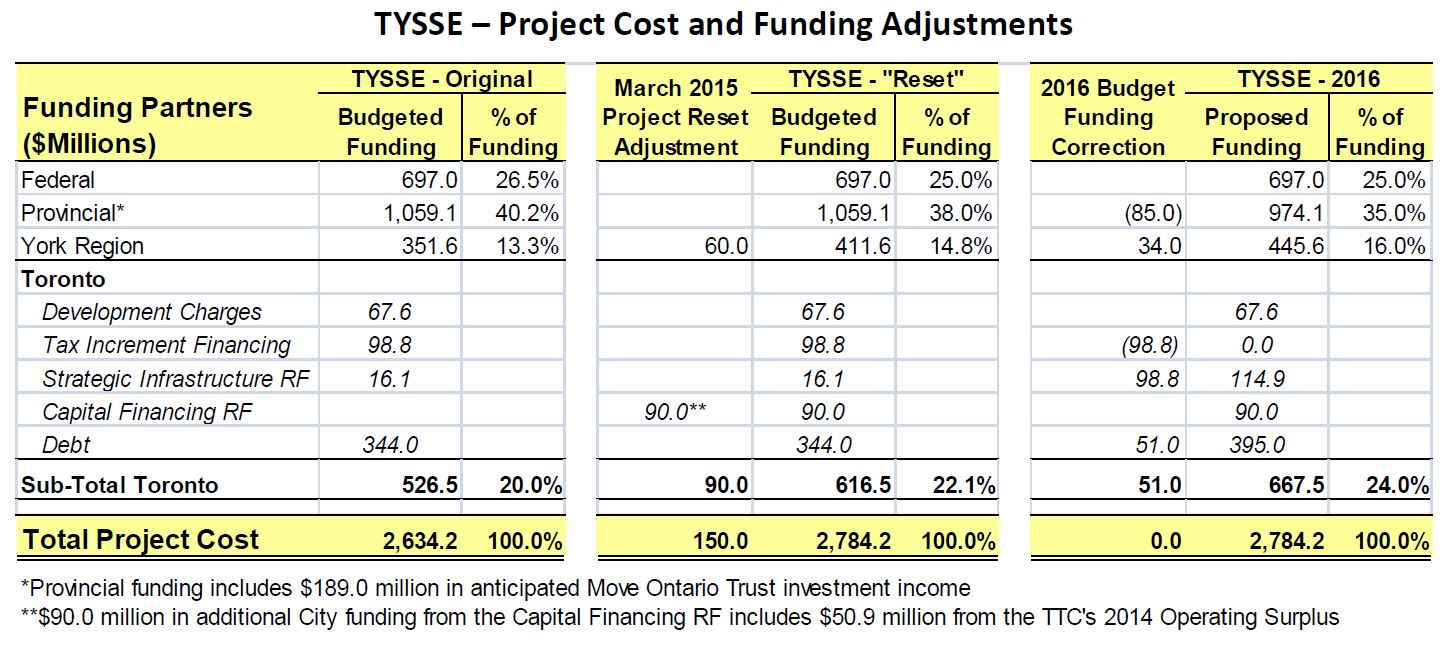
Financing of the TYSSE has been affected by various factors including:

  • A provision for $150m in additional costs to complete the project.
  • A loss of hoped-for investment income from the Move Ontario Trust (which held Provincial subsidy monies for the project) of $85m as the trust was unable to achieve a 4% rate of return. This has been partly offset by redirection of surplus funding from TTC’s 2015 operations.
  • A loss of hoped-for Tax Increment Financing because the Ontario government has not passed an enabling regulation. This has been offset by a draw on the City’s Strategic Infrastructure Reserve.

PrelimANotes_CapTYSSEBudgetAdj

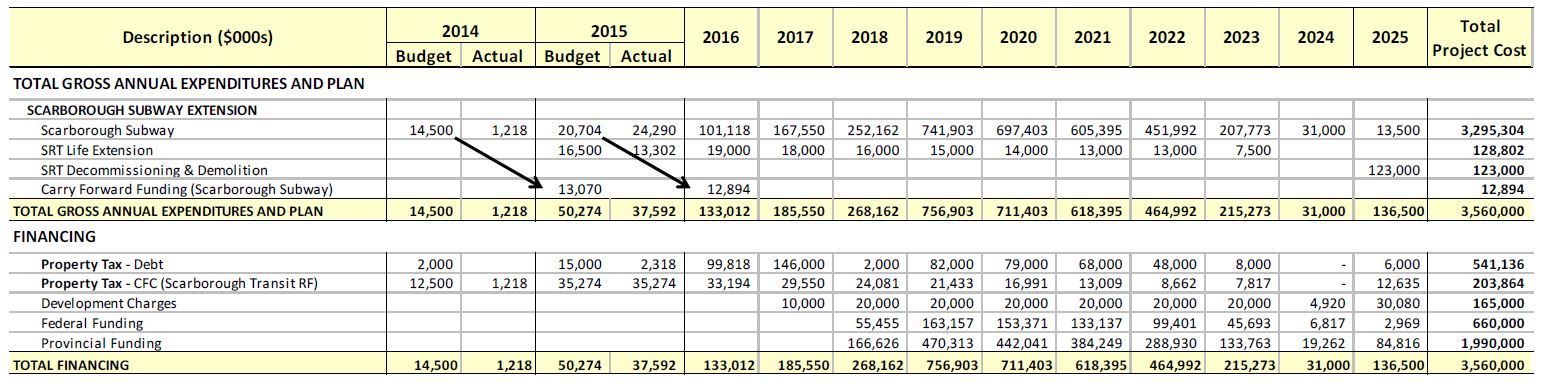
The Scarborough Subway Extension (SSE) will be funded from a number of sources including Federal and Provincial commitments. It is unclear whether these funds are “net new” or whether they represent a draw against programs such as the planned new Federal Infrastructure Program. If the latter, this will reduce the amount available to Toronto from this “pot” for other capital programs.

PrelimANotes_CapSSE


TTC Proposes New Fare Rules for Presto Roll Out

On December 16, 2015, the TTC Board will consider a report from management recommending several changes in the fare collection system. Some of these proposals are straightforward while others are likely to bring confusion and outright complaints from TTC riders.

On December 14, the TTC streetcar system goes to “Proof of Payment” (POP) on all routes and a few days later, Presto will be enabled across the streetcar system. In the short term, paying by Presto will be akin to dropping a token in the farebox on the “old” streetcar fleet. If you need a transfer, board at the front door and get one from the operator. Otherwise, rear door boarding is allowed. Transfers will be required if somewhere in your journey you will encounter a bus that is not Presto equipped. (The TTC is silent on how they will handle a route like 504 King that operates both types of vehicle if a Presto user discovers a non-Presto equipped vehicle is the first thing to show up.)

The roll out of Presto brings the opportunity to revise the fare system, for good or ill, as the TTC migrates away from its conventional model of tickets, tokens and transfers. (It is worth noting that a large number of riders have already made this migration by using Metropasses which are simple, if limited in the fare options they provide.)

The transitional period when both Presto and existing fare payment systems co-exist will be a difficult one. Indeed, there are strong incentives for riders not to shift to Presto until the system is fully functional unless their TTC usage is limited to that part of the network where Presto is active.

Continue reading

TTC Surface Route Statistics 2011-2014

The TTC recently published statistics for its surface routes for 2014, adding to the online collection including 2011 and 2012.

For convenience in comparing figures from the three sets, I have consolidated them into a pair of tables.

Stats20112014

This table is ordered by route number and contains the following fields:

  • Route number
  • Route name
  • Weekday ridership
  • AM Peak vehicles
  • PM Peak vehicles
  • Vehicle Hours per day
  • Vehicle Kilometres per day

Notes:

  • In 2011 and 2012, some route statistics were consolidated whereas in 2014 they are shown separately.
  • Data were published for weekends, night and downtown express routes only in 2014.
  • Riding counts are not updated every year on every route. Where the same value appears in two years, most likely there has been no new count.

Stats20112014Summary

This table consolidates the information by type of route.

  • The “14x” routes are the downtown express buses for which data were only published in 2014.
  • The “19x” routes are the “rocket” express buses.
  • “Riders” are unlinked trips or “boardings”. One continuous trip can produce multiple boardings depending on the number of transfers.

The total number of riders by type of service can be subject to error if a considerable proportion of the routes do not have new riding counts (e.g. streetcars in 2012). Note that some of the 2011 counts are also from previous years.

The ratio of riders to service provided is expressed relative to AM Peak vehicles, to Vehicle Hours operated, and to Vehicle Kilometres operated.

The vehicle speeds are based on the reported hours and kilometres operated. To the extent that the hours include layovers (which on some routes can be a considerable proportion of the scheduled time), the speeds could be understated although this would be more likely to show up on a route-by-route calculation. This particularly affects night routes where running times are extended to be a multiple of the 30 minute headways.

Note that despite the importance placed on “express” buses (the 14x and 19x series), the vast majority (95%) of bus trips is carried on local services. Productivity of the downtown express routes is particularly poor.

Streetcar routes operate in more congested areas with higher passenger loads and more frequent stops. Their boarding ratios per peak vehicle and per vehicle hour are about 50% higher than for the bus routes reflecting the higher capacity of streetcars.

TTC Service Changes Effective January 3, 2016 (Updated)

Updated December 8, 2015 at 12:30 pm: I checked with the TTC about the termination of both the 509 Harbourfront and 511 Bathurst routes at Fleet Loop rather than simply running one route between Bathurst and Union Stations. Here is the reply from TTC Service Planning:

We considered running a 511 (Bathurst Stn-Union Stn) service but ruled it out for two main reasons. Firstly, stop usage on Fleet west of Bathurst has greatly increased in the last year, and serving these stops only with the shuttle bus would introduce a transfer or longer walk for too many people. Secondly, because of the road configuration and traffic patterns, it is not possible to have a northbound stop for through 511 cars on Bathurst at Lake Shore. The nearest stop would be the existing 509 stop on Bathurst farside of Queens Quay. This adds to the walking distance for customers heading to Fleet Street, and requires customers to cross an inhospitable intersection.

The original article follows below:

The new year brings changes to some routes, mainly on the streetcar system, to deal with the shortage of new Flexitys and a construction project while improving service on 501 Queen, 502 Downtowner and 503 Kingston Road to better reflect actual conditions.

2016.01.03 Service Changes

Continue reading

City of Toronto 2016 Budget Overview

On December 1, 2015, Toronto’s new City Manager, Peter Wallace, presented an overview of the state of the City’s finances to the Executive Committee. This was by way of an introduction to the 2016 budget which will launch on December 15. Wallace’s talk can be viewed on YouTube, and the slide deck from his presentation is on the City’s site.

Wallace’s approach to the budget is a breath of fresh air on two important accounts. First, he believes that the proper roles for Council and for the City Staff are policy and implementation, respectively. Second, he begins the budget cycle without the now-familiar annual exercise of wrestling the “budget gap” down to zero before Councillors even have a chance to review the numbers. These combine to place responsibility for choices and options where it belongs, at Council, rather than having a back-room hatchet job done by staff without the tradeoffs and options ever surfacing for public debate.

The City Manager is quite clear: decide what kind of City you want and then figure out how to pay for it.

Moreover, Wallace is very clear that the City has been living a charmed existence thanks to very strong revenues from the Land Transfer Tax, and because a large and growing backlog of unfunded capital projects has not been included in the City’s financial planning.

Politicians depended on staff telling only good news so that tax cuts and other giveaways could proceed without arousing questions of where the money will come from, or what might not be built without the lost revenue. That was certainly the case through the Ford era and the early part of John Tory’s mayoralty, but this extends even back into David Miller’s term. The concept of “below the line” budgeting was used to keep some capital requirements off of the books in hopes of major contributions from other governments, and to make the City’s long-term exposure look less dire to maintain a favourable bond rating.

From 2000 to 2015, the total City revenue per capita has grown by 19.7%, and the City’s share of the region’s economic activity has stayed at the same level (in other words, the City has not become relatively a larger or smaller part of the regional economy). What has changed is the proportion of income received from various sources.

TTC fares as a proportion of the total have risen from 9.6% to 10.5%, Utility Fees have gone up by about 50%, and Other User Fees have fallen. The property tax which formerly accounted for about 40% of City revenue now is only 33.5%. Most of this reduction comes from lower non-residential taxes (about which more below).

Land Transfer Tax may only account for 3.8% of total revenue, but that is out of a very large total and it represents several hundred million dollars annually.

CityRevenueTrend_20002015

Continue reading

Metrolinx Board Meeting December 3, 2015 (Updated)

Updated December 3, 2015 at 4:30 pm:

This article has been updated to reflect actions at the meeting.

Farewells

The meeting began with farewells to two senior members of the Metrolinx team.

Jack Collins, the Chief Capital Officer, is retiring to return to live with his family in northern California. He is one of the “straight shooters” at Metrolinx from whom I never had any sense of “spin” in his presentation of information about his projects. His knowledge of actually building transit projects, and LRT in particular, has been a valuable part of Metrolinx work.

Stephen Smith, a Board Member and Vice-Chair, leaves after spending 10 years at GO Transit and then Metrolinx.

GO Transit Fare Increase

The Board spent only a short time in debate on this matter, and never really addressed the fact that the tariff does not line up with the claimed formula for calculation of fares (see Sean Marshall’s article on this linked below).

A rather tortured explanation (which we have heard before) told the Board that past inequities are being corrected through the application of a tiered fare increase with higher bumps for higher fares and, in 2016, no increase at all for the lowest tier. The actual breakdown is:

201602_GO_FareIncreases

For the second and third tier of fares, the increase ranges from about 6% to 7.5%. For the top tier, the increase is about 7.3% for the low end of the range. However, riders on the outer ends of lines fare considerably better. The Kitchener single fare is now $16.60, and it will rise to $17.20, a bump of only 3.6%.

The problem with GO’s formula is that fares go up the most for medium distance travellers, while those riding furthest have the smallest percentage increase.

GO claims that its formula is a base amount plus a distance charge, as in:

Fare = Base + (Distance * Rate)

It should be trivial to adjust the two factors (Base and Rate) and recalculate the entire fare table. However as Sean Marshall has demonstrated, the existing fares don’t actually work that way. The tiered increases GO actually uses are a rough attempt at this, but they are biased in favour of long-haul riders.

If the Metrolinx Board were doing its job, it would spot this problem and demand a program to move to a justifiable, formula based tariff possibly over a multi-year implementation to smooth out the effects.

Continue reading

Union Pearson Express Continues Unimpressive Ridership

At its Board Meeting on December 3, 2015, Metrolinx will receive an update on the ridership for the Union Pearson Express. Previous statistics released by Metrolinx to mid-September were not encouraging with a fairly flat ridership in the mid-2000 range once the initial burst of “try outs” and free rides passed.

The new report only extends the published information by about six weeks to the end of October, and the numbers are presented in a way that masks what is really going on.

UPX_Ridership_To_201510

This looks like wonderful upward growth, but there are two problems:

  • The base of the chart is 60,000, not zero, and so the slope of the chart is more impressive than might otherwise be the case.
  • The ridership is reported on a monthly basis with no correction for the length of each month.
    • June was a short month with only 25 days of operation, and this included two promotional days with unusually high ridership.
    • October has one more day than September.

Plotted as daily averages with a zero base line, things don’t look quite the same. There was a drop off in the summer with July and August relatively flat, and a slight increase for September and October, roughly 7% but over a two-month period. The real question is where do things go from here?

UPX_Daily_Ridership_To_201510

To reach the target of 5,000 riders/day at the end of the first year’s operation will require almost a doubling of daily ridership over the period from November 1, 2015 to May 31, 2016, or a sustained growth of about 14% each month.

After many rosy accounts of the initial reception of UPX, we now read of the problems of getting people to adopt a new mode of travel:

Metrolinx just completed an airport ground transportation survey this fall which found that 70% of all travellers make decisions about ground transportation modes based on past habits or they have the decision made for them. This is regardless of whether they are flying to or from a home airport. Only 20–30% of travellers did research or saw/heard information prior to departure and this was mostly related to the destination airport. The findings underscore how deeply engrained travel habits are and the significant work required to successfully change these behaviours. This is consistent with what we have been told by other international air rail links – changing entrenched travel behaviours of both local and visiting air travellers takes time.

Before UPX launched, Metrolinx did extensive reviews of the air-rail link industry, and yet somehow this basic principle, the difficulty of getting people to change habits, escaped their notice.

Marketing efforts include a UPX presence at the terminal stations, trade shows and special events.

Additional marketing initiatives over the past few months have included:

  • Refreshed wayfinding & signage at Union and Pearson
  • Installed additional ticket sales & servicing kiosks inside the Terminal 1 baggage claim area and the T3 counter
  • Increased presence of UP Express Ambassadors at Pearson
  • Revised on-site advertising to complement wayfinding

Metrolinx has tinkered with the fare structure on UPX, although the trips are still quite expensive. An appendix setting out the recently modified structure is missing from the online report, but the fares can be viewed by wandering through the website for standard, employee, and group/corporate tariffs (although the latter contains no information about the discounts actually available).

By listening to, and understanding our customer needs we are continually evaluating our suite of fares and investigating new structures to respond to demands including:

  • Family Long Layover to complement the individual long layover
  • Family Meeter & Greeter to complement the individual fare product
  • Increasing the age for free child fares from 6 to 12 years of age, to align with other global air rail links
  • Changing the return fare costs to attract repeat usage

In an article by Oliver Moore in The Globe & Mail, we learn:

The service was forecast to hit 5,000 passengers a day by next summer, about twice the current ridership. [UPX President Kathy] Haley suggested on Monday that the forecast might be flawed, because it predated Uber, and hinted that the ridership goal could be in flux.

The possible effect of Uber, let alone the idea that the goal of 5k/day in ridership, does not appear in the report to the Metrolinx Board. It is hard to believe that a service, routinely promoted as a premium quality line with fares to match, should be at the mercy of lowly Uber. Is the market is not quite so upscale and immune to price as we have been led to believe? Are there not enough of that class of traveller to make UPX pay?

Metrolinx has yet to release any financial data on the line’s performance, and we are unlikely to see this until their next annual financial reports (which subdivide results by operation division within the agency) due in mid-2016.

The explanations, the excuses, for poor performance of UPX have all the earmarks of a service that was over-hyped from the outset to justify its design and cost. One question Metrolinx must answer is why they need so many staff, so much marketing, to attract riders to a line that was supposed to have demand come to it so easily. This route is on a par with a minor TTC bus route. 126 Christie has roughly the same daily demand, but it does not command an army of greeters, let alone its own President.

Remember when the airport link was to be a private sector project with no public money?

Pearson Airport is a major regional hub, second only to Union Station for daily passenger volume. Transportation to the airport and surrounding districts should address travel from a wide variety of origins, not just downtown. Service and fares should reflect that the majority of this travel is a combination of ordinary commuting and air travellers, each with their own needs that the network must support.

Metrolinx should concentrate less on its showcase, premium fare service to Union, and more on making the airport a major transit destination for the GTHA.