The TTC is into the second round of its consultation for service changes and construction projects in 2026. There is a general page on the 2026 Network Plan and a Survey for feedback.
If you comment here, be sure to also complete the survey so that your feedback goes into the official record.
Updated August 14, 2025 at 1:20pm: This article was written based on information in the customer survey as it existed about 4:00 pm on August 13 when the link to it went live on the TTC site. This included a reference to a minimum 5 minute time saving for express buses which did not match the TTC’s own service standard. The survey now contains the correct information. Text in this article has been updated accordingly.
Updated August 22, 2025 at 2:40pm: The City of Toronto has confirmed that widening of the St. Clair underpass east of Keele Street will not be part of the Metrolinx/TTC project planned for 2026.
Public Pop-Ups
August 13: Pioneer Village Station near express route bus bays 7:30-9:30 a.m.
August 14: Kipling Station near express route bus bays 7:30-9:30 a.m.
August 18: Kennedy Station near express route bus bays (Platform A and B) 7:30-9:30 a.m.
August 19: Don Mills Station near express route bus bays 4-6 p.m.
August 20: Yonge and College 506 Carlton, Eastbound stop 4-6 p.m.
Note that almost all of these relate to the review of express bus services, and only one of the construction proposals (College/Carlton) is covered. More consultation in affected neighbourhoods is definitely required.
The list of surface route operating statistics for 2024 recently appeared on the TTC’s Planning webpage. This article consolidates data for the years 2019 (the last pre-pandemic year) to 2024.
Values included in the TTC files are:
Weekday passenger count
Weekday vehicle hours
Weekday vehicle klometres
AM peak vehicles
PM peak vehicles
Derived values included in this article:
Passengers (boardings) per vehicle hour
Vehicle kilometres per hour
Recovery rates relative to 2019
Pages for each set of stats are included in the detailed part of the article, and a PDF containing all tables is linked at the end.
In a future article, I will refresh a previously published table comparing service levels on routes in September 2025, when this information is available, with prepandemic conditions.
A basic message of both articles is that the TTC trumpets a return to former service levels, but the metric they use, vehicle hours, misrepresents the level of service provided. Buses and streetcars travel more slowly now than they did in 2019, and they have more generous recovery times at terminals. These combine to make a vehicle hour less productive in the amount of service it provides than in past years, and so 100% of former hours does not produce the same service. That is separate from other factors such as a decline in reliability, bunching and gaps which compound the less frequent scheduled service.
The problem is particularly bad on streetcar routes where a combination of factors including understaffing, budget constraints, and operating practices that slow service, lead to considerably less “recovery” to former service levels. In turn, this hurts service quality and blunts ridership recovery.
Crowding conditions are not addressed by these stats, and this is difficult to extract from TTC tracking data due to the coarse-grained nature of reported loads. TTC does not publish numeric vehicle loads, only broad light-medium-heavy loading indications. Although they report all-day ridership on each route, this is not broken down by time of day, location and direction, at least not for external consumption. TTC has crowding standards, but we do not know how well they meet them.
The number of peak vehicles is lower in 2024 than in 2019. This partly reflects limits on service growth, and partly the shift of demand into off-peak periods.
In the attempt to woo riders back onto the TTC, let alone to boost transit’s mode share for travel in line with City goals, the question of service level and quality is key. In theory, if demand actually sits below the historic level, then less service is needed to handle it. However, those who remember the condition of transit before 2020 will know that crowding was a pervasive problem and calls for better service were common. Only the March 2020 drop in demand saved the TTC from a capacity crisis.
Toronto must understand and commit the resources needed to achieve its transit goals. Just getting back to 2019 is no goal to aim at.
This article is an update from a previous review of travel times on the Jane corridor which is currently under study in the RapidTO program. Red lanes are proposed between Eglinton and Steeles both ways. The southern limit is defined both by the change in roadway cross section in the older part of the city, and by the future split in bus service at Eglinton to feed into Line 5 Crosstown.
Scheduled Service and Ridership
A common claim by the TTC and City is that service on the bus network is restored to or better than pre-pandemic levels. This is not true.
The measurement used is bus hours, but actual frequency of service is the metric riders experience. Total bus hours might be “back to normal”, but these are distributed differently now than in 2019 with some of the restoration going to longer travel and recovery times. These might contribute to service reliability, but with lower scheduled capacity (buses/hour).
Service in November 2019 compared to February 2025 (the schedule in effect in August 2025) was generally better than it is today.
Buses / Hour L Local X Express
2019.11 M-F
2025.08 M-F
2019.11 Sat
2025.08 Sat
2019.11 Sun
2025.08 Sun
AM Pk M-F
12.9L 8.0X
10.0L 5.0X
Midday MF
8.6L 6.3X
8.0L 4.0X
PM Pk M-F
12.0L 6.2X
10.0L 5.0X
Early AM S-S
7.1L 6.0X
6.0L
2.0L
3.0L
Late AM S-S
6.0L 6.7X
6.0L 6.0X
6.0L 6.7X
6.0L 6.0X
Afternoon S-S
8.0L 6.7X
8.6L 8.6X
6.0L 7.1X
7.5L 7.5X
Early Eve
6.9L 6.7X
8.0L 4.0X
8.6L 6.7X
7.5L
8.6L
7.5L
Late Eve
6.7L
6.0L
7.1L
6.0L
6.3L
6.0L
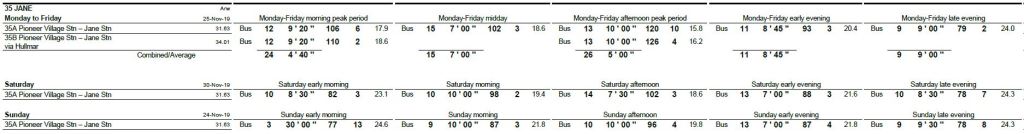
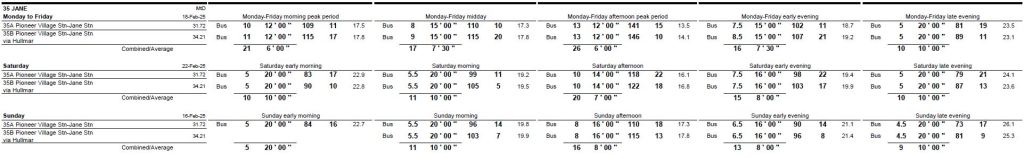
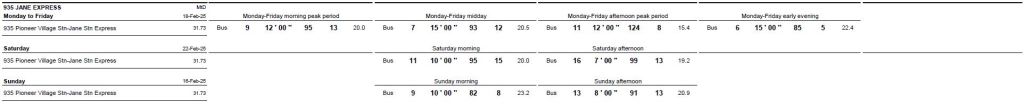
The tables below are taken from the November 2019 and July 2025 TTC Scheduled Service Summaries show the corresponding service designs. Within each group, the fields are:
Number of assigned vehicles
Frequency of service
Travel time
Terminal recovery time
Scheduled speed (km/h)
Changes in service levels are affected by scheduled speed, frequency and recovery time. Note that recovery times in 2025 are more generous than in 2019, and travel times have also increased with a corresponding drop in scheduled speeds. In some cases, the number of buses (and hence bus hours) goes up, but the level of service goes down because of slower operation.
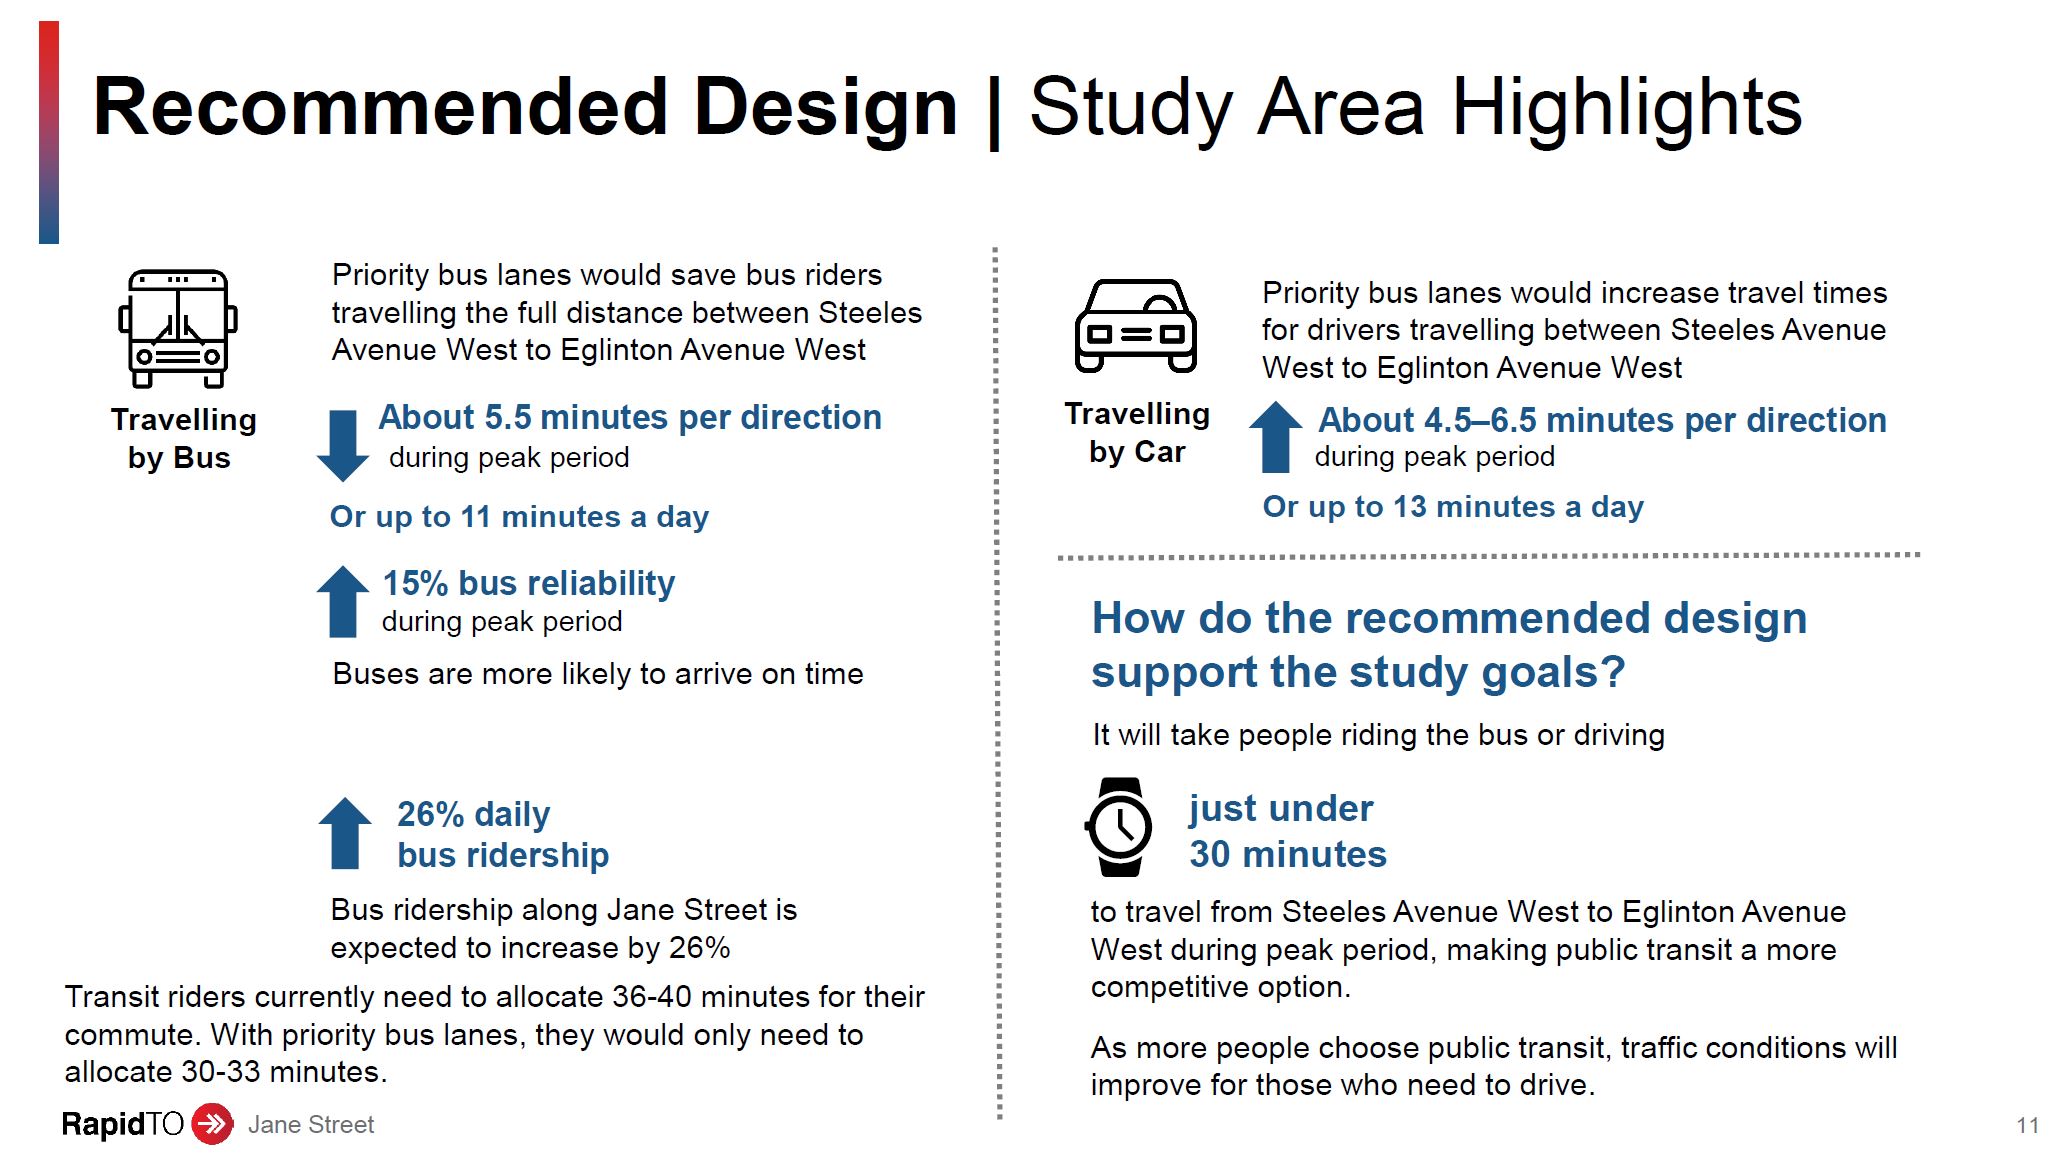
RapidTO plans for Jane seek to shorten travel times between Steeles and Eglinton, but the benefit varies. Terminal departures are irregular, although much of that variation is permitted under the Service Standards. RapdTO’s supposed contribution to regularity is that buses will be able to stay more or less “on time”, but unless departures at terminals are better managed, service will still begin trips irregularly. On the current 6′ peak headway, the standards allow a 50% fluctuation from 3-to-9 minutes, and this can make a huge difference in wait times and vehicle crowding.
All-day ridership reported in past years is summarized below. As of Fall 2024, ridership was still well below the 2019 level.
We do not know how much ridership growth might be constrained by service capacity and reliability, as opposed to changes in actual demand. The TTC projects large growth from improvements in travel time and reliability with RapidTO, but with no commitment to increased capacity. This claim is difficult to believe.
I asked the TTC for the methodology behind its calculation of RapidTO ridership growth on July 28, but have received no details as of August 11. (The request was for Dufferin and Bathurst corridors where the TTC makes similarly optimistic projections, but the same issue applies to Jane.)
The remainder of this article updates previously published data about travel times on Jane starting just before the pandemic in November 2019 up to July 2025.
This is the third part of a series showing details of travel times in the Bathurst and Dufferin corridors.
For introductory remarks and a discussion of general issues, please refer to Part I.
The main part of this article contains the charts for the streetcar service on 511 Bathurst. Note that data for any bus extras has been omitted from these charts to ensure a presentation of streetcar-only speeds. Data from October 2024 and July 2025 are shown here to be outside of the period when the line was rerouted around construction at Fleet and Bathurst with buses operating a south-end shuttle service.
This is the second part of a series showing details of travel times in the Bathurst and Dufferin corridor.
For introductory remarks and a discussion of general issues, please refer to Part I.
The main part of this article contains the charts for the local and express bus services on Dufferin Street in June 2025.
Although the focus of recent debates about transit priority for Dufferin was from Eglinton south, data here show that there are issues with extended running times, particularly in the afternoon, over the full route with northbound trips taking the lion’s share of the delay. Express trips are faster than local trips, but by varying amounts over the route. The least benefit is on the southern portion of the route where red lanes will be installed, and where staying in those lanes could prevent express buses from leap-frogging the locals.
There are some areas where traffic slows in advance of an intersection, but more common is a general slowing down of bus speeds over the route representing overall traffic speed and longer stop service times when the route is busy.
Data shown here are from June 2025 with both the local 29 and express 929 services plotted together for comparison. In many times and locations their speeds are comparable, while in others the express buses have higher speeds than the locals.
The main article contains all of the charts including PDFs with all day sets.
In recent discussions of the Bathurst and Dufferin transit priority schemes, a major issue is the degree to which various parts of the routes contribute to slower operation by time-of-day and direction. In this article and two to follow, I will review the actual behaviour of these routes to provide both a basis for discussion of expanding the priority schemes, and as a “before” reference for comparison after they are implemented.
Reviews by time-of-day are useful not just to spot peak period issues, but also as a reference for what might be achieved. At the beginning and end of service hours on most routes, there is no traffic congestion and lighter passenger demand reduces stop service time. Bettering travel times from those periods would be challenging.
Travel times are affected by many factors including:
Interference from other traffic on the road, and the degree of congestion for traffic generally.
Absence of signal priority and “priority” signals that do not adequately reflect actual operating conditions.
Stop service time including both the penalty for stopping, starting and rejoining the traffic flow; and passenger boarding times which depend on the volume of riders and crowding conditions.
The proportion of riders with large objects such as bicycles, baby carriages, shopping carts, luggage, scooters and wheelchairs. This affects not just boarding times, but also the ability of passengers to move within vehicles, particularly buses.
Slow driving speeds induced by a desire to avoid running early when scheduled times exceed what is actually needed.
Posted speed limits.
Weather conditions.
Express services have fewer stops and therefore lose less time on that account, but this is only one of many possible factors.
A further consideration is that for the transit vehicle, we generally talk about point-to-point times, but for a rider, “travel” includes access time to and from stops at their origin and destination. Removing stops might speed up buses, but at the cost of longer access time. This is a balancing act depending on local geography, the location of signalized intersections and major trip generators.
Travel Times and Ridership
The relationship between travel times and demand is not exact, and depends on various factors:
A substantial reduction in a long trip is more noticeable than a small reduction.
For short trips, an improvement in scheduled service and reliability will improve wait times possibly by more than the saving for in-vehicle time. This is compounded by riders experiencing wait time as longer than in vehicle travel time.
Comfort is important for longer trips where standing in a packed bus is no fun. For short trips the inability to board is a disincentive to ride. Speed is only one measure of attractiveness.
If service is changed, or stops are removed, in parallel with the reduction in travel time, it is not clear which factor influenced ridership the most.
The origin and quantity of any new riders can vary and will depend greatly on both the latent demand and the perceived improvement for travellers. Would-be riders who now drive require a substantial inducement to change modes especially if their trip would involve multiple routes of which only one was improved. Some riders may shift from nearby routes as happened with the King Street corridor, but this is very specific to local routes and riding patterns, and it does not represent net new transit users.
Any analysis is complicated by the events of 2020-25 and a major shift in overall travel including the stronger recovery of off-peak as compared to peak period demand. If transit priority only yields its greatest benefit in the peak, a large part of the travel market sees little change.
The TTC projects substantial ridership increases on Jane, Dufferin and Bathurst through the proposed transit priority schemes, and this implies both a major improvement in perceived service quality and a latent demand for better transit. However, they do not explain how they reach this conclusion nor the methodology behind their claims, nor the amount of extra service, if any, that will be fielded in anticipation of growth.
Looking at the Whole Route
The Council debate concerned only the section of 7 Bathurst and 29/929 Dufferin south of Eglinton, and of 511 Bathurst from Bloor to Fleet. An inordinate amount of time was spent on a short section of Bathurst south of Dupont. For both corridors, much work was done by local Councillors, their communities and Transportation Services to fine tune the design. This should have occurred earlier in the process.
The larger question, however, is not just the installation of transit priority over a portion of these corridors, but the routes overall and the service they provide. The TTC loves to point to external factors like traffic congestion as their rationale for irregular service, but they do not manage the service they already have as I have shown in numerous articles. Moreover, the standard on which they base reports of “reliability” is very generous for routes that only run every 10 minutes allowing a deviation between 5 and 15 minutes in vehicle spacing.
If one were to say “make it tighter”, I expect the first response would be “oh, we cannot possibly do that” even though the same standards set a tighter deviation for more frequent routes. If it is possible to manage to a six minute window on a 6 minute service, it should be possible to manage to this on a 10 minute service. TTC Service Standards excuse poor service rather than demanding excellence.
The main part of this article presents speed profiles showing details over 7 Bathurst by hour. Within these, one can see locations where transit vehicles have slow operation over extended distances, notably on approaches to intersections. These are key sites for any focus on speeding up transit service.
As a reference, the travel times over each segment, broken down by hour, are also included to show the variation over the day, and the degree of variation (standard deviation of values).
There are many charts, but only a sampling is included inline here. PDFs with full day sets are linked for those who are interested.
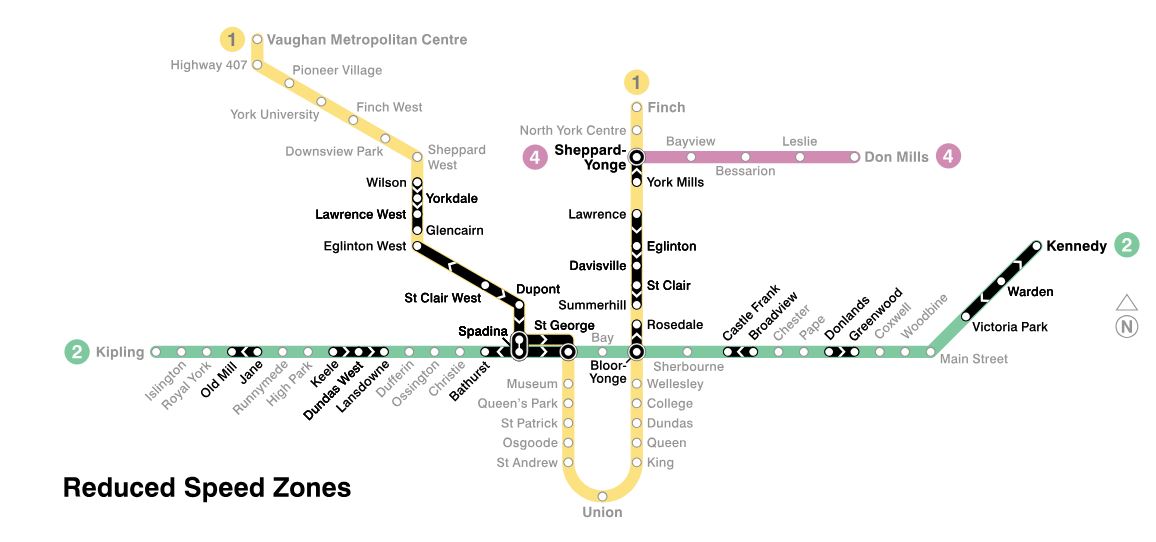
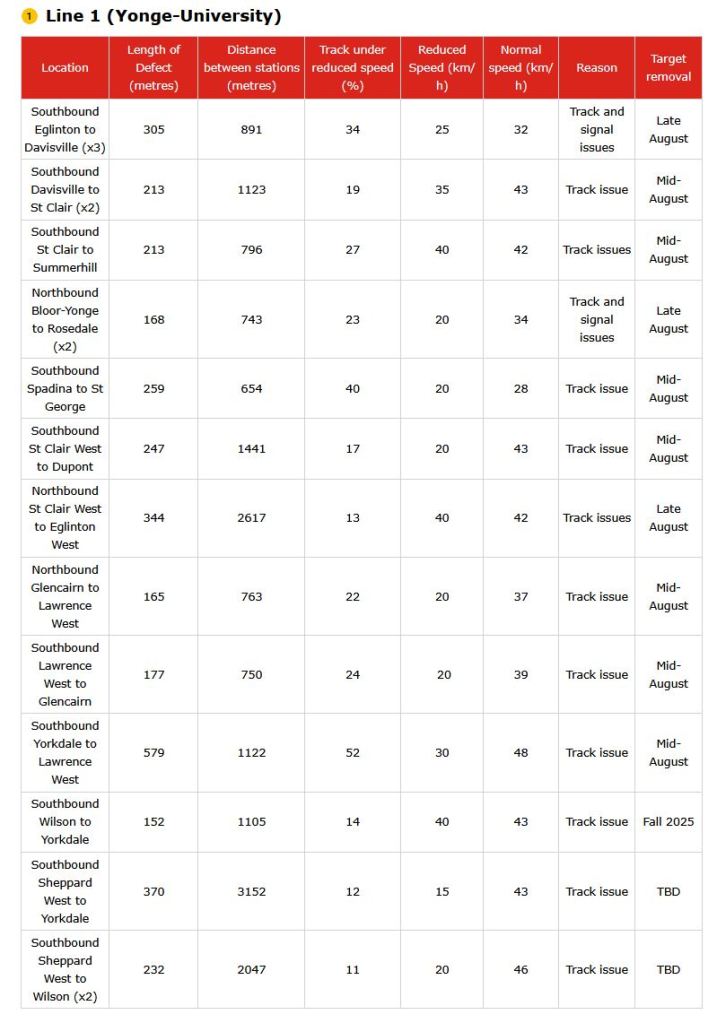
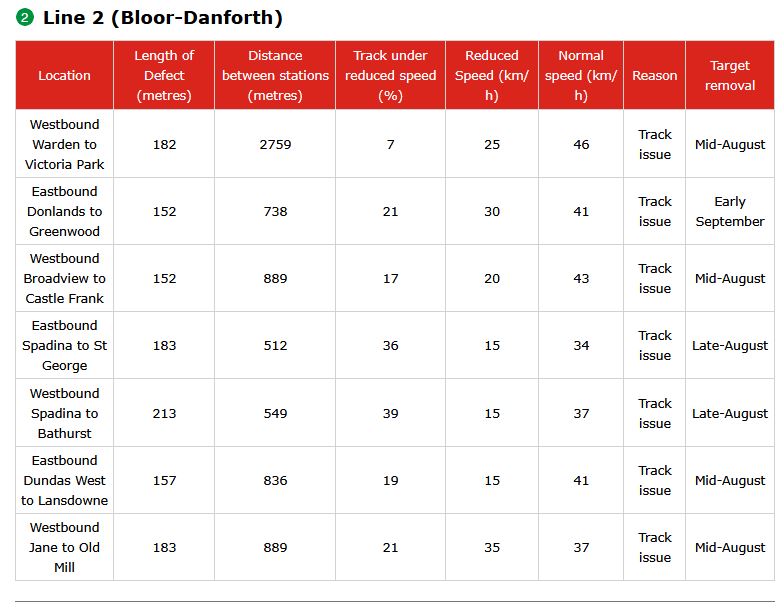
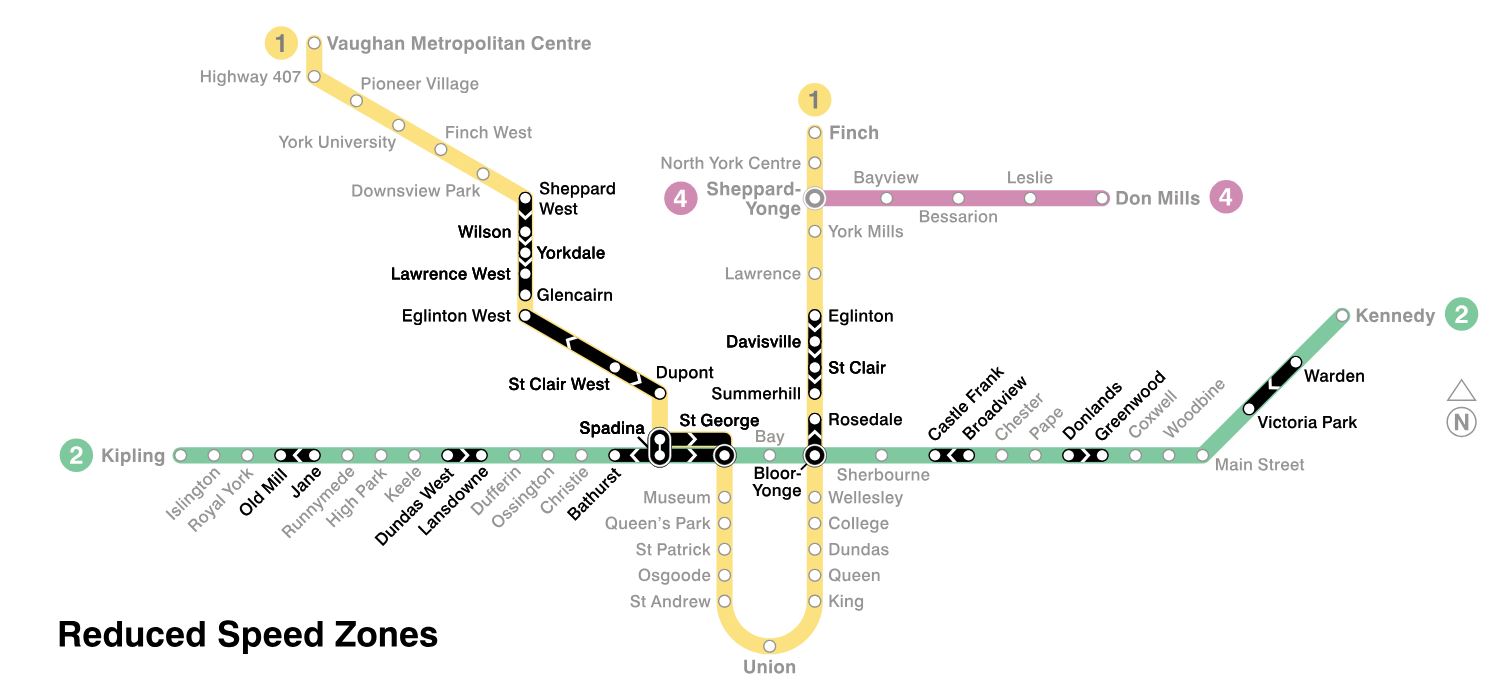
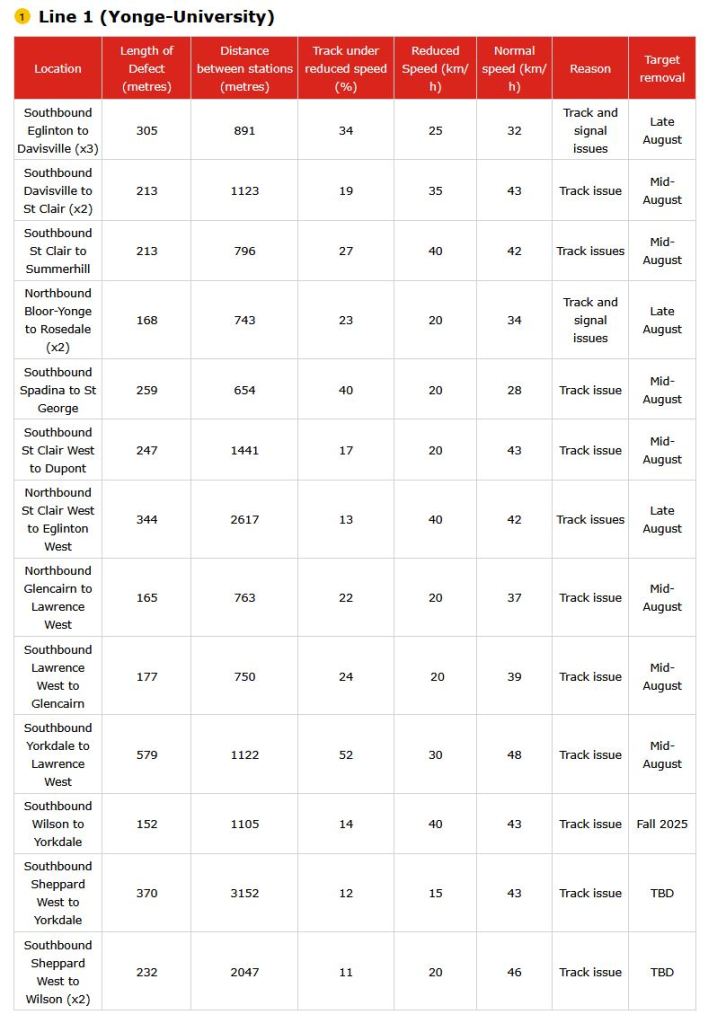
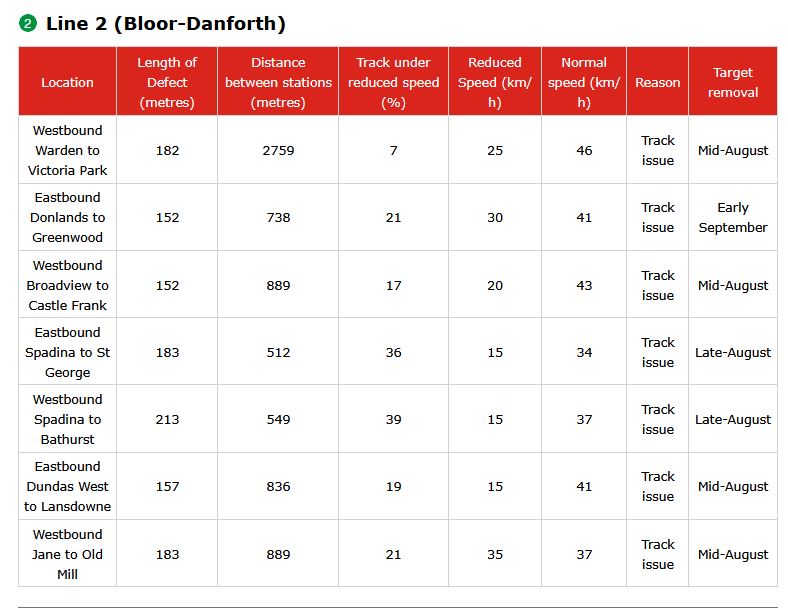
The TTC maintains a list of reduced speed zones on its website, and this constantly changing list is tracked in a previous article here showing how long some restrictions have been in place.
The format of the TTC page has been changed to include not just a map showing where the zones are, but why they were created and, in most cases, a target date for remediation.
The current map and table of repair targets, as of July 31, 2025, are shown below. Note that some of the items on the map are not included in the detail (e.g. Warden to Kennedy eastbound), and the table includes entries that are not reflected on the map (e.g. Sheppard West to Wilson). This does not speak well of the TTC’s ability to communicate consistent, accurate information.
Updated August 1, 2025 at 9:10am: The TTC has updated their page so that the map and tables are now in sync with each other.
Most of the zones listed here are scheduled for removal by early September with only a few continuing into the Fall or beyond (“TBD”). This list will bear watching for additions, and for removals of cleared sections within the expected time frame.
(The spreadsheet has been corrected to refer to Sheppard Yonge rather than Sheppard West Station for bus looping changes.)
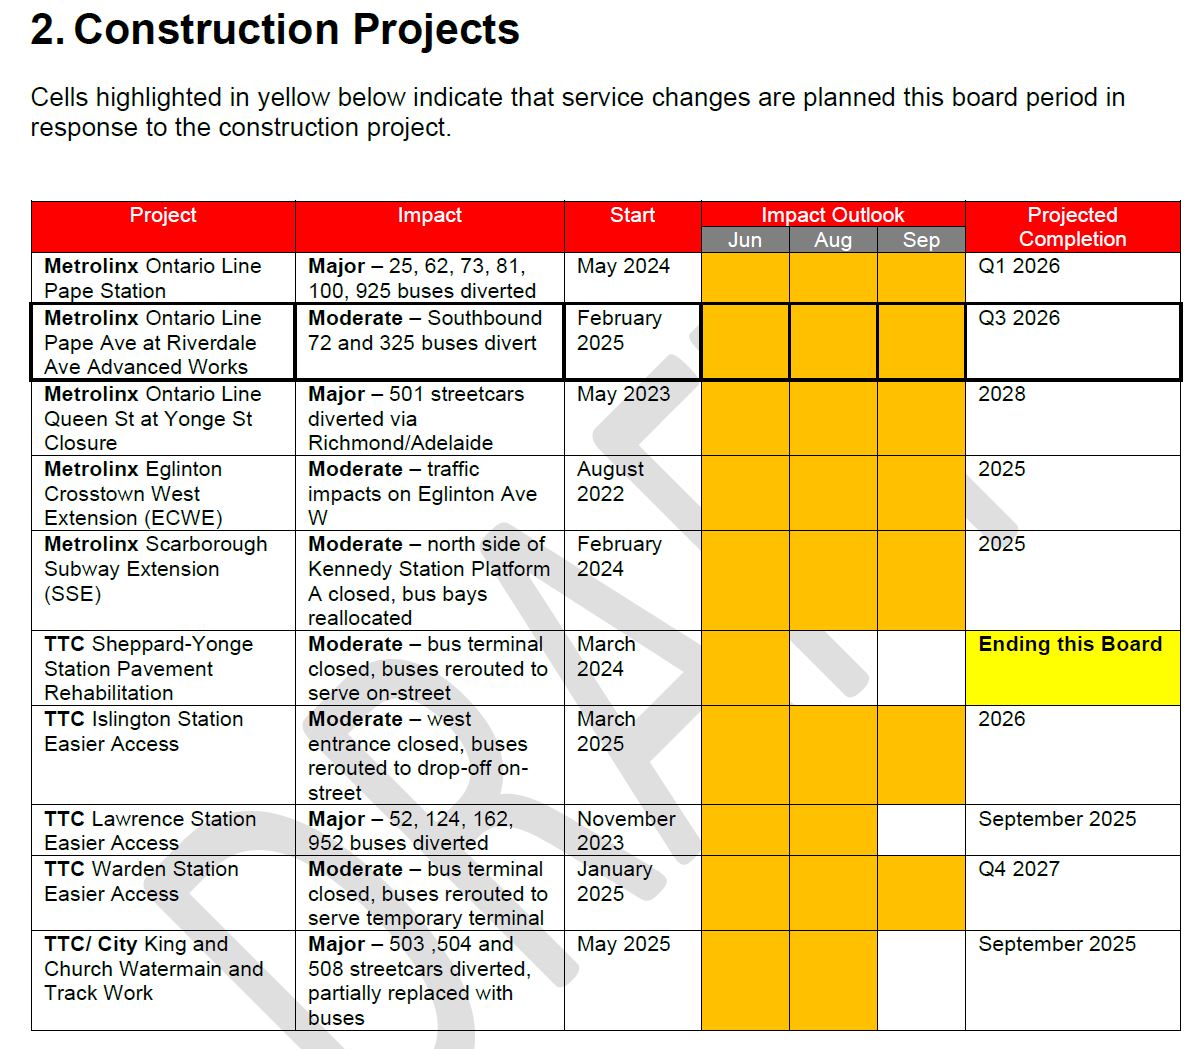
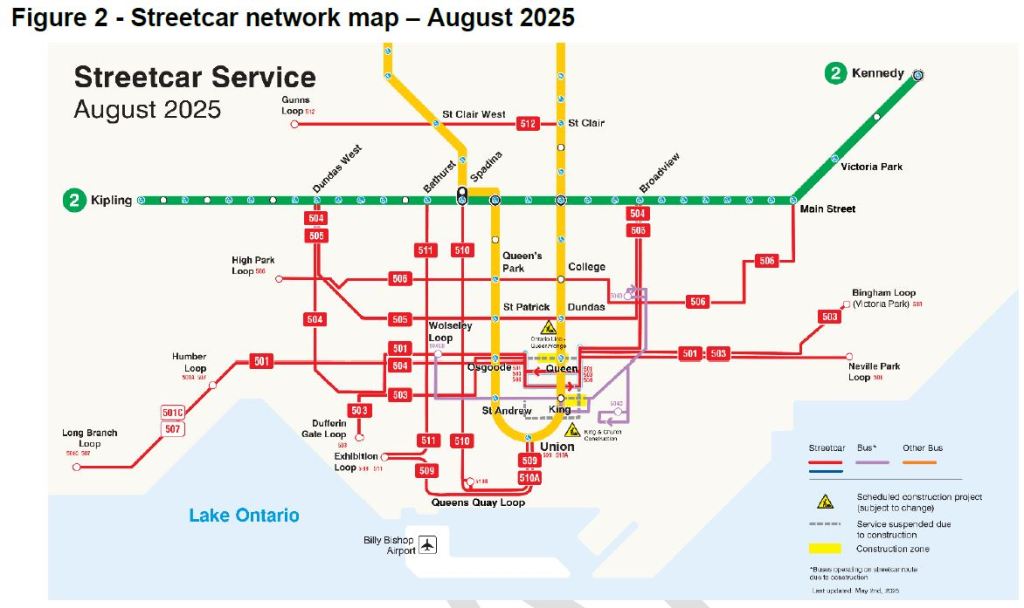
Construction Projects
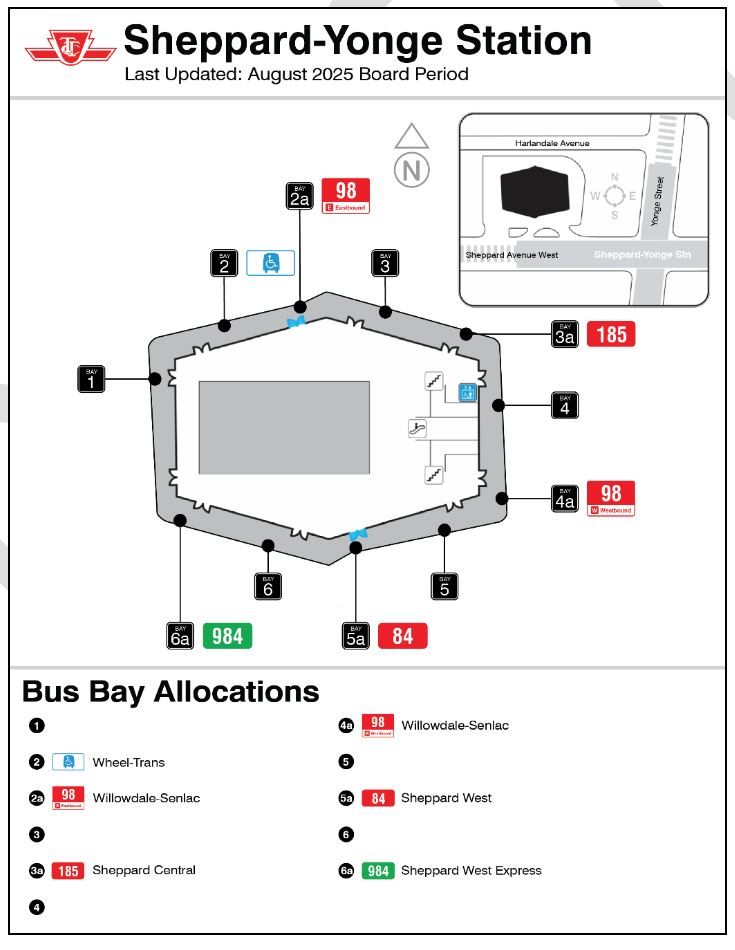
The only change in the construction project list is that paving work at Sheppard Station bus loop is complete, and buses will move back into the loop. There is no change in service on affected routes.
The bay allocation at Sheppard Station is shown below.
Temporary Service Improvements
With a surplus of operators, service will be improved to address crowding and service resiliency on many routes. These are not formal schedule changes.
504 King 20 Cliffside 32 Eglinton West 37 Islington 44 Kipling South 45 Kipling 54 Lawrence East 63 Ossington 66 Prince Edward
67 Pharmacy 68 Warden 80 Queensway 86 Scarborough 89 Weston 90 Vaughan 110 Islington South 111 East Mall 118 Thistle Down
Signs on many routes will change for standardization including:
13 Avenue Rd
30 High Park North (Branch letters removed)
75 Sherbourne
116 Morningside
203 High Park
302 Kingston Rd-McCowan Night
332 Eglinton West Night
924 Victoria Park Express
929S Dufferin (new Dufferin Station short turn for CNE service)
960 Steeles West
Routes renamed:
74 Mount Pleasant
103 Mount Pleasant North
171 Mount Dennis
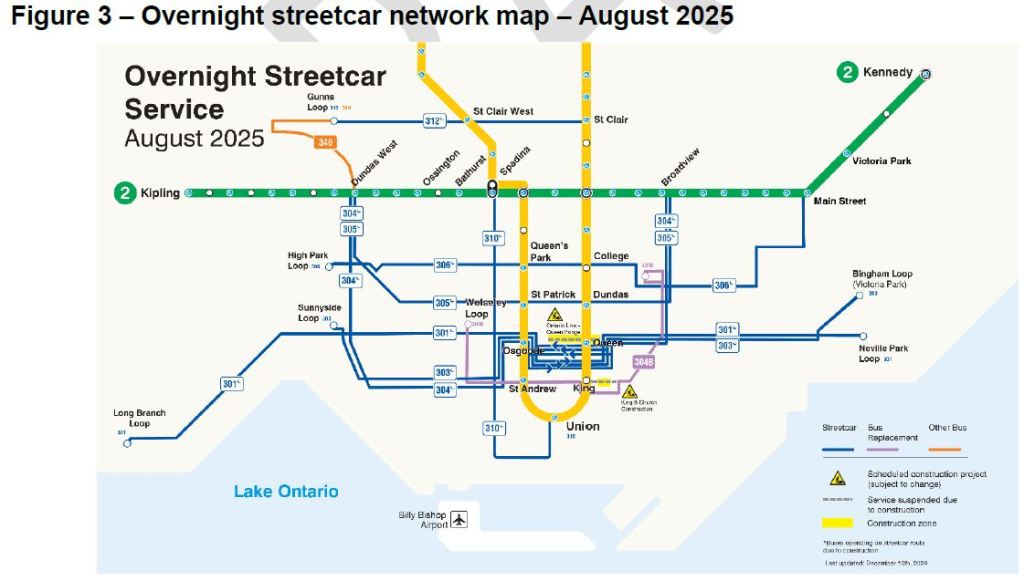
Streetcar Service Changes
301 Queen Night
Two early morning trips extended west from Roncesvalles to Humber Loop to improve the transition to 501 daytime service.
504 King
Official route standardized to operate via Queen and Shaw. This has been in place since May 2025, but the schedule change will also allow trip prediction apps to “see” cars on the route they are actually using.
Bus Service Changes
22 Coxwell / 92 Woodbine South
The holiday interline at the south end of the routes will be discontinued.
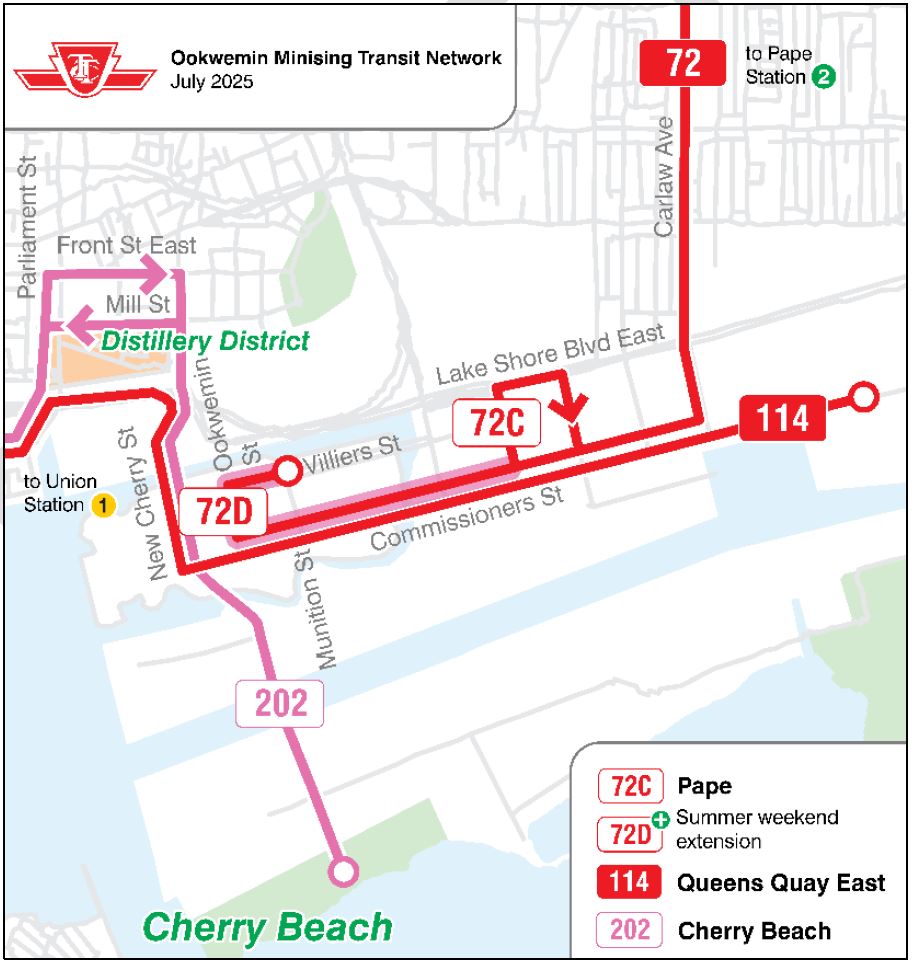
72 Pape
The 72C Commissioners service will be extended on weekends except late evenings to serve Biidaasage Park. The service will operate westbound via west on Commissioners Street to north on Ookwemin Street (formerly Old Cherry Street). Eastbound service will run from Ookwemin Street east on Villiers Street, u-turn to west on Villiers Street, south on Ookwemin Street, east on Commissioners Street
100 Flemingdon Park
Weekend service revised for reliability.
102 Markham Road
Added trips on weekdays SB from Warden Station to Steeles at 4:47 and 5:13 am to reduce crowding.
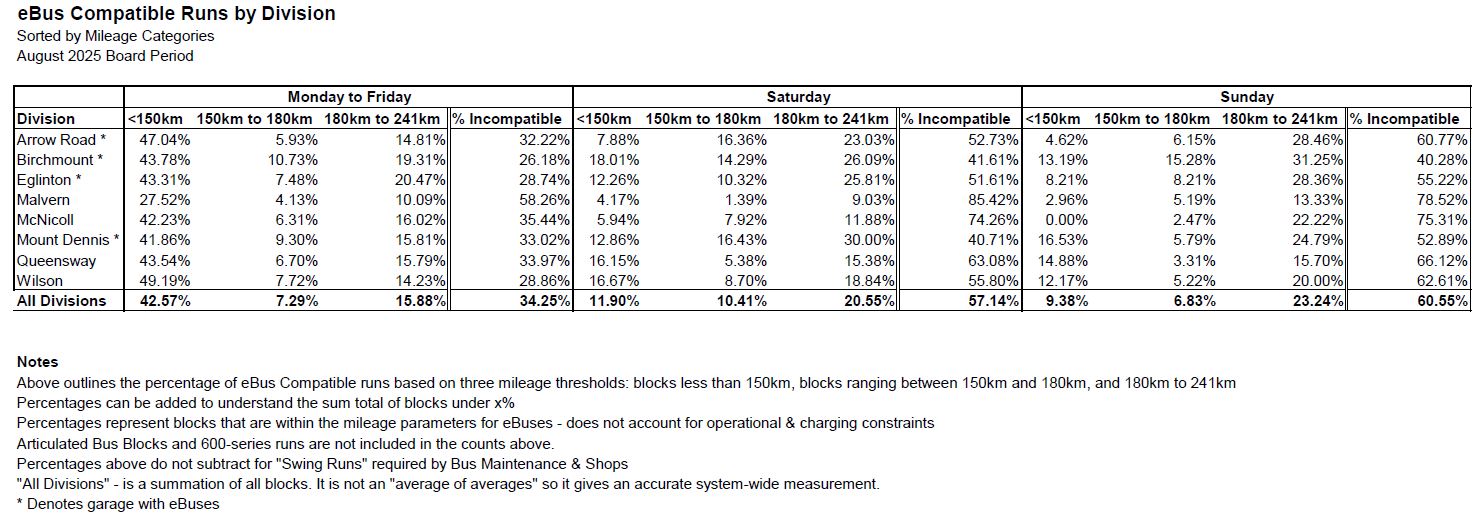
This report is covered in a separate article. Additional comments arising from the meeting have been added there. See The Troubled State of TTC Green Buses.
Despite the extensive catalogue of issues with the Green Bus program, the TTC Board wasted no time in adopting the report without debate on an enthusiastic motion by Commissioner/Councillor Saxe. There was a sense that they could not wait to get this item off of the table.
However it is likely to come up again at the Strategic Planning Committee in discussions of future service improvements and the resulting fleet size, and the City Auditor’s review of the program will land on Saxe’s Audit & Risk Management Committee agenda sometime in 2026.
In the meantime, the TTC needs honest reporting of the performance of its growing eBus fleet as more buses arrive. In the short term, they can paper over range issues by using these vehicles on blocks of work that do not tax their capacity (buses that are only in service for part of the day, and on less stressful routes). The disparity between charging capacity and fleet size discussed in the report will also affect availability, and “performance” metrics should include not just how far a bus can travel, and how reliable it is from failure, but also whether it is even available for service.
Meanwhile, major systems elsewhere in North America continue to hedge their bets on eBuses with parallel orders of hybrids as Toronto is now doing.
This is a long report, and some key information is buried down in the appendices. It reveals, among other things, that:
Delivery of the battery-powered eBuses is running late. This is an industry-wide supply chain problem.
The TTC plans to buy 200 more hybrid buses as an interim step to allow retirement of their oldest vehicles.
The reliability of the eBuses is below the originally hoped-for “long range” capacity and they are only achieving about 250km per charge. That is with a new battery, and the value is expected to drop as batteries age.
Much of the TTC’s currently scheduled service cannot be operated with standard range eBuses, and planned change-offs will be needed to cover the span of service typical on TTC. This will add to mileage and operator hours.
Charging operations at garages are constrained by a shortage of installed charge points compounded by limitations of electrical capacity.
The problem of shorter range and limits on charging fundamentally change how garages operate for diesel/hybrid buses where refuelling is quick and is performed as part of routine servicing as buses come out of service.
The need to shuffle buses between charge points and storage locations will add to staffing requirements at garages.
eBuses cannot replace hybrids on a 1:1 basis because of the charging constraints.
There is a possibility that the TTC will have to store new buses unused because of charging limitations.
The policy decision to deploy eBuses at all garages simultaneously requires that maintenance equipment, staffing and training must be provided everywhere at once rather than a garage by garage transition, and that concurrent support for hybrids must also exist at all sites.
On route charging (using charge points at key locations to permit buses to “top up” their charge) was considered early in the project, but was rejected for various reasons including a desire to be up and running quickly to secure special eBus subsidies. It is now treated as a possible option, but with implementation five years away.
The comparative performance of hybrids and eBuses in the CEO’s monthly Metrics Report artificially understates the hybrid numbers and makes the eBuses appear to perform closer to hybrid buses than is actually the case.
The TTC does not address garage capacity issues and, indeed, speaks of shifting the need for a 10th garage off by over a decade through a “garage enhancement” project. This scheme echoes other past budget juggling to shift major infrastructure requirements and their funding needs off of the current planning calendar.
The report contains no discussion of the implications of technical limitations for the future of bus service especially in the context of any desire to drive up ridership with significant service improvements.
Overall, the report describes a project that has finally addressed the technical realities of eBuses, something that has been glossed over for years. Some aspects of eBus migration, notably charging capacity, time and garage management issues, are presented almost as new discoveries even though they are not new to the industry. Whether this is wilful ignorance or downplaying of problems on a high-profile project, the effect is the same. As with a few other major Toronto projects, the TTC is saved from some pitfalls because schedule extensions give them more time to deal with issues that should have been foreseen.
The project began in 2017 when, shamefully, the TTC Board under then Chair Josh Colle, allowed reps from BYD to pitch their wares in the guise of a “deputation”. This was “facilitated”, to use City Hall speak, by then TTC Board member Minnan-Wong with behind the scenes support from then-Mayor Tory. The video is still available on YouTube. The original hype from BYD, who hoped for a large untendered contract, is falling away, but the implications for the future of TTC bus service are only now coming out in the open.
(Those of us with long memories will recall the combined efforts of TTC management, MTO “innovative technology” staff, the gas industry and Ontario Bus Industries to replace the TTC’s trolleybus system with “clean” natural gas buses on a sole-source contract. We have been here before.)
As the 60-bus pilot project wore on, BYD was only able to supply half of the 20 buses originally allocated to them. Proterra, now out of business, got 25 and New Flyer got the other 25. At the point I write this article (July 13 at 3:00 pm, none of the BYD buses is reporting a position on the vehicle tracking system. (14 of 25 Flyers, and 8 of 25 Proterras are active.)
New Flyer is supplying eBuses to the TTC, and of the fleet numbers 6000-6203, the highest number reporting its location is 6141. Fewer than half of the delivered buses is reporting a location. Nova Bus deliveries on a 136 bus order are slower, and only 6 buses are reporting locations. (See Appendix E later in this article for information on delivery progress.)
An important issue when considering reliability stats is that a bus that never runs never fails, and so does not contribute to MDBF (Mean Distance Before Failure) stats. These buses do, however, count as part of the TTC’s active fleet and inflate its apparent size including chest-beating claims to the number of eBuses Toronto has. Having them and operating them are two different issues.
When there are only a few trial vehicles in the fleet, how well they work has little effect on service, especially through the pandemic era when service was not running at 100% of former levels. The situation is much different as recovery to full service, notably on the bus network, is in sight, and both City Council and some TTC Board members talk of an aggressive increase in transit service to wean motorists out of cars and accommodate population growth.
The TTC has already reached the point where it must keep elderly vehicles in service to compensate for performance issues with the new fleet, and this situation will compound as more eBuses arrive. There is even a question of where to store all of these buses if they cannot be actively, reliably used. The planned order for hybrids does not simply buy time while supply chain issues are worked out and battery technology improves. It is an admission that the electric fleet plan is not working out and that service at current levels is threatened. Major service expansion is simply not possible.
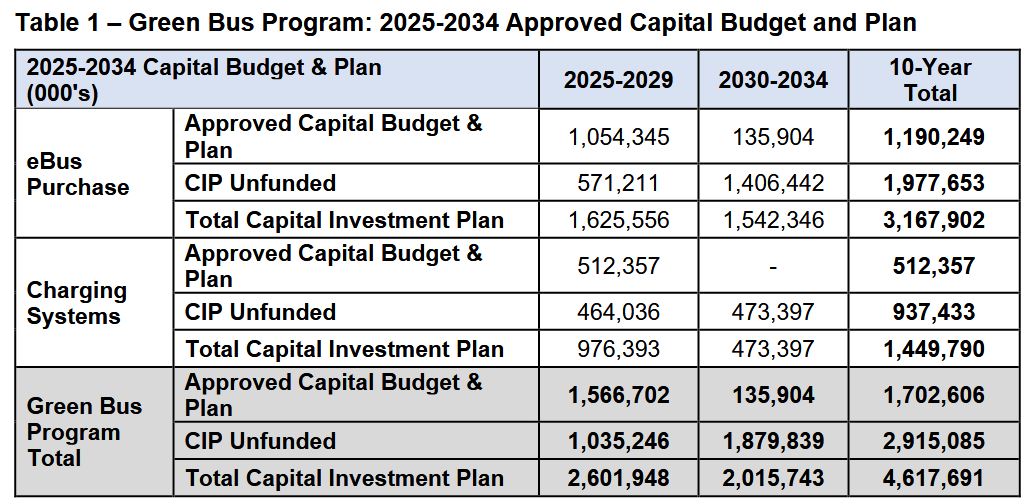
On the financial side, migration to eBuses is not cheap, and the project is funded only to about 37%. An important discussion nobody at the City or TTC seems willing to address is whether it is better to lower emissions by converting the fleet and all facilities to electric operation, or if buying and operating more buses to get riders out of their cars and improve mobility in the city should take precedence. Capital projects are seductive because they are often funded with “other people’s money”, but even the special eBus subsidies only go so far.
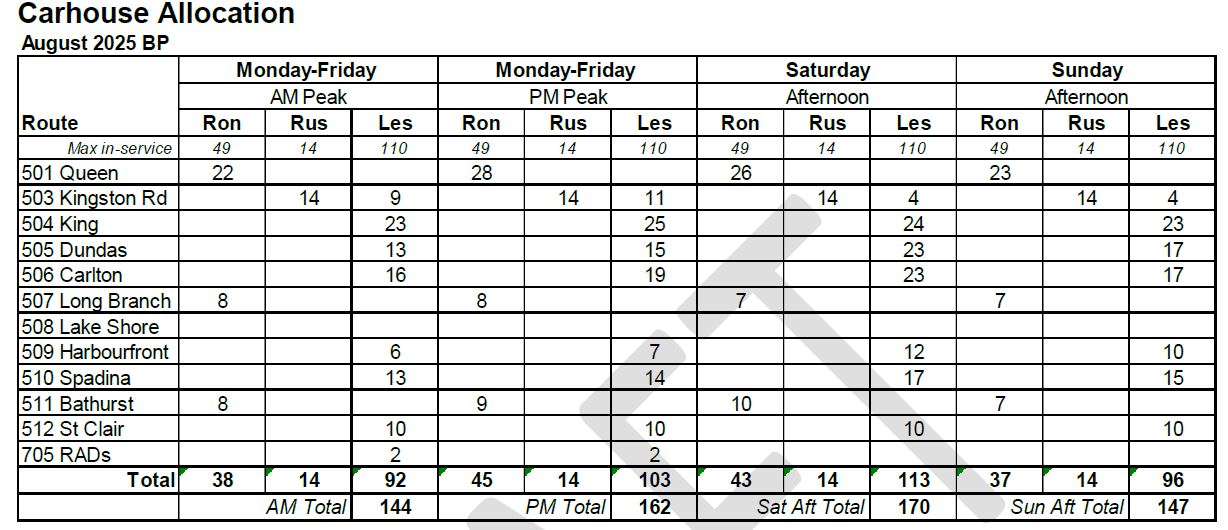
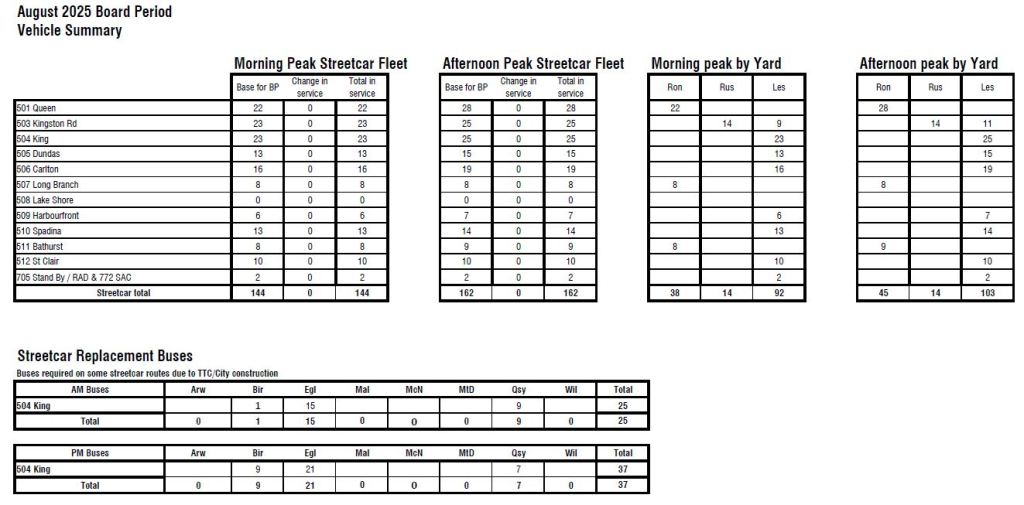
It is both ironic and sad that the electric streetcar system has many surplus vehicles thanks to service cuts, but also from a shortage of operators. The TTC plans to move to a six-minute service on three routes in Fall 2025, but may have to bus one line (503 Kingston Road) for want of streetcar drivers.
Peak streetcar service in July 2025 is 170 cars (on Saturday afternoons, not during the weekday peaks!), but the fleet will soon number 262 cars when the last of the new Flexitys arrives. 50 of the 60 new streetcars, 4603-4662, are actively reporting locations, and the highest of these, 4655, shows how close to complete the deliveries are.
In the rest of this article, I will explore issues with the eBus project and plans in more detail, but the last Appendix deserves to be here, “above the fold”.
A review commissioned by the TTC Board from Deloitte in 2023 flagged issues with “project management improvement in the areas of schedule, cost, scope, reporting, risks and issues, governance, and interdependencies management”. Of the 37 recommendations, 18 are closed and 19 are in progress.
An APTA (American Public Transit Association) peer review is planned to begin in September 2025, and the City’s Auditor General plans to review the eBus program.
It is quite clear reading through the report that the TTC eBus project is in trouble both because of external factors (industry conditions) and because the implications of the technology were not fully understood or appreciated. Moreover, the transition will require far more than buying some new buses and plugging them in. The TTC loves to claim that is a leader in the field, but this is likely only true in comparison with smaller systems that do not have the capacity. Within the industry, TTC is not at the front of the pack.