TTC Low Floor LRV Roll Out Plan Released (Update 3)

Updated June 25, 2013:  At the June 24 Commission meeting, CEO Andy Byford presented further details of the roll out plan.  This information is added to the end of the article along with additional information I received from TTC staff.

Updated June 23, 2013:  A section has been added at the end of the article discussing service levels and fleet planning during the transition from CLRV to LFLRV operation on routes.

The TTC has released its roll out plan for the new fleet of low floor light rail vehicles.

The TTC proposes to increase capacity on all routes during peak periods, although by varying amounts.  Off peak headways will be almost unchanged with an effective doubling of capacity on all routes using the 50-foot CLRVs, and a 1/3 improvement on routes with the 75-foot ALRVs.  As a general policy, this is a very good start because it avoids replacing capacity-for-capacity with concurrent widening of headways and degradation of service.

The new service levels are shown on the presentation at pages 7-8, and the changes in peak period capacity are summarized in the following table.

LVLRV_Capacity_2013.06

The amount of added capacity varies by route and between the AM and PM peak periods.  This is supposed to represent the TTC’s estimate of provision for unmet demand although some numbers are a bit hard to believe.

Oddly enough, by the time the new fleet is in place, all of it has been used up serving existing routes (with a 20% allowance for spares).

Off peak services are almost unchanged with the odd effect that there is better planned midday and evening service on some routes than in the peak periods.  The TTC claims that the off-peak levels are set based on a minimum headway policy.  However, it does not make sense to cut service during the peak period.  This seems more the product of two separate plans drawn up without cross-reference to each other than the outcome of careful planning.

Continue reading

King Street: Twenty Years of No Transit Priority

Today, the Toronto Transit Commission passed a motion asking for a report on reserved lanes for King Street.  Yes, you read that correctly: this is a street that, in theory, has had peak period transit lanes since 1993.

Here is the motion moved by Chair Karen Stintz and seconded by Commissioner John Parker:

1. That the Board request the Public Works and Infrastructure Committee to direct Transportation Services to prepare a joint City-TTC report on the feasibility and merits of implementing morning rush hour reserved streetcar lanes on King Street, including details pertaining to extent/boundaries of the lanes, means of designation or separation of the lanes, means of enforcement, means of monitoring effectiveness of the lanes, cost of implementing such lanes, and effects on other traffic in the corridor, as well as study of traffic management measures to mitigate delays at other pinch-points on the King Street route. The report should also include recommendations for a trial implementation of such lanes, including the earliest practical date for undertaking such a trial. If appropriate, this reporting-back could be contained within the forthcoming Downtown Transportation Operations Study. (From Chair Stintz’ blog.)

This is a substantial step back from a desire to ban cars completely on King, a proposal with which Stintz appeared to agree, at least for a Pan Am Games trial period in 2015, in the media [CBC Star].  The pre-amalgamation Toronto Council implemented peak period transit lanes on King from Parliament to Dufferin in 1993, but these were a complete failure thanks to lack of enforcement.  The downtown section, from John to Jarvis, was removed in 1997.  Stintz’ position on timing has changed also with a shift from the Pan Am Games to the “earliest practical date”.

In March 2000, TTC staff reported on “Operational Improvements on 504 King Streetcar” [this report is not available online].  Among the actions taken or under investigation were:

  • Adding a second on-street Route Supervisor “to manage the line and obtain better schedule adherence”.
  • Use of rear-door loaders at major stops to reduce dwell time.
  • Expansion of Proof-of-Payment to the 504 route possibly including reassignment of the ALRVs from Queen to King Street, or the use of coupled CLRVs (this was not implemented).
  • Improved enforcement of parking regulations (occasional blitzes have taken place, but nothing lasting).
  • Restoration of the reserved lanes between Jarvis and John including overhead signs such as those used for the reversing lane on Jarvis.  “Staff believe that the lanes can be made to work effectively, but this will require the lanes to be much more clearly marked and vigourously enforced.”  (This was not implemented.)
  • Continued enforcement of turn restrictions and of the exclusive nature of the streetcar lanes.  (Almost non existent.)
  • Further assessment of problem locations.  (Judging by actions to date, little has been done beyond a study.)

This is not a new problem.  What is very old is a lack of political will to do anything about the situation.

Simply reserving the streetcar lanes during any period of the day is unworkable if the curb lanes are not guaranteed to be free of taxi stands, parking and loading, not to mention construction occupancy arrangements for new condos.  The effect on King will differ between the financial district (east of Yonge to Simcoe) and the entertainment district (Simcoe to west of Spadina), not to mention the Bathurst/Niagara condo district (Spadina to Shaw).  A one-size-fits-all configuration is unlikely to work or be acceptable.

As a four lane street, and with only a temporary reservation, physical barriers are impractical.  Traffic must be free to move between lanes both when the reservation is not active, and when a curb lane blockage requires movement into the streetcar lane.

I have already written about the limited benefit an AM peak reservation will have even if it is well-enforced.  Running times on the 504 King car show little sign of traffic congestion until around 9:00 am when parking is allowed and commercial activity begins on the street.  If the TTC were serious about “fixing” King Street, they would look at the issue on an all-day basis, but that’s not what the Stintz motion does.  She goes for the least controversial option while still attempting to give the impression of doing something for the riders.

(For more of the history on previous King Street and transit priority schemes, please see Transit Toronto and a 2001 TTC report.)

The most disheartening part of the debate at the Commission Meeting was that nobody in the room, no other Commissioners, none of Management, piped up to say “but we already have a reserved lane on part of King, and used to have more”.  This is all treated as if it is a brand new idea, not a 20-year old retread from the days when Jack Layton was a City Councillor.

Was everyone too embarrassed?  Was it an attack of Emperor’s-New-Clothes syndrome?

TTC meetings are turning into friendly gatherings where good news is the order of the day.  There’s nothing wrong with good news, but some decisions involve difficult choices and political battles.  You can’t be an advocate for the good of transit riders and expect everything to be smooth, quiet sailing, especially with an administration so hard set against anything but subways we cannot afford.

The whole matter will now wander through the City’s committee structure, first to Public Works and Infrastructure from which it might not emerge given the Mayor’s anti-streetcar rhetoric.  Will Chair Stintz ensure that even this modest study proposal survives, or is this an empty motion showing concern without action?

Preliminary Analysis of King Car Operations AM Peak Downtown (Updated)

Updated June 24, 2013 at 6:10 pm:  In the original version of this article, I mentioned that charts for March 2012 would be added in an update.  These charts are now included, and there are minor changes to the text to reflect this.

Recently TTC Chair Karen Stintz and CEO Andy Byford proposed a trial operation of King Street between Shaw and Parliament as a reserved zone for transit vehicles and taxis during the AM peak period.  Their concern and claim is that they cannot provide better service without exclusivity over this area.

I believe that this proposal suffers from a lack of detailed knowledge both of the way the line actually operates and the causes of systemic delays (aka “congestion”) to service.  The AM peak is much less of a problem than midday, PM peak, evening and weekend operations on the King route.  The TTC would do well to concentrate its proposals on areas and problems where there would actually be some benefit.  Asking for a total ban on cars rubs motorists (and their political supporters) the wrong way, and needs to be justified by solid data showing how transit would be improved.  The TTC has not done this.

Normally when I write a post with analysis of a route’s operations, I prefer to wait until I have more of the data formatted for presentation.  In this case, the debate is already underway in the press and in social media.  To contribute some technical background, I have started analysis of route 504 King for the months of November 2011, March 2012 and May 2013.

As with past analyses, the information is taken from the TTC’s vehicle monitoring system known as “CIS” which uses GPS to track the location of all vehicles every 20 seconds.  The GPS data are converted to a “flattened” view of a route which is a straight line (think of a piece of string pulled out taut).  Once this is done, plotting vehicle movements, headways at points and running times between points is greatly simplified.  (I plan to publish a separate article in coming weeks for those interest in the details of this process.)

Note that vehicles on 508 Lake Shore are not included in this analysis.  Only three inbound trips are scheduled during the AM peak.

Because the proposal addresses a reduction in running time and reduction of congestion in the central area, I will concentrate in this first article on movement of streetcars over the proposed exclusive area.  Other sections of the route and aspects of operation (e.g. headway reliability, short turns, time spent serving stops) will be the subject of future articles.

Continue reading

Metrolinx Announces Design Changes and Public Meetings on Eglinton LRT (Update 8)

Updated June 17, 2013 at 6:15 pm:

In the comment thread for this article, there has been substantial discussion about a “south side option” for the Eglinton LRT between the portal at Brentcliffe and Don Mills Road.  I have after several requests obtained an answer from Metrolinx about whether this had ever been considered.  Here is their reply sent by Jamie Robinson today.

Placing the LRT on the south side of Eglinton Avenue East in the vicinity of the West Don River/Leslie Street was included in three of five options compared to the at-that-time base case (which was underground throughout the corridor) in the Don Mills River Crossing Study prepared in February 2012 by HMM. However, the LRT would have been in a completely separate right-of-way on a new bridge across the West Don River in order to maintain current vehicle capacity of Eglinton Avenue East (i.e., no conversion of travel lanes to LRT tracks).

That report recommended one of the options that included a continuation of the bored tunnel from the west to pass under the West Don River and portal east of the Don Valley Parkway. That option was selected because the cost differential with the at-grade options was minimal, provided that a station at Leslie Street was not required. If a Leslie Station would be required, then one of the at-grade south side options was the preferred option. MX decided to proceed with the first option, and further refined that option with a launch at Don Mills Road and continuing eastward with the EA alignment, which led to the preparation of the Eastern EPR Addendum.

The at-grade south side option was not compared to the EA Option.

Generally, however, It is very difficult (if not impossible) to relocate the portal from the centre of Eglinton (as proposed in the current design) and shift it to the south side of the right-of-way and continue to use the existing bridge. The “viaduct” option that HMM reviewed, was suggested by the public and was presented during the recent consultations for the changes in the East, was more expensive and required an EA amendment. Due to project implementation timelines the project is proceeding with the EA option.

In brief, yes they looked at it, although not in the context of the original EA.  Shifting to the south presents problems for the river crossing and the tunnel launch shaft, but might have survived as an option if Metrolinx had not decided to go all-underground to Don Mills.  Now that they’re back on the surface, they are sticking with the original plan.

Continue reading

TTC Route Ridership and Service Statistics 2004:2012 (Updated)

Updated June 16, 2013 at 10:15pm:  An epilogue comparing system statistics for 1989 has been added.

The TTC publishes statistics on its surface routes showing the most recent all-day riding count, the resources (vehicles, vehicle hours and vehicle mileage) consumed by a day’s operation, and the estimated cost of one day’s service.

For many years, this information was included in the annual “Service Plan”, but the last one of those was published for 2008.  The TTC’s Transit Planning page includes the 2008 plan, as well as the 2011 and 2012 figures as free-standing tables.

(In earlier years, the tables included a “revenue” for each route based on the ridership, although the method of calculating this varied over the years.  This was eventually dropped because there is no way to allocate fare revenue in a system like the TTC’s without producing distortions in the resulting “profitability” of routes.  Fares, especially passes which make up the bulk of adult system use, are collected on a flat basis for an entire trip or for a period of time, not for distance travelled nor number of vehicles used in a trip.)

This information becomes more interesting when viewed over time to see the evolution of ridership, service and allocated costs.

Continue reading

Waterfront West Update (Revised June 15, 2013)

Updated June 15, 2013 at 4:20 pm:

The shortest streetcar line in the world exists, albeit without service, as the first piece of new surface track appeared on the 509 Harbourfront route at the Peter Street slip.

IMG_3828w

On June 11, the eight expansion joints for the future bridge crossing were set more or less in place on the new bridge deck.

IMG_3830w

By June 13, the tangent rails had been added, although the expansion joints at the west end of the bridge (below) …

IMG_3834rw

… had not yet been attached.

Note that, like subway track, the rails are mounted directly on the bridge deck, not on ties.  This approach is needed because the bridge design does not include the depth needed for the layer of ties normally found in TTC streetcar track.

IMG_3833w

The view below shows a close up of a test section of track built just west of the corner of Bay and Queens Quay.  The use of the rubber sleeve to mechanically isolate the track  is quite clear.  Under the plastic covers (with duct tape on them) are Pandrol clips holding the track to steel plates in the slab below.  The slab containing the track is separate from the base slab so that only excavation of the top layer is needed for track replacement.

IMG_3776w

The original Harbourfront track did not have the rubber layer and was quite noisy because the whole trackbed vibrated as cars passed.  This is one of the last pieces of mainline “thunder track” to be replaced on the TTC network, a process begun 20 years ago.

Continue reading

Service Changes Effective June 23, 2013 (Updated)

Updated June 13, 2013:

Contrary to the originally announced plans, the 31 Greenwood bus will not divert to Donlands Station during reconstruction of the bus loop at its home station.  Instead, the  buses will loop via Greenwood, Strathmore, Linsmore and Danforth stopping outside of the station.

Major service changes for June 23, 2013 include:

  • Service removal or rerouting for several York Region contract operations by the TTC.  These were proposed as part of YRT’s 2013 Service Plan.  (Specific changes for Vaughan and for Markham.)
  • Seasonal changes to many routes.  The summer cutbacks are generally in line with 2012 although in a few cases routes or periods that had cuts last year are not affected in 2013.
  • Construction changes including:
    • Revised service on many routes in the Beach and in southwestern Scarborough caused by the reconstruction of Kingston Road.  Streetcar service will turn back at Woodbine Loop, and bus service will be provided eastbound only from Queen to Victoria Park.
    • Rerouting of 31 Greenwood to Donlands Station for construction at Greenwood.

The service budget for September 2013 will be about 3.4% higher than the budget for the corresponding period in 2012, and 1% higher than for March 2013.

2013.06.23 Service Changes

More Metrolinx New Math (Updated)

Updated June 8, 2013 at 12:05pm:

Metrolinx has issued a correction via Twitter (where this discussion started) clarifying that, yes, it is person-years of employment, not jobs, that they are creating, and acknowledging that the graphics and tweets using them were “shortened”.

Anne Marie Aikins ‏@femwriter

… Report explains “person yrs of construction & LT employment” pg 30. Graphs/tweets shortened. Good reminder. Thx

[Anne Marie Aikins is a Media Relations Manager at Metrolinx]

That’s putting it mildly.  Someone did a calculation to figure out how many ACCs would be needed to hold all those people, and so clearly did not understand how the numbers should be used.  Someone put that chart in the Metrolinx report.  The report survived Board scrutiny without anyone, including their members from the banking sector, spotting the problem.

Ooops.

The original post from June 7 follows below.

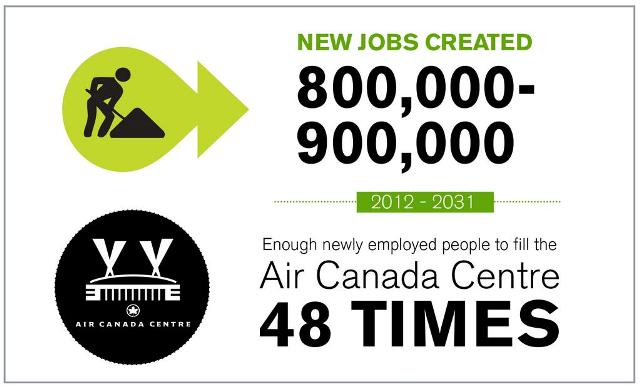
Metrolinx recently published a graphic purporting to show the employment effect of the Next Wave’s spending over twenty years.

MetrolinxNextWaveJobsWeb

These numbers are a complete fabrication and show how an organization more concerned with puffery than with accuracy can screw up basic arithmetic.

The statement here is that “enough newly employed people” would fill the ACC 48 times.  The official capacity of the ACC is 19,800, and so we’re talking about 950,400 newly employed people.  That’s roughly 1/3 of the entire population of Toronto.

The problem here is the confusion between employees and employee-years.  Metrolinx plans to raise $2b annually for twenty years.  Let’s assume that it will all be spent on job creation, not on getting more work from an existing pool of labour, nor on purchasing offshore technology such as rolling stock, control systems and managerial expertise.  We’re talking about design, engineering and construction, not the cheapest of professions and trades, and a reasonable average fully-burdened (including benefits) cost per job would be at least $80k.  (Governments have paid vastly more per new job on things like auto plants.)

The math is straightforward:  $2b/year divided by $80k gives 25,000.  If the entire amount goes to net new hires, then that’s 25k.  Do this every year for 20 years, and you produce 500k person-years of employment, but not 500k new hires.

There will be some multiplier effects in that an employed person has money to spend and that will find its way into the local economy.  How many new jobs will result is another matter.

We can look at this from the reverse angle: if there is $40b on the table, and it has to be shared among 800k new hires, then each of them will receive $50k.

In this, I have assumed that even the 25% of revenue dedicated to municipal projects creates jobs on the same basis as for the 75% allocated to the Next Wave.

Metrolinx has similar math challenges on commuting times when they routinely confuse avoided future congestion with actual savings.  Moreover, the claimed “saving” only occurs if the entire Big Move is built, something that appears vanishingly likely.  Because Metrolinx only ever discusses their fully-built scheme, we have no idea of how much “saving” will accrue for intermediate stages of the network, nor of the variation in benefits across the region.  This most basic of business analyses is totally missing, at least in any published Metrolinx papers.

Metrolinx really needs some remedial work on economic analysis and basic arithmetic.  Think about it: does it really take 1/3 of Toronto’s population to build a transit network? I have to repeat: the Metrolinx claim is not for job-years, but for newly employed people, nearly one million of them. That’s a basic reasonableness check anyone should be able to spot. How did such a claim even get out the door?

Howling errors like these job creation numbers undermine credibility not just of an incompetent agency but of the government who looks foolish for making claims they cannot possibly deliver.


What Does Subway Construction Cost?

An interesting article on the site Pedestrian Observations was recently linked on Twitter by Taras Grescoe (@grescoe), the author of Straphanger.  In Comparative Subway Construction Costs, Alon Levy attempts to bring together projects worldwide, adjust for currencies, inflation and other factors to derive comparable US$ values for subway construction.  The numbers are interesting in light of complaints about overpriced construction in Toronto.

The underlying problem, of course, is that no two projects are the same.  Varying proportions of underground construction, different soil/rock/water conditions, variations in station numbers/size/depth, not to mention rolling stock procurement and yard/maintenance facilities all affect the total cost and hence the cost/km.  Stir in political differences and the ease or difficulty with which projects are approved, and the number of variables is quite high.

All that said, Toronto’s costs are not wildly out of line.  This is not to say that they may not be excessive, but the cause could be our extended design and approval process and a preference for deep bore tunneling that drives up construction costs compared to shallower cut-and-cover.

The argument for LRT has always turned on the availability of a surface option where it is practical.  Whether we choose to exercise this in every possible case is another matter.

There are cases where underground construction is the only practical way to build a line, but that should not condemn Toronto to building only subways without looking at alternatives.