Updated October 15, 2015 at 10:20 am:
Because the options for the Waterfront West line are not fully explained or explored in the City report, I have added the drawings of the options from the Environmental Assessment to the end of this article.
A few weeks ago, I reported on a presentation at the TTC Board meeting by Deputy City Manager John Livey on the status of various rapid transit plans and studies. This was by way of a preview of reports that were expected at the City’s Executive Committee meeting on October 20, 2015.
One of these reports has now surfaced on the subject of Waterfront Transit, while another on SmartTrack is still in preparation. (Reports on the Relief Line and Scarborough Subway studies are not expected until the new year pending results from the UofT’s new demand model.)
The new report proposes a “reset” in the status of the many waterfront studies and proposals given that many of them are incomplete or out of date. The area of study will be south of Queensway/Queen from Long Branch to Woodbine, although there is passing mention of Scarborough which has its own collection of transit problems in the Kingston Road corridor.
The fundamental problem along the waterfront and areas immediately to the north is that population and plans for development continue with no end in sight, while transit planning, such as it exists at all, looked much further afield for signature projects. Moreover, origins and destinations in the present and future waterfront are not conveniently located along a single line where one scheme will magically solve every problem. Transit “downtown” is not simply a matter of getting to King and Bay. There is a mix of short haul and long haul trips, and a line designed to serve the first group well almost certainly will not attract riders from the second.
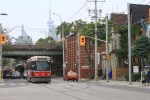
There has been significant growth in many precincts along the waterfront, including South Etobicoke, Liberty Village, Fort York, King/Spadina, City Place, South Core, and King/Parliament. Further, significant growth is planned for emerging precincts, including Lower Yonge, East Bayfront, West Don Lands, North Keating, Port Lands and the First Gulf site. There is currently a latent demand for transit south of Front Street as witnessed by transit loading on the King and Harbourfront streetcar services. King Street, for example, represents the most southerly continuous east/west transit line and is regularly experiencing near or at-capacity conditions through much of the weekday peak periods. The extent of latent and anticipated future demand creates an imperative for defining a long-term transit solution as soon as possible. [pp 1-2]
Better transit on King and Queen, whatever form it might be, will address demand from redevelopment of the “old” city north of the rail corridor, but it cannot touch the “new” city south to the lake. Service on the rail corridors (Lake Shore and Weston) can address some longer trips, but with constraints on both line capacity and service frequency. Despite politically-motivated claims, the GO corridors will not be “surface subways” with service like the Bloor-Danforth line, and GO service is constrained to operate through some areas that are not well placed relative to the local transit system.