This post continues from Part I, and is broken off from it simply in the interest of keeping each article a reasonable size. For introductory comments please see Part I.
Routes included here are:
65 Parliament 70 O’Connor 72 Pape 75 Sherbourne 83 Jones 87 Cosburn 88 South Leaside
91 Woodbine 92 Woodbine South 111 East Mall 112 West Mall 114 Queens Quay East 154 Curran Hall 168 Symington
Problems seen on many routes in Part I show up here as well including:
Less reliable service on evenings and weekends
Missed trips due to missing buses without an attempt to rebalance headways to eliminate wide gaps
Most readers are only interested in some of the routes here, and that is why I have only published a few charts per route with links to details in PDF sets. Only the truly keen (some might say obsessed) and, of course, those whose job it is to know these details will look at just about everything.
Apologies if I’ve missed your route. I plan to look at others once the Line 5 and 6 changes fully cut in to see how new service designs work.
To those who ask why I publish so many of these route analyses, the answer is, sadly, that it takes a lot of data to make the point that erratic service is not found on only a few routes, nor only on major city-spanning bus and streetcar routes. “Traffic congestion” is too simplistic an explanation too often raised by the TTC, and it simply does not apply in some times and locations where these routes have poor service. TTC has no metric to report on this problem, and therefore no tracking mechanism to flag issues or the result of corrective strategies, if any.
The City of Toronto has announced that work at King & Dufferin is finished and the intersection will reopen to traffic on Wednesday, October 29 after 7pm.
Regular service will be restored on 29/929/329 Dufferin, and the 503 Kingston Road bus will be extended west from Joe Shuster Way (east of Dufferin) to Roncesvalles at 5am on Thursday, October 30.
TTC will test the new track and overhead during the week of November 3 and will restore 504 King and 508 Lake Shore services from their current Shaw/Queen diversion when the intersection is cleared for streetcar operation.
Meanwhile, the TTC CEO’s Report notes that six minute or better service will come to 505 Dundas and 511 Bathurst from 7am-7pm 7 days/week starting November 16.
Many of the service analyses on this site concern larger, major routes like the streetcar lines and bus routes crossing substantial distances in the suburbs. The picture of service quality is not a pretty one. Starting with this article, I will review service on several of the shorter routes, many with infrequent service, to see how the TTC fares. Short routes get frequent stops at terminals where headways can be reset, but irregular service can mean long waits for riders.
Many of these routes show very irregular service and one cannot help asking how this affects ridership. The TTC talks about improving service on major routes with interventions such as reserved lanes, but seems incapable of managing headways on relatively minor routes. There is a parallel here with declining maintenance quality where issues with the “little things that don’t matter” start to bleed into the major services and the system drives away as many riders as new services might attract.
Common problems seen on most of the routes reviewed here are:
Headways do not generally stay within a narrow band, but can be badly scattered especially for evening and weekend service.
In spite of this scatter, it is quite possible that the routes meet the TTC’s service standards which merge performance over an entire day, and provide a wide margin for data points outside of the target range (40%).
Review of the detailed tracking data (not included here in the interest of space) shows that some of the widest gaps occur because of missing buses. There is a metric in the service standards for missed trips with a goal to “minimize” them, albeit with no target. Trips can be missed because no operator or vehicle is available, or because of a short turn before a bus reaches the terminal, or because of such extreme lateness that it might as well not have operated. This statistic has never been reported in the monthly service quality metrics.
Bus bunching occurs even on routes with scheduled headways of 20-30 minutes, and this can persist for multiple trips showing little effort to space out service. Where the quality metric is “on time performance”, spacing service to compensate for bunched or missing vehicles can actually work against a “good” score even though what riders see would be more reliable.
31 Greenwood 49 Bloor West 50 Burnhamthorpe 62 Mortimer 64 Main 65 Parliament
An additional 13 routes will be included in Part II of this series.
65 Parliament 70 O’Connor 72 Pape 75 Sherbourne 83 Jones 88 South Leaside
91 Woodbine 92 Woodbine South 111 East Mall 112 West Mall 114 Queens Quay East 154 Curran Hall 168 Symington
After the “more” break, data for one route, 8 Broadview, are shown in detail as an introduction. Further routes are shown only in summary, but with links to PDFs containing all of the charts for readers interested in them.
The 512 St. Clair car received improved service in September 2025, and this article updates the charts with headway stats to September 30 showing the combined effect of more service and route management.
Weekday service over the 2024-25 period has had three main levels: bus operation during a long-running construction project in 2024, followed by streetcar service with headways improving only in the last month.
Effective
AM Peak
Midday
PM Peak
Early Eve
Late Eve
5-Sep-23 (Bus)
3′
5′
3’30”
6′
10′
24-June-24 (*)
8′
8′
8′
8′
10′
2-Sept-25
6′
6′
6′
8′
10′
(*) For a period in Oct-Nov 2024, the route was split with streetcars operating from Gunn’s Loop (Keele) to Bathurst Station, and buses from Oakwood Loop to St. Clair Station. This was not shown in the published service summary, but does show up in the observed data for the portion of the route operated with buses.
Generally speaking, the range of headways at various points on St. Clair did drop in September 2025, although the effect is more pronounced early in the month than later. Whether this indicates a trend away from tighter headway management as the month wore on will not be clear until more data have accumulated.
During the period of bus operation, the median headway (50th percentile) did not move around much, but this is not the case with the streetcar periods. A reason for this is that with wider scheduled headways, it is more likely that within one hour the scheduled number of vehicles will be higher or lower by a more substantial amount than with the more frequent bus service. Conversely, with the shorter scheduled bus headways, it is much more likely that vehicles will run in pairs because it is much easier to catch up to the bus only a few minutes in front.
A long-standing problem on streetcar routes with larger and larger vehicles (PCC/CLRV, ALRV, Flexity) is that scheduled headways to provide comparable capacity widen, but the laissez-faire attitude to line management results in much worse swings in vehicle spacing. This is compounded by Service Standards that accept a wider range of headways for less frequent service. The issue of meaningful Standards is to be reviewed in coming months by the TTC, and this is an area where Standards should not be compromised just to preserve “good” performance stats for management.
As shown in many analyses published here, there is a general problem with headways becoming more erratic as vehicles move along the route. St. Clair is entirely on its own right-of-way, except for a short stretch at the western end. It also has a mid-point opportunity for headway regulation at St. Clair West Station. Data for departures from that point suggest that little or no headway management occurs there.
TTC Service Standards for terminal departures specify a range of 1 minute early to 5 minutes late, although recently the service metrics were change to eliminate early departures. In any event, a 5 minute window for being “on time” combined with a 6 minute scheduled service means that service can be badly bunched and still “on time” for reporting purposes.
Along the route, the Standards prescribe headway variations of ±50% so that for a 6 minute headway, an actual range of 3-to-9 minutes is permitted. For an 8 minute headway, the permitted range is 4-to-12 minutes. To compound credibility problems, this only has to be achieved on 60% of trips. [See TTC Service Standards at pp 15-16.]
Needless to say, when the TTC says that service meets their standards, the quality can vary quite widely from what riders might expect as “reliable” operation.
Following the “more” break, the first section looks at the evolution of headways along the route west from Yonge and east from Keele during various periods over the day. AM Peak values tend to be slightly more reliable, but even they worsen the further from the terminal one goes.
The second section presents the detailed headway data from September 2025 to show the actual scatter of headway values by day and week, and including weekend data.
There is some indication that the TTC has attempted better headway management on 512 St. Clair, but the results are uneven and there are clear signs of locations and time periods where service is not regulated at all. In turn, this shows what “normal” operations are like without active dispatching and spacing of cars along the route.
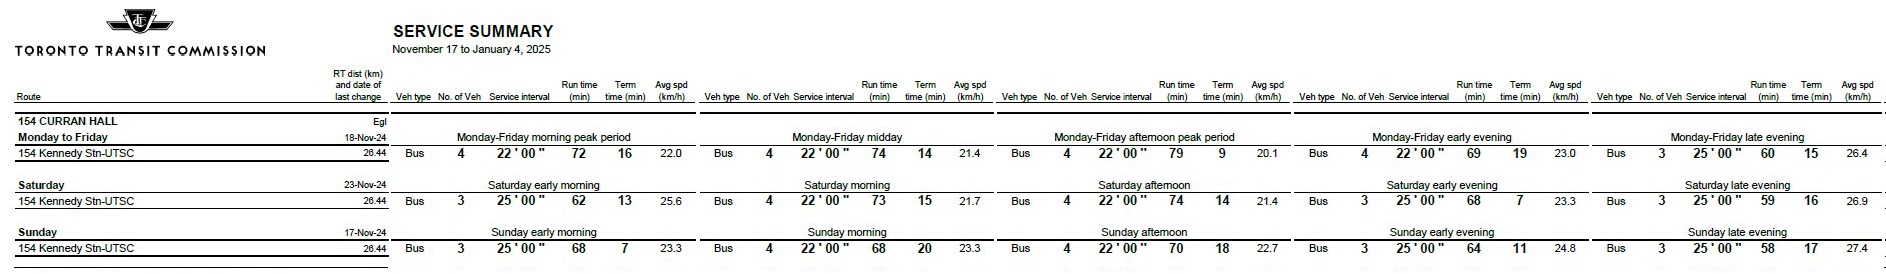
Route 154 Curran Hall was created in September 2024 in part by carving off the Orton Park branch of 54 Lawrence East. It operates from Kennedy Station to University of Toronto Scarborough Campus (UTSC) and uses the Midland/Kennedy red lanes between Eglinton and Lawrence. From there, the 154 runs east to Scarborough Golf Club Road and then dodges north to Ellesmere via Brimorton and Orton Park. The route continues east to Military Trail and then south into UTSC.
Service is not frequent with headways from 22-25 minutes. The schedule summary below is dated November 2024, but the headway pattern is the same as the original September 2024 version.
For services less frequent than every 10 minutes, TTC Service Standards dictate that buses should be no more than 1 minute early or 5 minutes late 60% of the time. This is a rather generous target, but as charts later in this article show, the 154 misses the maximum target by a very wide margin in many cases. However, that 60% is almost a “get out of jail free” card for service reporting and allows wider headways with no upper bound for 40% of the service.
A problem common to shorter routes with infrequent service is that headways can be quite erratic. This compounds the already wide gaps between buses with unpredictable arrivals. These arise from three sources:
Buses have adequate time for generous layovers at Kennedy Station, but do not leave reliably on time.
Later in the day, some buses run in pairs even on the very wide scheduled headway.
Occasionally, a bus will be missing, and there is no effort to dispatch the remaining vehicles on an even spacing leading to double headways of 45 minutes or more.
All of these point to an abdication of line management and a laissez-faire attitude to service quality.
There were no eAlerts issued for 154 Curran Hall during July and August and this suggests that nobody was “minding the store”.
In the detailed portion of this article, I will review headways at the terminals, travel times and the service operation on a few sample days. In future articles, I will turn to other short routes with similar problems.
A route like 154 Curran Hall might not seem important in the grand scheme of things by comparison with the Finch East or Dufferin corridors, but poor service is something riders can see. It is especially galling when a route is announced as “new and improved” but fails to deliver.
On September 18, 2025, Toronto & East York Community Council will consider a report recommending a revised proposal for speeding up bus service on Bathurst Street.
Back in July, the original proposal would have seen red transit-only curb lanes in both directions from just north of Bathurst Station to Eglinton Avenue. This proposal encountered substantial opposition, and the revised version is intended to improve transit and traffic operations when and where it is most needed in that segment of route 7 Bathurst Bus. There is no change proposed for the transit priority scheme for streetcars from Bathurst Station south to Lake Shore Boulevard.
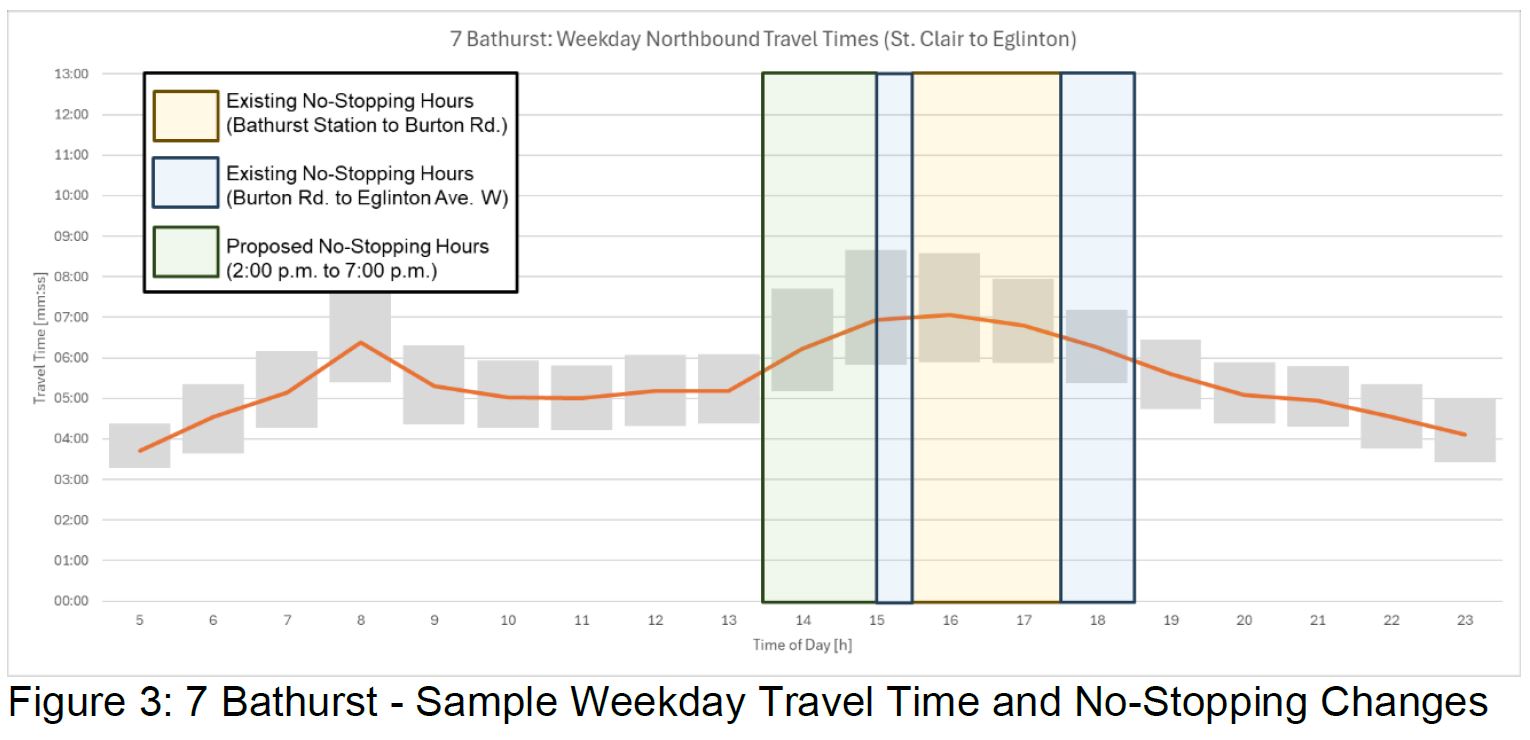
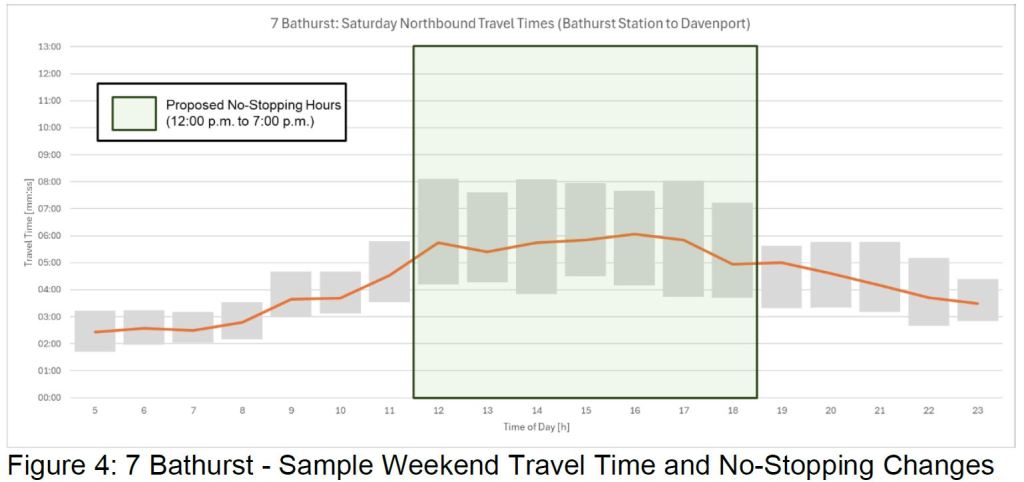
The primary time and location of congestion affecting the south end of 7 Bathurst is in the afternoon, Mondays through Saturdays. To address this, the following changes are proposed:
No stopping will be permitted on Bathurst Street northbound from the north exit of Bathurst Station to Eglinton Avenue from 2-7pm on weekdays, and 12-7pm on weekends.
North-to-west left turns at Bathurst & Davenport will be banned from 7am-7pm Monday to Saturday, except holidays.
South-to-east left turns at Bathurst & Dupont will be banned from 7am-7pm Monday to Saturday, except holidays.
The existing 7am-9am ban on north-to-west left turns at Bathurst & Dupont will be removed.
The chart below shows the weekday and weekend travel time profiles for Bathurst Street with the existing and planned hours of “no stopping” overlaid.
There are many diversions coming up in the Fall for streetcar routes. Information on these appears in various places on the TTC site, mainly but not exclusively under Service Advisories. As an aid to riders, this article consolidates the available information in one place.
Updated November 28, 2025
***** This article is only for archival purposes. It has been replaced by a new one picking up from mid-November 2025. *****
Major events pending and in progress include:
Construction on Queen between Davies (just east of the Don Bridge) and Broadview.
Reconstruction of the intersection of College and McCaul, and of overhead in the vicinity.
Reconstruction of track and overhead at and near Parliament and Carlton.
Other short term diversions will last only overnight or for a weekend.
Many of these are complicated by the ongoing Ontario Line work at Queen & Yonge forcing some diversions to be more complex than they might be otherwise.
This article will be updated when changes are announced.
November 21: The 501 diversion via Broadview, Dundas and Parliament around water main and track work west of Broadview will begin on November 22.
November 20: Equipment and material mobilization is underway on Queen west of Broadview.
November 17: The 506 diversion has been changed today to avoid the intersection of Church & Dundas where construction blocks the northeast corner. Maps have been added from the TTC’s site.
Effective November 16: The 503 Kingston Road bus will be cut back from Dufferin, and will now loop at York Street via Richmond and University.
November 15: Diversions announced for two projects on 506 Carlton at Parliament & Carlton, and on Gerrard east of Broadview.
November 9: King & Dufferin reopened for streetcar service. 503, 504, 508 will operate via their normal routes.
October 30: King & Dufferin reopens for general traffic and buses. Streetcars to return following track testing.
October 20: Water main reconstruction on Queen west of Broadview has been delayed until early November. 501 Queen streetcars will continue to operate on Queen Street until further notice.
October 13: 504 King is operating with streetcars today over its full route except for the King/Dufferin diversion.
October 9: Maps for 504 King and 506 Carlton diversions added.
October 8: Construction at Queen & Broadview will not start on October 12, and so some diversions will not be required immediately. Information for 501 Queen and 503 Kingston Road has been updated.
October 5: Nuit Blanch & Run For the Cure info moved to the archive section.
October 1: Diversions of 505/305 Dundas and 506/306 Carlton for Nuit Blance and for the Run For The Cure added for October 3/4/5.
September 23: The King/Dufferin start date has been changed to Sunday, September 28.
September 12: King/Dufferin start date pushed back to September 29 or later. The project will now extend to mid-November.
September 9: College/McCaul and Queen East details added.
August 26: King/Dufferin Project
The start date for this project has been changed to mid-September with the exact date to be confirmed. Although new schedules will be in place providing for diversions, service will continue to operate through on King Street until construction actually begins. This likely means that the project will extend further into October than the originally planned Thanksgiving weekend end date. The delay also means that the Tiff diversions will end before the King/Dufferin diversions begin.
Branch lettering for 504 King A/B corrected.
August 25: King/Dufferin Project
Information about Kingston Road night service added.
304 King and 329 Dufferin confirmed to be diverted on the same routes as the 504A and 29 daytime services.
Several routes in the TTC network are scheduled to operate partly or completely with 18m articulated buses in place of the standard 12m varieties seen on most of the system. A problem commonly found on some of these routes is that although the schedule assumes an 18m bus, what actually shows up is a 12m bus with less capacity.
On some routes, the proportion of shorter buses grows later in the day suggesting that for some reason the longer buses were replaced. The number of buses per hour is fairly consistent from day-to-day, and generally matches the scheduled level of service. This means that few extras (or “run as directed” buses) served these routes even though the capacity was reduced by substitution of smaller buses.
This post looks at how often this problem arises on several routes through the month of July 2025.
The TTC has announced its services for the CNE for 2025 to operate from Friday, August 15 to Monday, September 1.
CNE Express buses will operate non-stop between Bathurst Station and Exhibition Loop, and between Dufferin Station and Dufferin Loop.
Extra service will operate on the 29 Dufferin and 929 Dufferin Express bus routes, and on the 509 Harbourfront and 511 Bathurst streetcar routes.
Other routes will change to accommodate the CNE services and traffic conditions.
63 Ossington buses normally loop at King via Strachan, East Liberty, Liberty and Atlantic. This will change so that buses loop via Fraser, Liberty and Atlantic.
503 Kingston Road streetcars will be extended west from Dufferin to Sunnyside Loop between 2pm-1am weekdays and 9am-1am on weekends.
510 Spadina streetcars will terminate at Queens Quay Loop until 7:30pm daily, and will run to Union Station afterward.
The TTC is into the second round of its consultation for service changes and construction projects in 2026. There is a general page on the 2026 Network Plan and a Survey for feedback.
If you comment here, be sure to also complete the survey so that your feedback goes into the official record.
Updated August 14, 2025 at 1:20pm: This article was written based on information in the customer survey as it existed about 4:00 pm on August 13 when the link to it went live on the TTC site. This included a reference to a minimum 5 minute time saving for express buses which did not match the TTC’s own service standard. The survey now contains the correct information. Text in this article has been updated accordingly.
Updated August 22, 2025 at 2:40pm: The City of Toronto has confirmed that widening of the St. Clair underpass east of Keele Street will not be part of the Metrolinx/TTC project planned for 2026.
Public Pop-Ups
August 13: Pioneer Village Station near express route bus bays 7:30-9:30 a.m.
August 14: Kipling Station near express route bus bays 7:30-9:30 a.m.
August 18: Kennedy Station near express route bus bays (Platform A and B) 7:30-9:30 a.m.
August 19: Don Mills Station near express route bus bays 4-6 p.m.
August 20: Yonge and College 506 Carlton, Eastbound stop 4-6 p.m.
Note that almost all of these relate to the review of express bus services, and only one of the construction proposals (College/Carlton) is covered. More consultation in affected neighbourhoods is definitely required.