This route had small changes in transit priority in Fall 2025 with removal of parking on the south end of the route during selected periods, and removal of three stops both ways between St. Clair and Eglinton. Although TTC cites stop removal as a travel time saving, this depends on two factors: how often buses actually stop at them, and whether there is a traffic signal that can add to the delay of stopping and falling out of the general traffic flow. None of these stops had signals.
Meanwhile 7 Bathurst is also supposed to be part of the TTC’s pilot to reduce bunching and gapping. That project began in March 2025 on several routes, but was scaled back to peak periods in October.
The tracking data show little effect of the changes which were quite limited in scope. Headway reliability remains a major problem from both ends of the line, and even worse midway along the route. There is also a very large difference between off-peak and peak travel times affecting many parts of the route, not just the portion south of Eglinton.
Improvements are needed both to deal with peak period congestion delays, but also to improve the reliability of vehicle departures and spacing on an all-day basis. With the results to date, it is hard to believe that substantial new ridership will be attracted to the line especially with its chronic problem of irregular headways.
This is an update from previous articles about the 511 Bathurst Streetcar showing the effect of operational changes in recent months. These include:
A shift from 10-minute to 6-minute headways for daytime service effective mid-November 2025.
Implementation of red transit-only lanes on Bathurst south from Dundas in Fall 2025.
Increased headway supervision to reduce bunching and gaps.
These effects took place concurrently, and it is difficult to tease apart the individual effects especially as seen by riders. For example, bunching produces wide gaps in service, but these can be reduced both by better headway regulation and by more frequent scheduled service. Reserved lanes can reduce fluctuations in travel times leading to less irregularity in headways. Some of these effects were seen years ago with the implementation of the King Street transit corridor. This is not a transit epiphany, but rather a rediscovery of what is needed to ensure reliable service.
The first part of this article reviews travel times over various parts of the route from January 2024 to February 2026. Between November 2024 and June 2025, the south end of the streetcar route was diverted for construction. Data for this period is included in the charts only for locations north of King which had streetcar service through the entire 2+ year period.
The second part of the article reviews headways (the interval between cars) at key locations. There is a consistent degradation in headway reliability between the southern terminal at Exhibition and Richmond Street northbound, and this exists even after reserved lanes were in place over the entire distance.
The time saving of transit priority schemes can be undone by unevenly spaced service and the extra wait times this causes. Moreover, because a “gap car” typically has heavier than average loads, more riders experience waits and crowding than would be shown in average counts that the TTC typically publishes.
Another important point is that delays and irregularity are not just a peak period issues, but can affect service at midday and through the evening. (This can also affect weekends, but I have not included them here.) On 511 Bathurst, there is a quite striking “heartbeat” pattern with extended travel times almost always on Friday evenings on the south end of the route due to congestion in the Entertainment District. This substantially disappeared after the implementation of red lanes in the area.
Buckets of red paint alone will not solve reliability issues without a culture of regularly spaced service. Note that this is quite different from “on time performance” where staying “on time” can actually lead to erratic spacing when what is needed is headway regulation. Moreover, TTC standards allow some variation in departures giving a window up to five minutes late while still being “on time”. With cars scheduled every six minutes, bunched service does not ring any alarm bells.
This article is the first in the series of review of routes where transit priority measures have been implemented.
After the red lanes are extended north to Bloor Street, I will publish an update to this article.
Readers with long memories might recall the early days of plans for a new streetcar order including discussions about how large a vehicle should be purchased. A major concern at the time was the possibility that the TTC would change schedules and run less frequent service with the larger cars just as they had when the articulated version of the CLRV (the previous generation of cars) arrived in the late 1980s.
That concern was softened by a TTC claim that service would actually improve. Peak periods would see slightly less frequent service, but a net increase in capacity, while off-peak periods would see little change in frequency effectively doubling the capacity of service. At the time, crowding was a big issue and this persisted right up to the pandemic in 2020, by which time all of the old cars had been retired. The management proposal was approved in July 2013.
As the CLRV/ALRV fleet aged, there were problems with reliability of older cars and the need to operate buses on some lines thanks to a shortage of working vehicles. Some repairs were done at considerable cost, but these were more cosmetic than a true life extension.
Moving forward to 2026, there has been a lot of talk of restoring pre-pandemic service levels. TTC fudges the numbers on this in many cases citing vehicle hours operated, not actual service frequencies which have been degraded by longer travel times.
(For example, if a round trip, including terminal layovers, takes two hours or 120 minutes, then 20 cars will provide a 6-minute service. If the round trip gets longer but no cars are added, the service is less frequent, but the number of vehicle hours stays the same. From a rider’s point of view, service is worse, but from a budget outlook, there is no change. This is at the heart of the discrepancy between TTC service claims and rider experience.)
After years of changing service levels and demand, the TTC’s Five Year Plan foresees a return to six minute headways, at most, as a new standard for daytime service. This has been rolled out on some routes over the past year, but not all.
Already at 6 minutes or better: 504 King, 510 Spadina
Improved to 6 minutes: 512 St. Clair (Sept/25), 511 Bathurst (Nov/25), 505 Dundas (Nov/25)
Pending, but with no committed date: 501 Queen, 503 Kingston Road, 506 Carlton, 507 Long Branch.
The Five Year Plan (at p. 4) includes provision for extra spending in 2027 and 2028, but this is not tied to specific routes. There is nothing in the Plan for 2026.
A related issue is the size of the streetcar fleet. Leading up to 2020, the issue was how many cars were actually available, and some service cuts flowed directly from this. With the recent delivery of 60 additional cars, fleet availability should not be an issue although service can still be limited by a lack of operators. The TTC currently schedules 163 cars at peak out of a fleet of 264. If services now operating with buses due to construction were also using streetcars (503 Kingston Road and the Broadview branch of 504 King), the peak requirement would rise to 178. Allowing for maintenance spares this would drive the total requirement to 214 leaving 42 surplus for service improvements (allowing for 8 spares).
February 2026 Schedule PM Peak
Full Streetcar Service
Possible Service
Peak Requirement
163
178
220
Spares at 20%
33
36
44
Total Requirement
196
214
264
Fleet
264
264
264
Surplus
68
50
0
The problem, of course, is that the TTC barely has budget headroom to operate existing services let alone increases.
In theory, some of the surplus cars will eventually operate the Waterfront East LRT extension, but that service is at least 8 years away even assuming Toronto finds the money to build it. In any event this will not require anywhere near all of the current surplus fleet. Another issue is that the “streetcar network” has not operated with 100% streetcar service for a few decades thanks to various construction projects and vehicle shortages.
There are parallel issues with the bus network, but they are complicated by issues of vehicle reliability and the need for a spare pool to cover the unreliable LRT service primarily on Line 6 Finch West. I will turn to the bus fleet in a separate article.
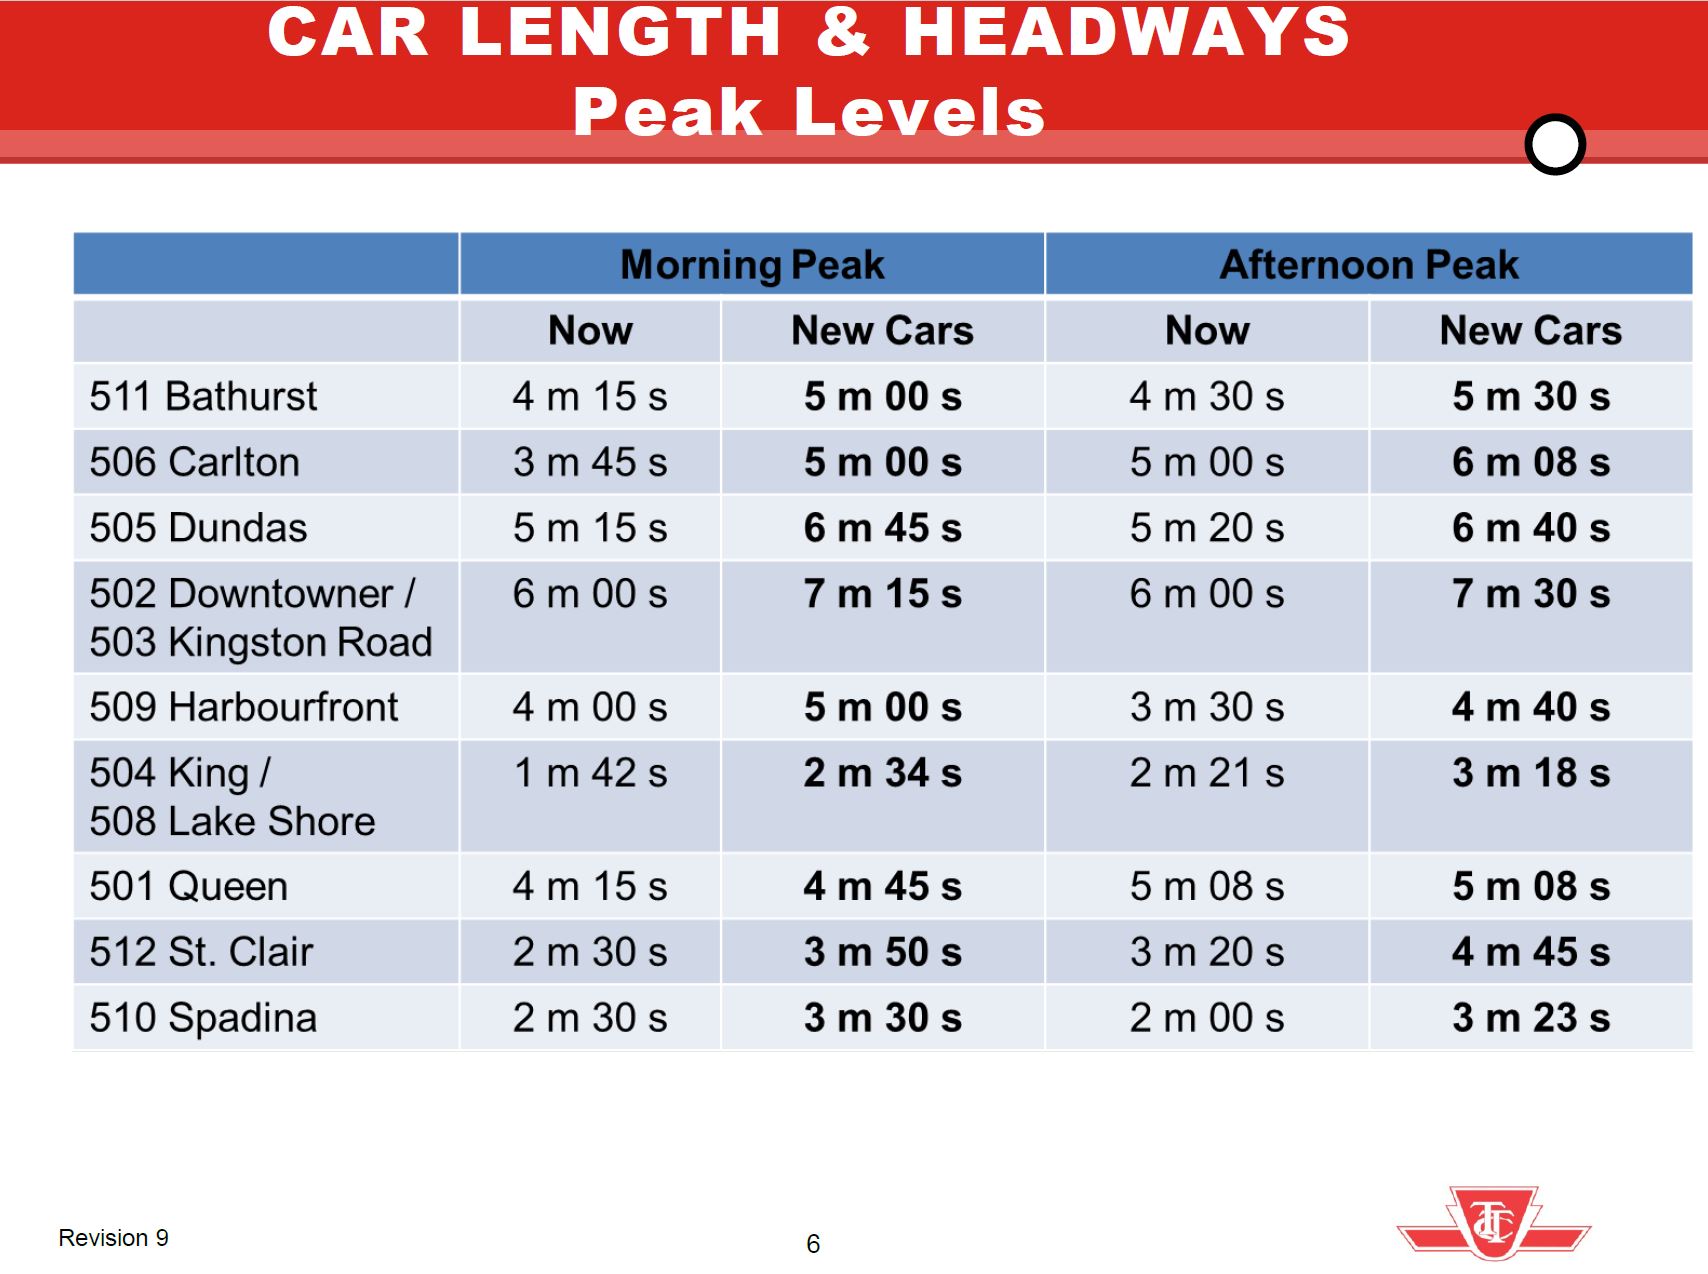
Back in 2013, the TTC proposed how it would operate with the new streetcar fleet. During peak periods, headways would widen particularly where existing service was very frequent. Notably on 501 Queen, there would only be a slight widening of the time between cars in the AM peak and no change in the PM peak. This reflected the fact that Queen was already running with the 75-foot long ALRVs and needed more capacity.
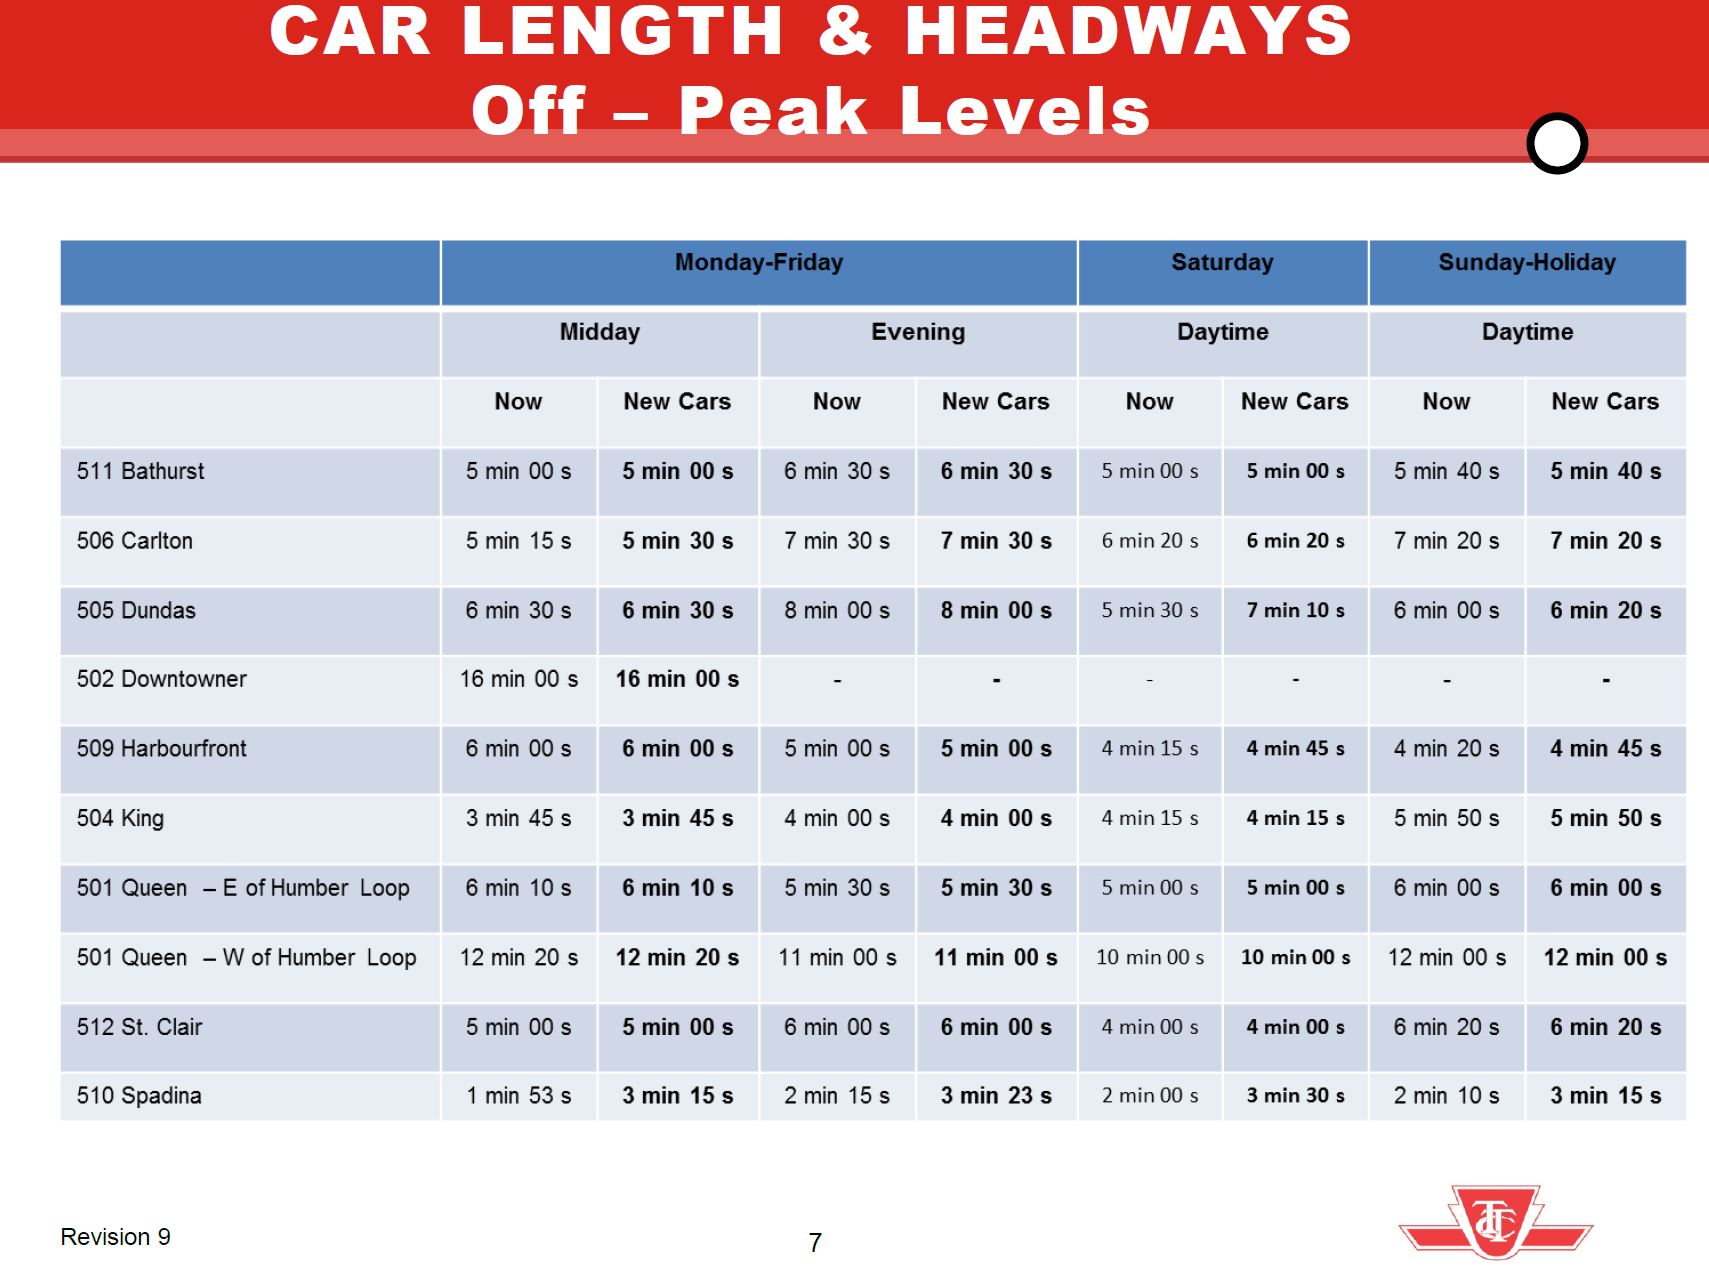
In the off peak, most routes would see no change in service level except for 510 Spadina due to its already frequent service of 50-foot CLRVs that could not be sustained at terminals with the larger new cars.
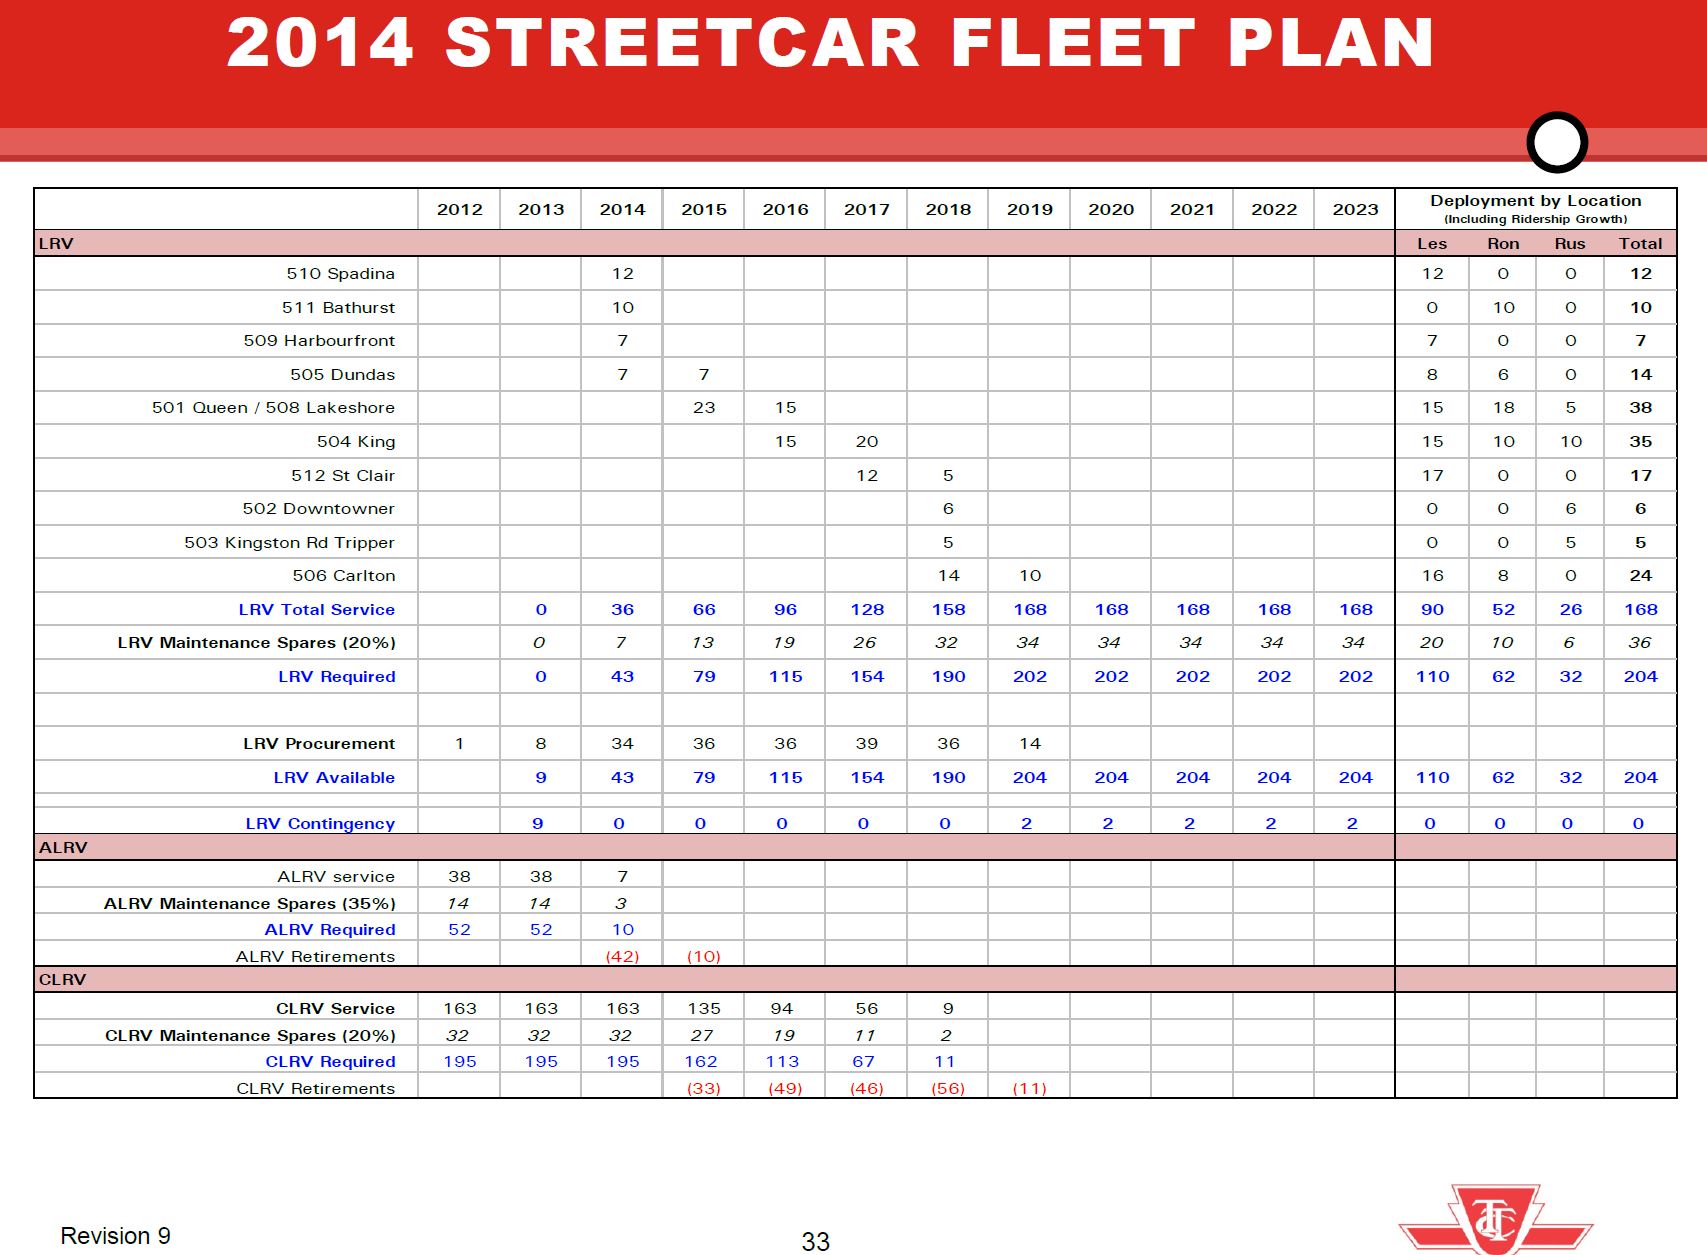
The overall fleet plan showed a buildup to a peak requirement of 168 cars plus 20% spares.
This plan gave a bright future for streetcar service and capacity growth, but things did not work out that way. Service today is generally lower than originally projected for the new fleet, and part of this reduction is due to slower operating speeds and greater provision for terminal recovery time even on routes with reserved lanes.
A related question is the effect that less frequent service has had on ridership. There is a post-pandemic slump on the streetcar system in part due to work-from-home for office jobs and remote learning for post-secondary students. However, even allowing for the pandemic era drop, the problem remains in attracting riders back to transit when streetcars are less frequent and slower, compounded by chronic problems with service reliability. Charts tracking streetcar ridership from 1976 to 2024, the last year published by TTC, are at the end of the article.
These routes are in the part of Toronto where transit riders should be easy to win, but a long decline in service frequency discourages those who have the option to use another mode including private autos, ride hailing or cycling. Service cuts during economic downturns do not magically get reversed as times improve, and ridership that might be wooed back to transit instead faces less reliable service and a political attitude that favours big spending on subway projects, not surface transit.
The remainder of this article looks at each route in detail to see how the actual service changed from the 2014 plan through the 2020s to today comparing:
The 2014 headways for AM Peak, Midday and PM Peak in the management proposal.
The proposed headways after routes converted to Flexity streetcars.
The actual scheduled service in January 2014, January 2020 (just before the pandemic) and February 2026. Driving times are shown separate from terminal recovery times to illustrate how each component has evolved.
Quite notable on many routes is the growth in both scheduled driving and terminal times. Although it is common in the mid-2020s to regard extended travel times and traffic delays as a recent, post-pandemic phenomenon, this pattern started earlier and is evident in 2014:2020 comparisons. Surplus time, it was argued, would prevent short turns, a claim that is demonstrably false as most riders know on a daily basis, but it slows service, wastes resources and forces wider headways.
This article includes reviews of the 29/929 Dufferin local and express services to the end of 2025. The major item of interest is the introduction of “red lanes” south of Bloor Street and their effect on the bus service. Detailed charts are included here for:
November and December travel times in both directions between King and Bloor.
January 2024 to December 2025 historical stats on travel times.
The segment between Lawrence and Wilson that does not have transit priority, but which has much more congestion than at the south end of the route thanks to Yorkdale Mall.
General observations:
The benefit of the red lanes is more pronounced for northbound than for southbound trips, and only at certain times of the day.
There is much more severe disruption of service northbound near Yorkdale Mall, but no transit priority measures are proposed there.
Headways on Dufferin remain widely scattered near terminals (northbound at King, southbound at Transit Road just outside of Wilson Station).
Even on Christmas Day when weather was relatively benign and travel times were lower than normal, headways were not reliable.
Part of the improvement in travel time in December 2025 could be due to seasonal effects. When the data are in for early 2026, we will see how long-lived the saving actually is. I will publish an update to this article in a few months when the pattern is clear.
There are a lot of charts in this article, and I have put them all after the “more” break. Those who are interested in the details can open the full article.
I will turn to a review of 511 Bathurst streetcar and 7 Bathurst bus which both saw recent changes in future articles.
Update: For clarity, the red lanes currently extend only as far north as Dundas. After work up to Bloor is completed in the Spring, I will publish an update showing the effect.
The TTC has issued a press release confirming the times for start of service on December 7:
Line 6 Finch West – Toronto’s newest transit line – will officially open to customers on Sun. Dec. 7. The first westbound train will depart from Norfinch Oakdale Station at 7:33 a.m., while the first eastbound train will leave Jane & Finch Station at 7:47 a.m.
For detailed first train times at each of the 18 new Line 6 stations, customers are encouraged to visit the official TTC schedules page: https://www.ttc.ca/routes-and-schedules.
Before regular service begins, two ceremonial trains will depart from Finch West Station.
Opening day is expected to be busy, and the TTC has organized special activities to mark the occasion. Customers will have the opportunity to collect exclusive Line 6 souvenirs, including special-edition ride guides, vehicle cutouts, and limited-edition commemorative coins and buttons.
[…]
Opening day schedule
On Sun., Dec. 7, the TTC will host a celebratory opening at Finch West Station. The planned opening day schedule is below:
• 7:00 a.m. – Brief remarks from dignitaries. • 7:20 a.m. — A ceremonial first train will depart Finch West Station. This trip will be reserved for media and invited guests. • 7:27 a.m. — A second train will depart Finch West Station. Members of the public are welcome to board and join the celebration. This train will be travelling to Driftwood Station and returning to Finch West Station. It will not be picking up customers at other stops. • 7:33 a.m. — The first in-service train will depart Norfinch Oakdale Station, heading west.
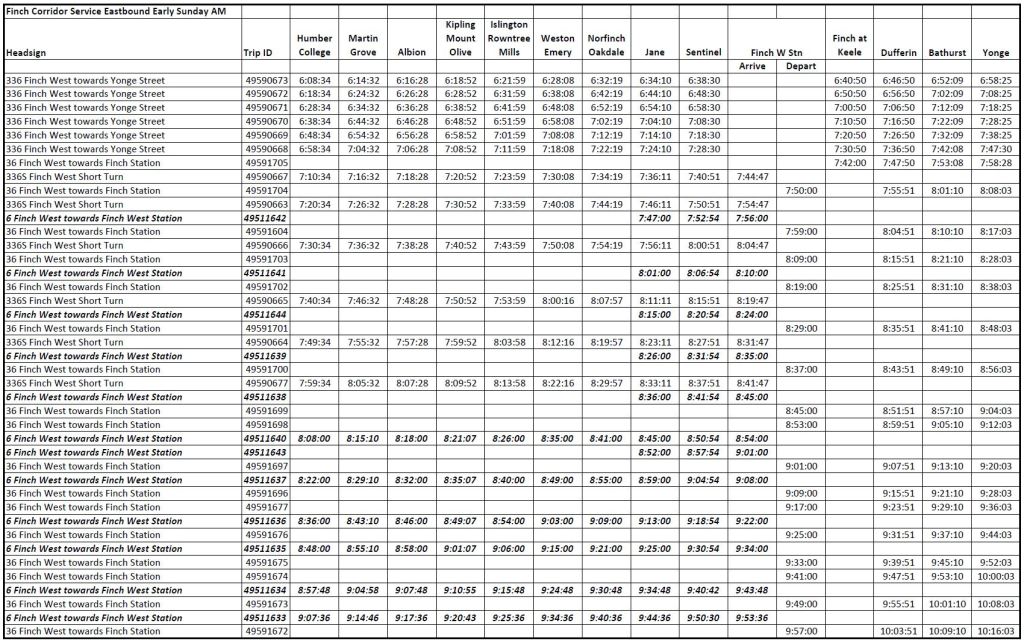
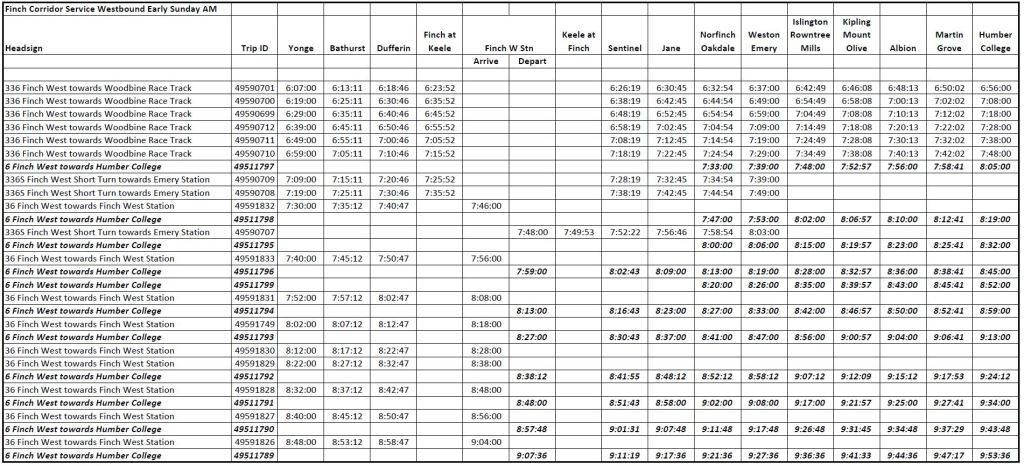
Note that the schedule pages for Line 6 have not been loaded yet, but you can see the early Sunday morning service on the Finch Corridor below, and the full schedule for 6 Finch West in this pdf. The schedules should go live on the TTC’s site when they flip over to the December 7 versions on the weekend.
Original article:
This post contains a consolidated view of schedules for:
6 Finch West LRT
36 Finch West Bus
336 Finch West Night Bus
The period covered is 6 to 9am on Sundays, and these timetables show the transition from the night bus covering the entire route to the split bus/LRT operation east and west of Finch West Station during the daytime.
The information is taken from the GTFS version of the schedules for these routes published on the City’s Open Data site recently. My intent in producing this is that the new schedules will not go live on the TTC site until December 7, and many eager transit aficionados will want to know the times of service at various locations on the route in time to plan to ride early trips.
The TTC’s web page about Line 6 gives a generic start time of 7:30am for the route on Sundays, but actual times vary along the route.
In the timetables below, the LRT trips are in bold italics. Only major stops are shown to save space.
For those unfamiliar with the new line, the carhouse is located between Jane and Norfinch stations, and some trips originate there during the build-up of service.
With the constant changes in route diversions for various construction projects, water and sewer repairs and overhead reconstruction, the previous Fall 2025 edition was getting cluttered and unwieldy. This version consolidates the current and planned work for late fall and early winter 2025-26.
Updated March 30 at 9:30am
Current and pending diversions:
Ongoing:
501 Queen cars divert both ways via Church, Richmond/Adelaide and York.
Water main and track work on Queen from Broadview to Davies require diversion of 501 Queen, and bus replacement of 503 Kingston Road and the east end of 504 King.
Effective March 28:
Effective March 28, Queen Street reopens to traffic. Westbound 50D and 503 buses will now operate west on Queen rather than diverting via Dundas and Eastern respectively. 501 streetcars continue to operate via Dundas during commissioning of new track on Queen.
Effective March 28:
After track replacement at Bay & College, the intersection re-opened on March 28. The 19 Bay bus returned to its normal route, and 506 Carlton buses now operate via College and Carlton rather than diverting around the work area. 506 Carlton cars will continue to divert via Dundas as testing and commissioning of new track and overhead remains to be done.
March 26 to April 9:
509 Harbourfront streetcars replaced by buses between Queens Quay and Exhibition Loops.
510 Spadina streetcars continue to provide service on Queens Quay to Union Station.
511 Bathurst streetcars operate between Bathurst Station and Fleet Loop.
Beginning June:
Long Branch Loop will be rebuilt. Streetcar service will be partly or completely replaced by buses from June 7 to October 31. Dates are tentative.
This article reviews the change in travel times and speed profiles on 510 Spadina, 511 Bathurst and 512 St. Clair between October 2019 and October 2025 (pre- and post-pandemic). In almost every case, streetcars are slower today than they were six years ago even though two of the three routes have reserved lanes.
511 Bathurst will soon have red lanes from Fleet to Bloor (except for a section north of Dundas), and I will publish updated charts for that route when the lane changes are in place.
By October 2019, streetcar service was almost completely operated with the new Flexity cars, and so the change over time is not explained with a comparison between the sprightlier CLRVs and the newer cars. (For 512 St. Clair, I have also included a comparison with the CLRV era to show the effect of the vehicle change separate from the pre/post pandemic change in traffic conditions.)
TTC is overly fond of laying blame for transit vehicle speeds on “traffic congestion”, but that is too simplistic an analysis especially for routes with reserved lanes. They also have a bad habit of presenting data without the granularity needed to identify patterns and problems by time of day and location. There are many charts in the main part of this article, but they are intended to show each route in detail.
One important point is that it is impossible to know how much change in speed comes from a more cautious operating philosophy as opposed to traffic conditions. There is, of course, the slow operation through junctions, but that does not explain slower travel on straight track with no special work. Traffic signal effects also show up, particularly in time spent holding nearside at intersections and then again at farside stops. Some areas are inherently slower than others such as Spadina from Queen south with many close-spaced intersections and signals that generally favour east-west traffic. The situation is particularly bad between Front and Queens Quay where the primary job of signals is to handle traffic to/from the Gardiner Expressway.
Any move to speed up operations on streetcar routes requires more than quick fixes like stop eliminations, and detailed block-by-block reviews are needed. In some cases there will be trade-offs between transit and other road users. Arguments for better priority will fare better if and when the TTC improves service so that there are actually transit vehicles to prioritize.
In a previous article, I examined the report on the Bunching & Gapping pilot now in progress at the TTC.
At the November 3 Board meeting, there was almost no discussion of that report, but in its place management provided a short presentation. Unfortunately, this portion of the meeting was not uploaded to YouTube, and so readers will not be able to view it for greater detail.
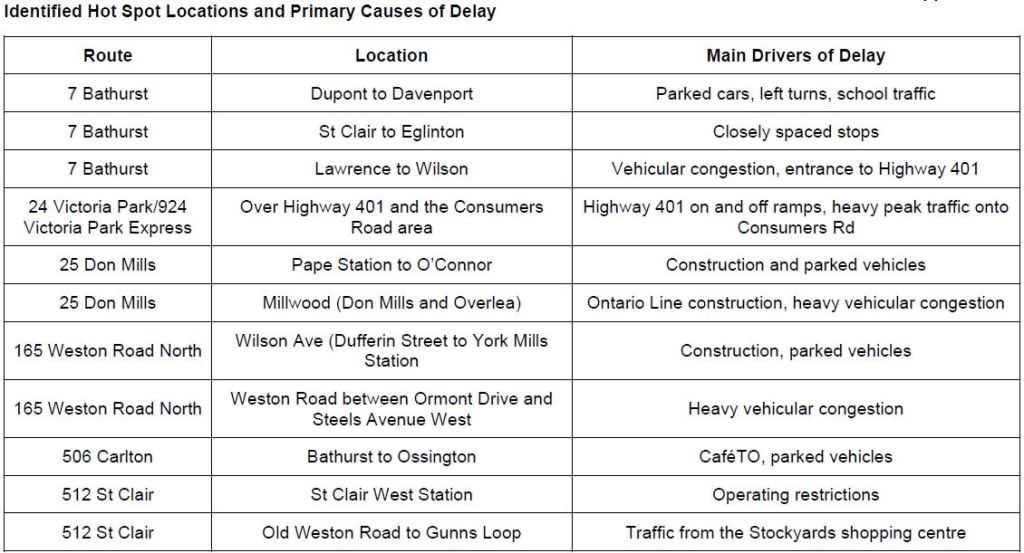
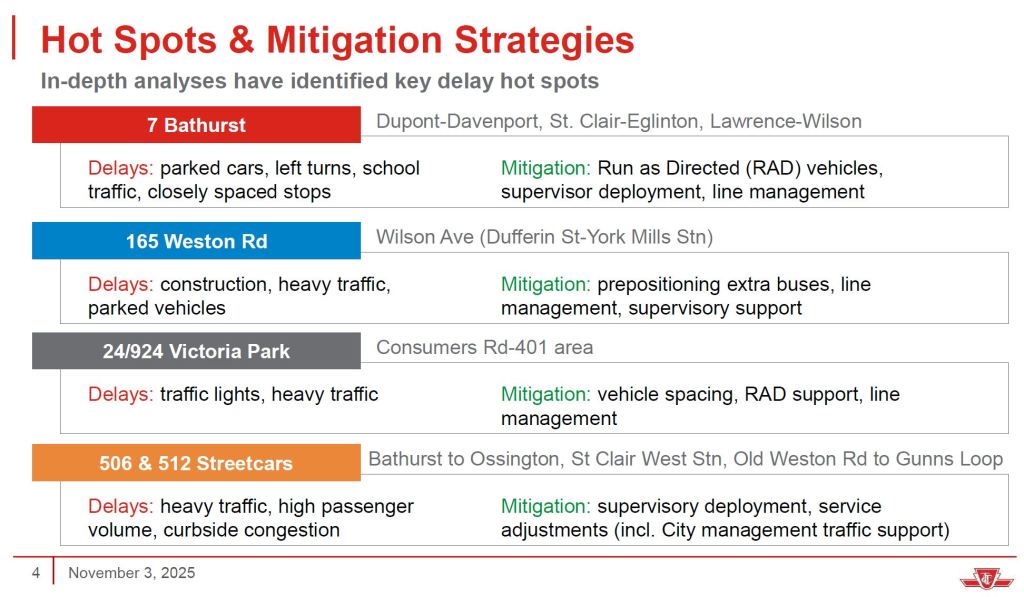
Information about hot spots on routes was presented in a different way from the original report. Both versions are shown below.
Original VersionPresentation Version
The original version has more granularity showing the issues specific to each route segment.
The presentation shown at the meeting included a hot spots map across the whole system, but this is not included in the published deck. I will ask TTC for a copy and add it here when available.
The important point about that map is that the hot spots are all over the city, while conventional wisdom presents this more as a downtown, streetcar-centric problem.
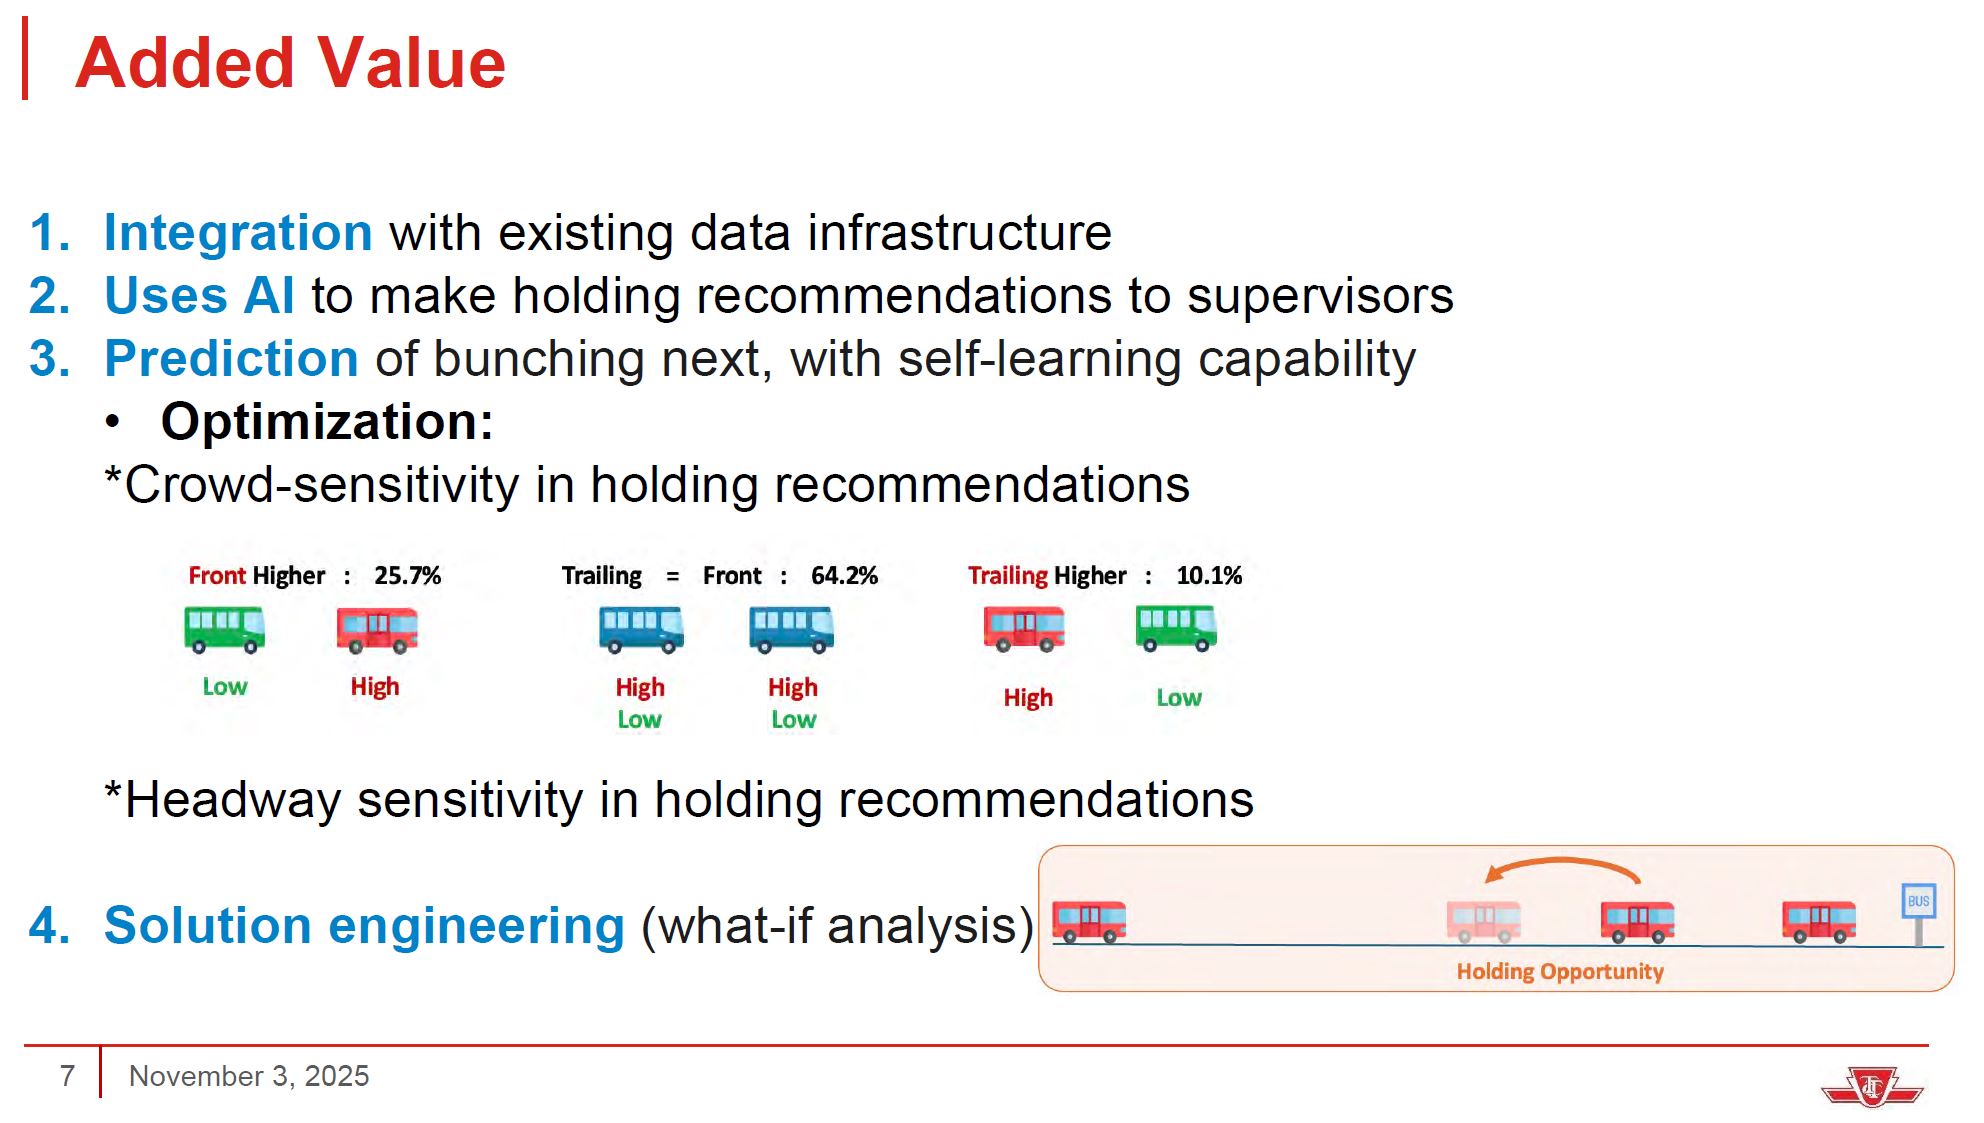
Results on the pilot routes have been mixed, and even this has required a high level of supervision that likely would not scale to the entire system and most hours of service. As an alternative, the TTC is considering an AI (Artificial Intelligence) tool developed at York University. Initially this would be used in an advisory manner to route supervisors who would decide whether its recommendations were valid. Later, it would directly instruct operators to hold enroute to even out headways.
A decision to hold a vehicle would take into account the relative loads of the leading (gap) bus and the trailing (bunched) one. Ideally, a bunched bus will have the lighter load and holding it to space service will affect fewer riders. This is not always the case if pairs of buses leap-frog to share the work along a route, and the “trailing” bus might have the heavier load at some points.
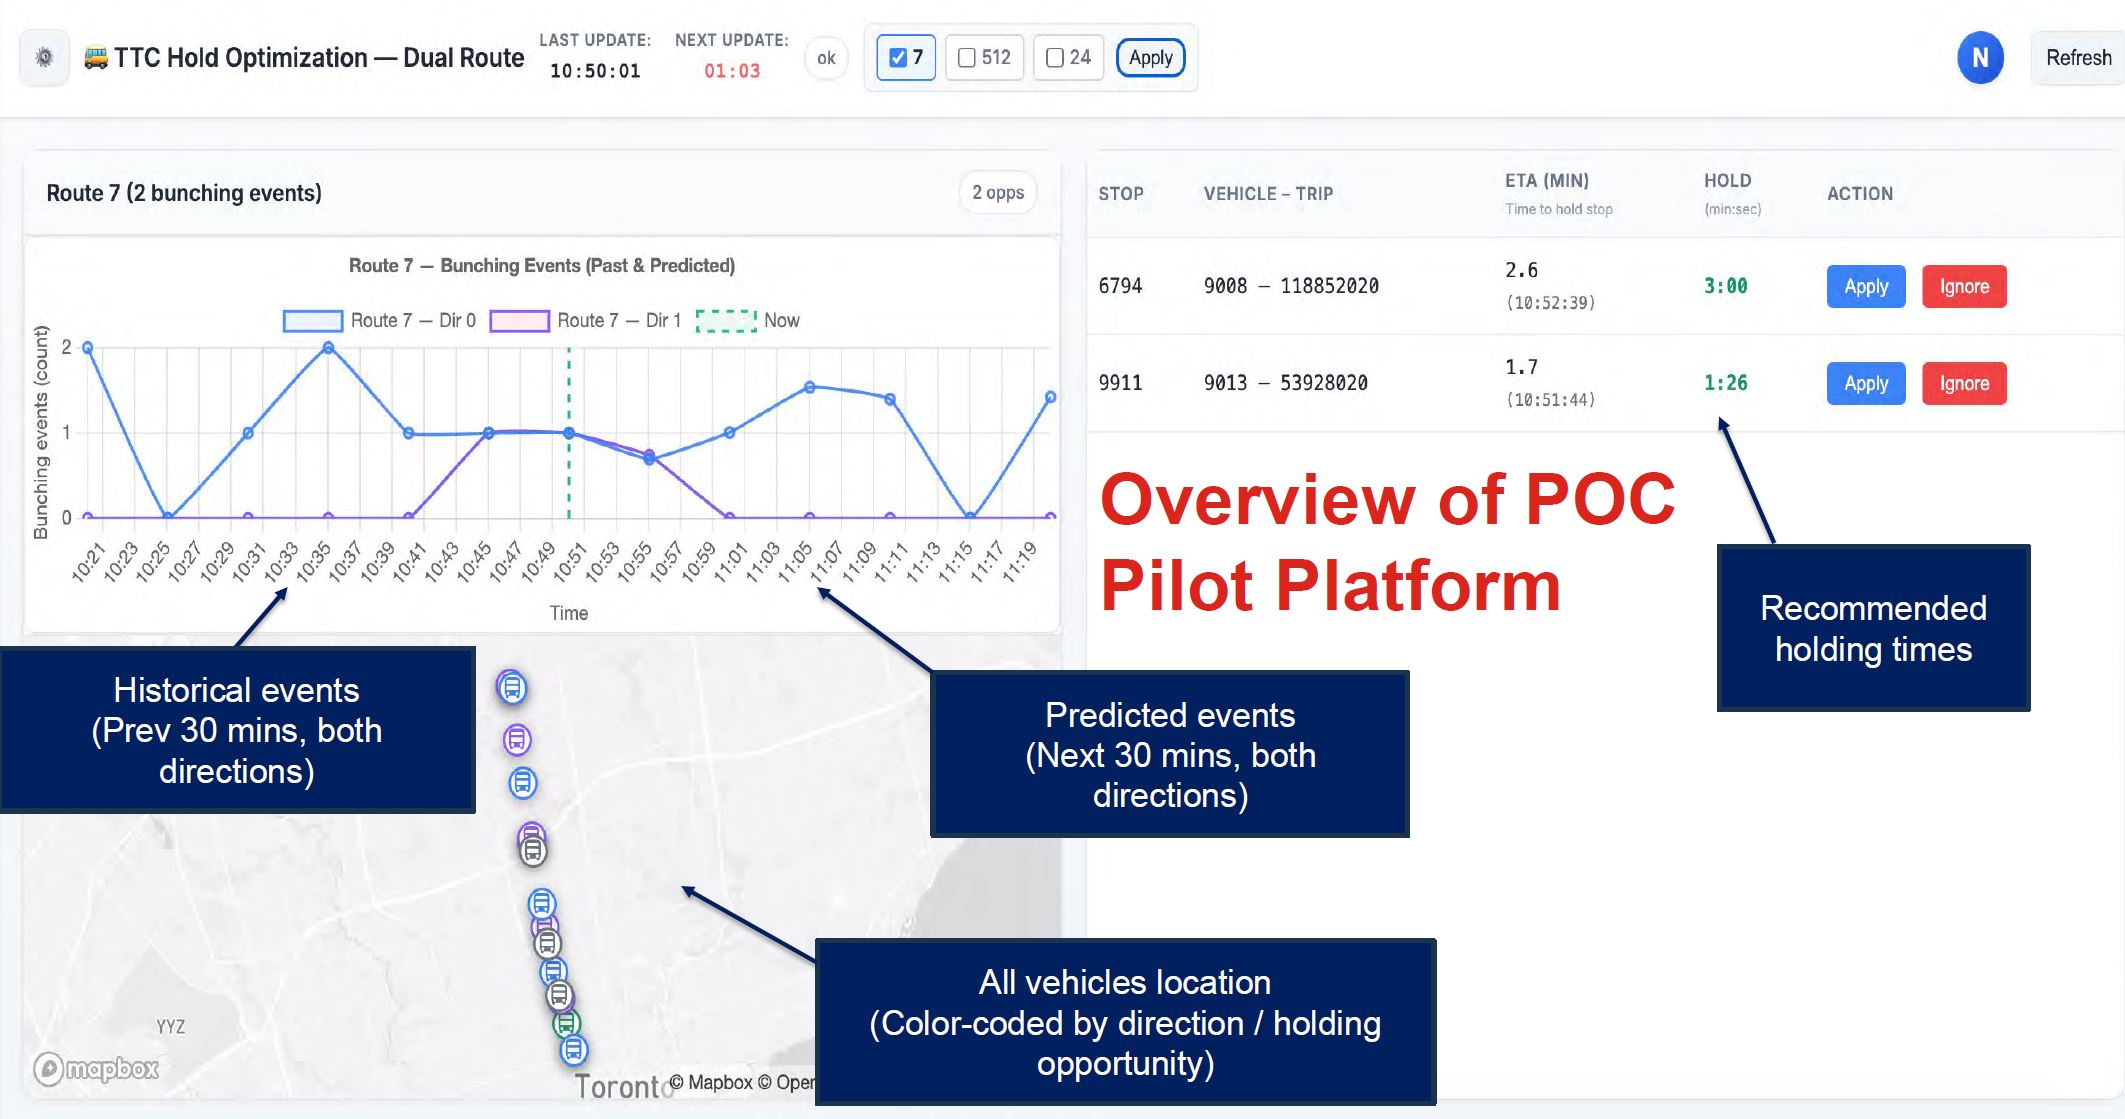
A proof of concept dashboard gives an idea of what might be presented to a route supervisor. This shows recommended holds, as well as the distribution of historical and predicted bunching. Note that the scale on the chart is the number of bunched buses, not the gap size to be corrected.
The challenge here will be for the AI model to predict future behaviour. Many things affect bus spacing, and some of them are not predictable. For example, irregular terminal departures can begin a process where a small gap gradually widens. That effect can be predicted and service adjusted, but the actual late or early departure is only known when it happens. Developing gaps are easy to spot along a route because the future service at a location can be predicted by what is in the few kilometres approaching it.
Congestion caused by accidents cannot be predicted, but the act of smoothing out service can deal with its results at least in part based on past experience with similar events. There is no mention of short turns or tracking of issues with buses running late due to insufficient schedule time, or the timidity of a junior operator.
Notable in the presentation is the implication of headway management, not on-time performance. The TTC needs to decide which of these it will adopt and incorporate that into terminal dispatching.
There is also the question of whether the Service Standards are too generous in defining the allowable variation in “on-time” and “headway” values. Departures are supposed to be no more than 5 minutes late, and never early. Headways on a 10-minute service like 7 Bathurst can vary from 5 to 15 minutes. If the AI tool uses these as its goal, it will perpetuate the uneven service allowed by the standards, particularly in headway management. There is also a danger that route speed will be determined by spacing service to accommodate the slowest drivers.
No computer system inherently “knows” what it is supposed to achieve, and depends on the parameters set down by its developers. If the TTC does not fully understand what “good service” should look like, an AI tool will only work toward expectations built into its design. An important component should be the ability to tighten or relax the targets for “good” service management.
TTC plans to shift the focus of its more intense supervision from the 7 Bathurst and 24/924 Victoria Park routes to 29/929 Dufferin and 25/925 Don Mills. I have collected tracking data on these routes for some time, and will publish analyses of changes in route behaviour after a few months have accumulated.
The Board approved the following motion:
Request TTC staff report back to the TTC’s Strategic Planning Committee as a part of consideration for 2026 budget priorities on the resource requirements, staffing, and operational needs to sustain a full-year Bunching and Gapping Pilot in 2026 as well as the feasibility of expanding the pilot to additional key routes across the City to improve service and reliability.
The next meeting of the Strategic Planning Committee is on November 25, 2025.
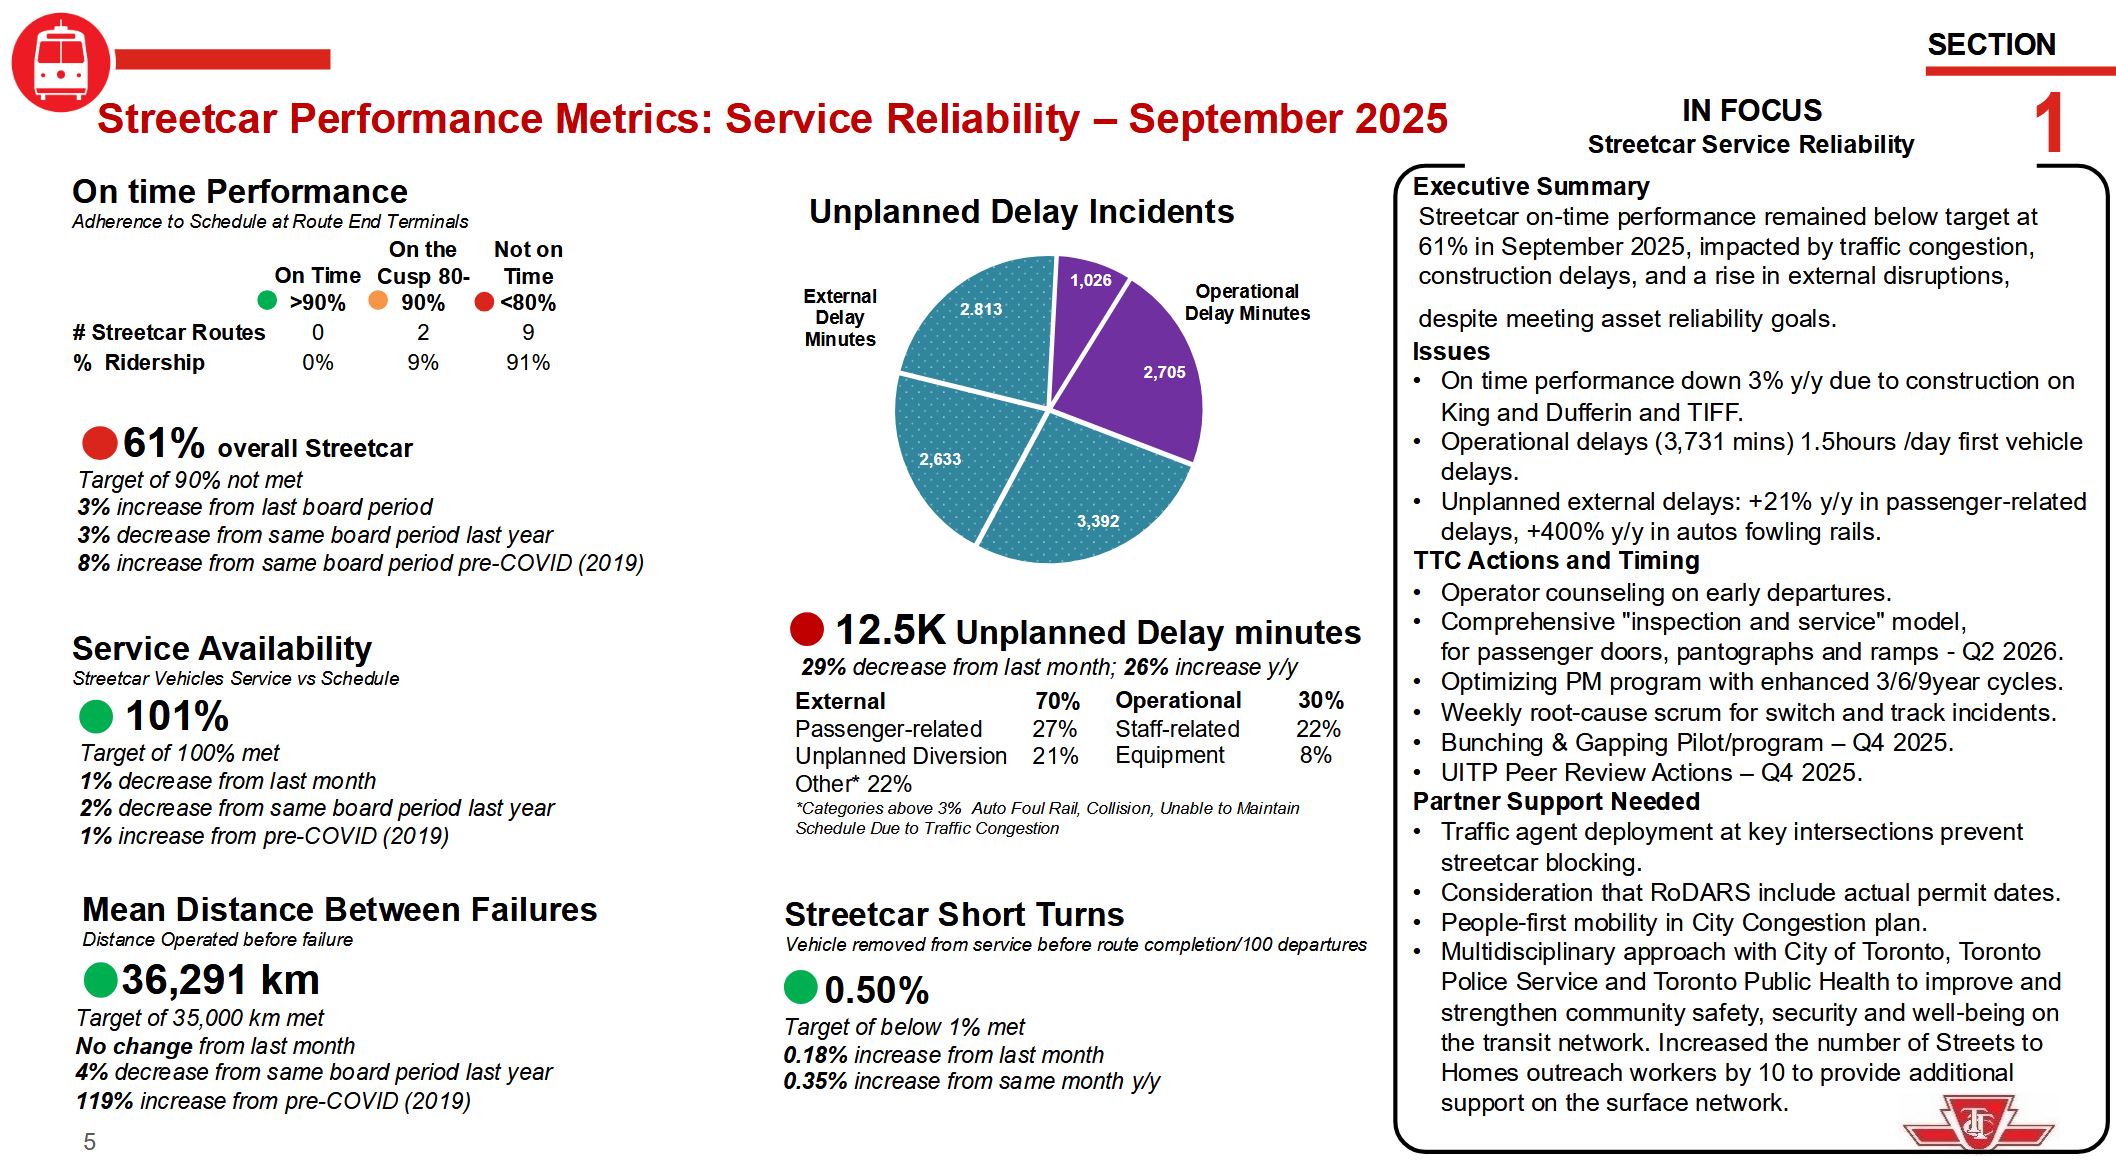
At the TTC Board meeting on November 3, management presented statistics on streetcar delays broken down by type of incident. TTC is quite fond of portraying external incidents, especially those related to congestion, as the root of (almost) all evil. The following page is from the CEO’s Report.
Note that external delays (turquoise) occupy the majority of the chart. During discussion of the problem of autos fouling rails, a passing remark by the Interim Chief Operating Officer piqued my curiosity when he said that there were many delays due to the winter storm.
This sent me to the TTC’s delay statistics which are available on the City’s Open Data site. There are codes for many types of delay including “MTAFR”, short for “Auto Fouling Rails”.
According to the “In Focus” box above there has been a 400% year-over-year increase in these delays, although they are styled as “fowling” implying a flock of chickens might be responsible for service issues.
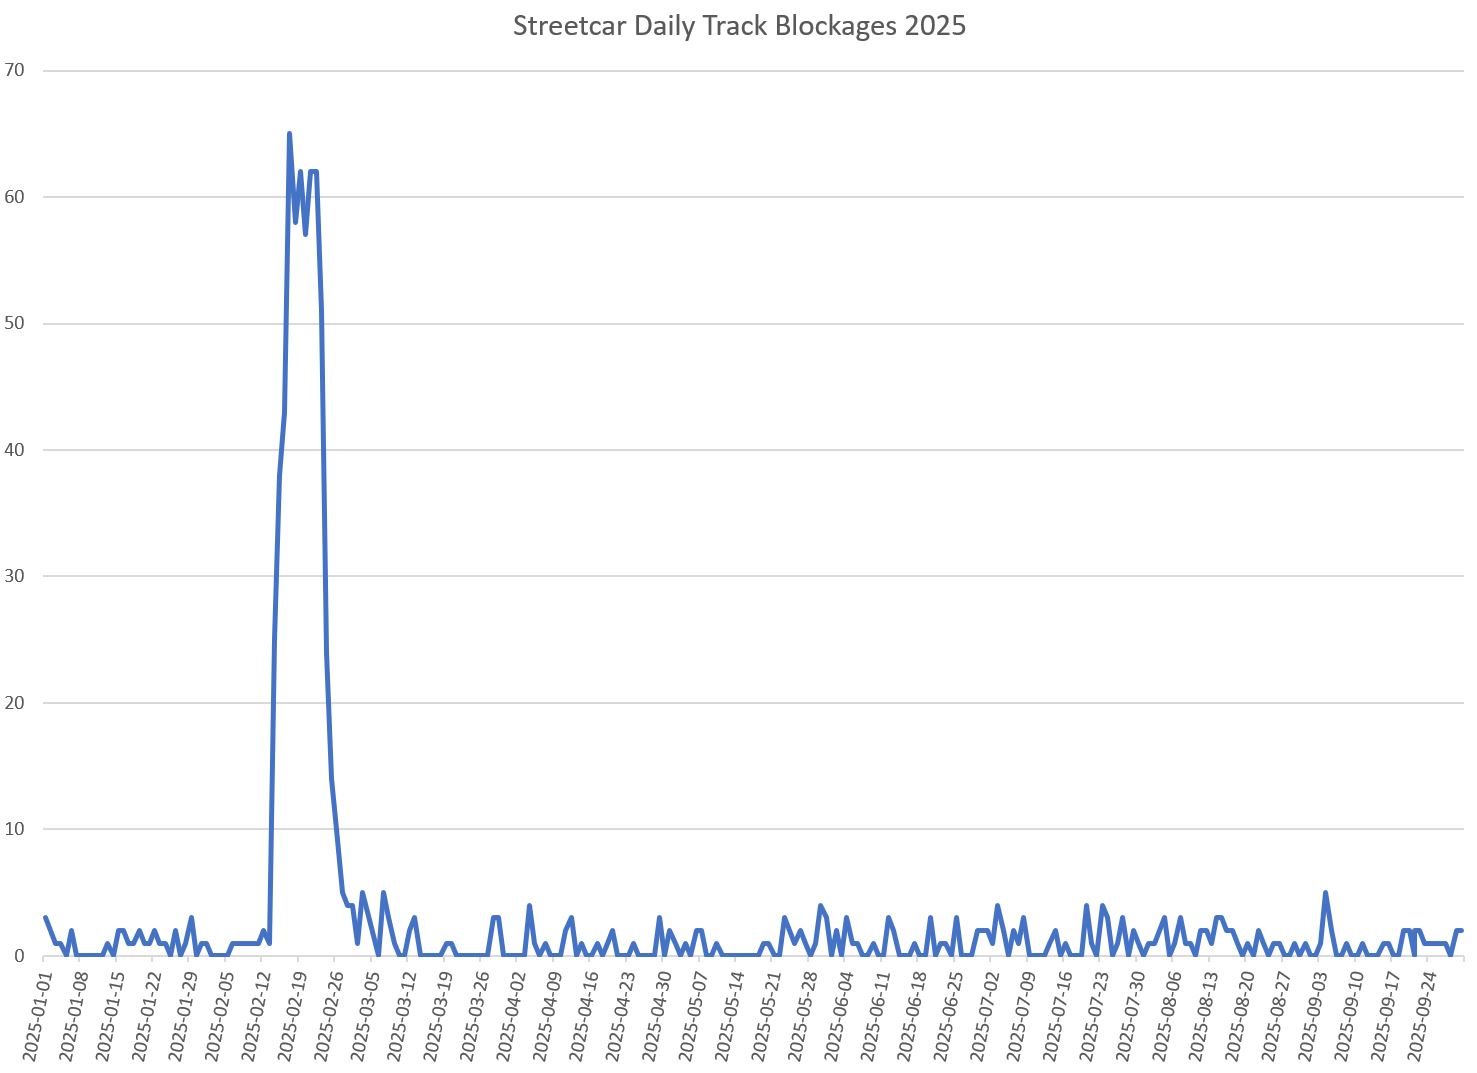
Sorting the data by code and summarizing by date produces interesting results.
Between January 1 and September 30, 2025, there were 843 MTAFR events logged.
Of these, 586 fall between February 14 and 26 hitting a daily high of 65 on February 17.
These blockages were not caused by the typical traffic congestion, but by the City’s utter failure to clear snow on key streets.
105 were on 501 Queen
42 were on 503 Kingston Rd.
84 were on 504 King
93 were on 505 Dundas
186 were on 506 Carlton
3 were on 507 Long Branch
1 was on 508 Lake Shore
2 were on 509 Harbourfront
None were on 510 Spadina or 511 Bathurst
6 were on 512 St. Clair
A few dozen were on various night cars
The pattern here is quite clear: routes on wide roads or rights-of-way were not seriously affected, but routes on regular 4-lane streets were hammered. (How 511 Bathurst was spared is a mystery. At the time it was running with streetcars from Bathurst Station to King & Spadina, and with buses on the south end of the route.)
To claim that the 400% increase from 2024 is some indication of worsening traffic problems is gross misrepresentation of what actually happened. Although this is the CEO’s report and he almost certainly did not assemble the information himself, he wears this issue for having reported misleading data to the Board and public.
Direct comparison with published 2024 data is difficult because until 2025 the TTC used a much coarser set of delay codes that lumped many types of events under generic headings. There was a category “Held by” in which there were 625 incidents from January to September in 2024. The 843 MTAFR codes in 2025 are quite clearly not a 400% increase over 2024.
Whenever there is a discussion of unreliable service, we hear endlessly about traffic congestion. This definitely is a problem, but not the only one, and certainly not in the way presented by the CEO.
A question arose during the debate about the problem that performance stats are consolidated across all routes. Route-by-route service quality is presented in detail in the second part of this article for all streetcar routes. This shows that problems are widespread in the system, even on routes with reserved lanes.
As for the delay stats cited by the CEO, it is clear that we are not comparing September 2025 to one year earlier as the text implies, but using events from the entire year to date including a major snowstorm that had no equivalent a year earlier. The so-called 400% jump in delays from blocked tracks is due to snow and poor road clearance by the City.
TTC management owes the Board and the public an apology for blatant misrepresentation of the delay statistics.
The TTC has a pilot program underway on several routes with increased supervision in an attempt to improve service quality by addressing service gaps and bunching. These are complementary effects in that a gap is often followed by a bunch, although gaps can also occur due to missing vehicles and short turns. See:
The pilot evolved over the year as some of the challenges and resource needs to manage service became apparent.
March 2025
Pilot launched on 7 Bathurst, 24 Victoria Park, 924 Victoria Park Express, 25 Don Mills, 925 Don Mills Express, 29 Dufferin, 929 Dufferin Express, 100 Flemington Park, 165 Weston Road North, 506 Carlton, 512 St Clair. Dedicated staff to manage each route were not used initially and results were poor.
June 2025
The pilot was scaled back to 7 Bathurst, 24 Victoria Park, 924 Victoria Park Express, 506 Carlton, and 512 St Clair. One route supervisor was assigned to each route.
September 2025
100 Flemingdon Park and 165 Weston Road North were added.
October 2025
Pilot “refined” to focus on the weekday peak periods.
The TTC recognizes that delays leading to gaps can be caused by several effects: “including including Operator behaviour, customer incidents, traffic congestion, city events, construction, and operational factors, such as door/ramp operations.” [p. 2]
Later in the report, there is mention of the effect of passenger loads and long traffic signal wait times.
If vehicles are crowded either because service is inadequate for demand, or because a gap creates an extra load, they will take longer at stops. Filling vehicles to the brim can be counter-productive and inefficient. Space limitations onboard can delay passenger movement especially for those with large objects (e.g. strollers, luggage) and mobility devices. Although ramp operations are mentioned, there are many other types of passengers with extra space and boarding time needs.
Transit signal priority is also mentioned, but there is no indication of where or what priority measures were added on the pilot routes.
The remainder of this article reviews the metrics used by the TTC to track the success of the pilot project, as well as problems and actions that might be taken to resolve them.