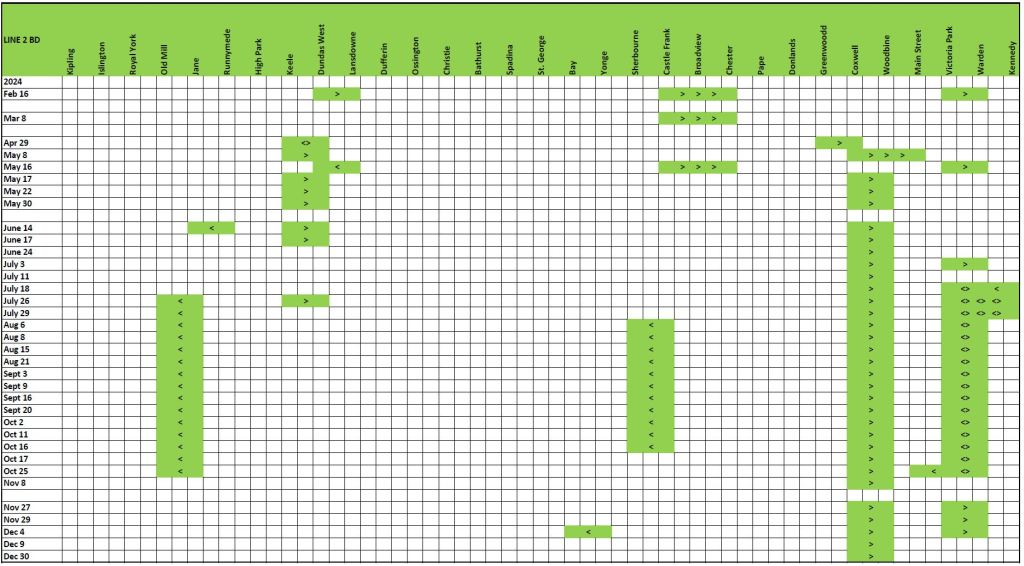
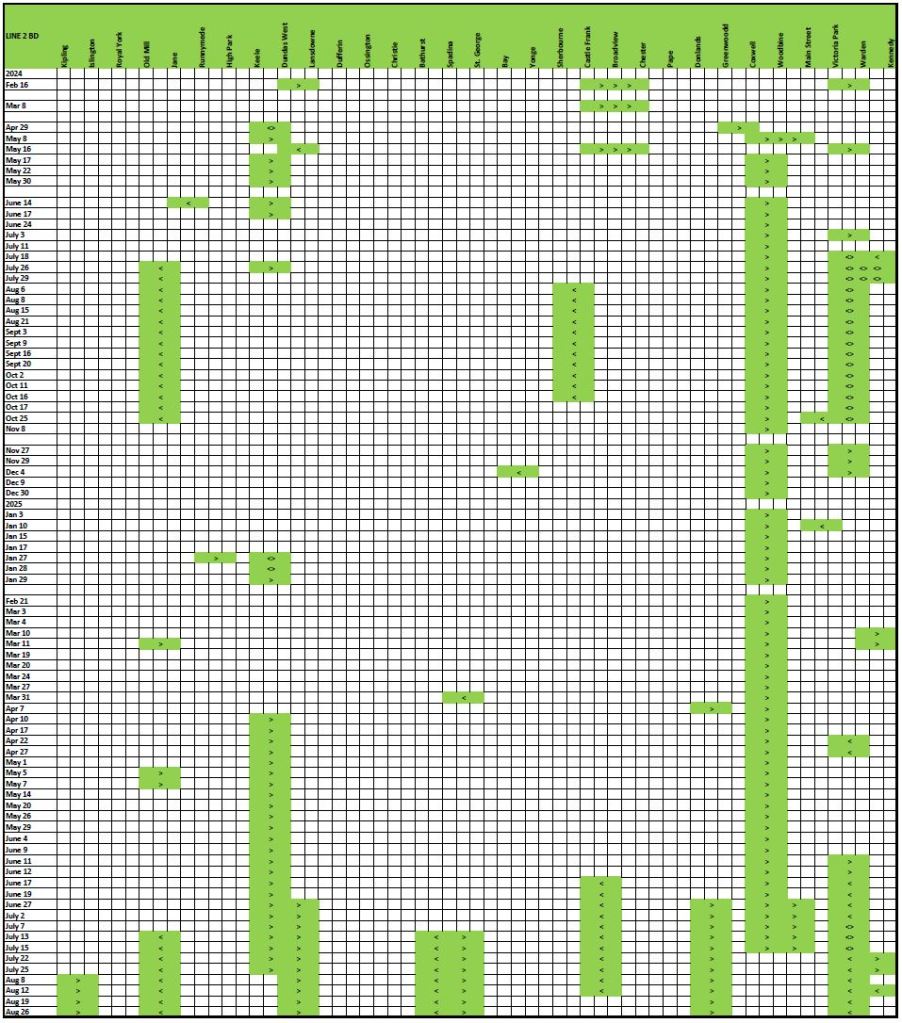
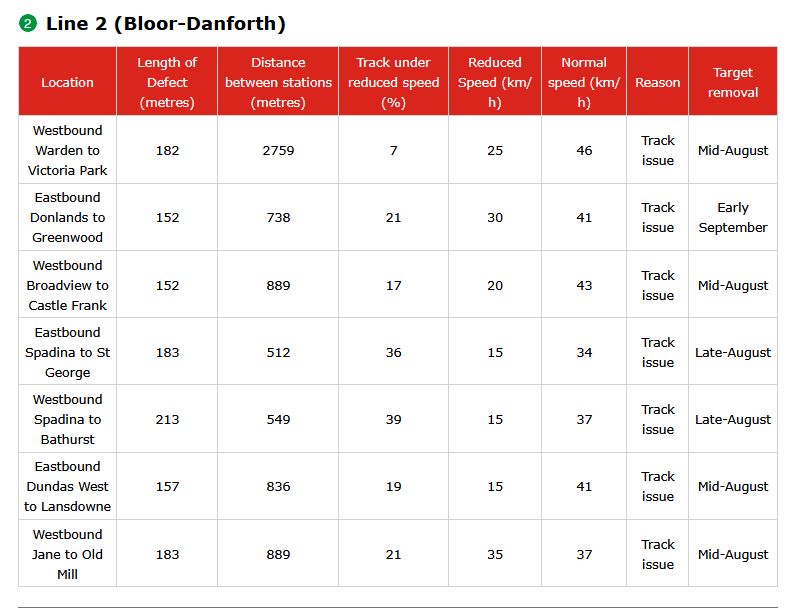
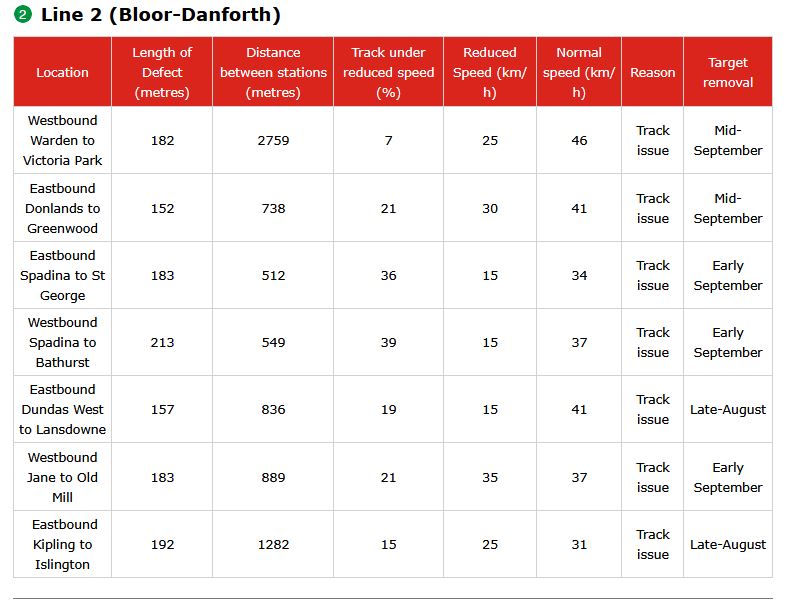
On September 4, 2025, the TTC’s Strategic Planning Committee met to debate several reports. I will deal with them in a separate article, but one thread in the meeting deserves comment on its own.
The order of the agenda was changed to put an item updating the budget situation first up for debate. On a preliminary basis, the TTC faces a shortfall of $232.3-million, but the City’s budget target allows only an increase of $91-million with a parallel target of $17-million in “efficiencies”.
These amounts do not make any provision for new and enhanced services beyond plans already in the works and “investments that are demonstrating results”.
There is no mention of the fiscal sleight-of-hand that happens every year with various reserve funds where the TTC typically budgets to take money out at the start of the year, and puts money back at the end. The City often contributes to these reserves with left overs discovered in the year-end reconciliation of actual versus budgeted spending.
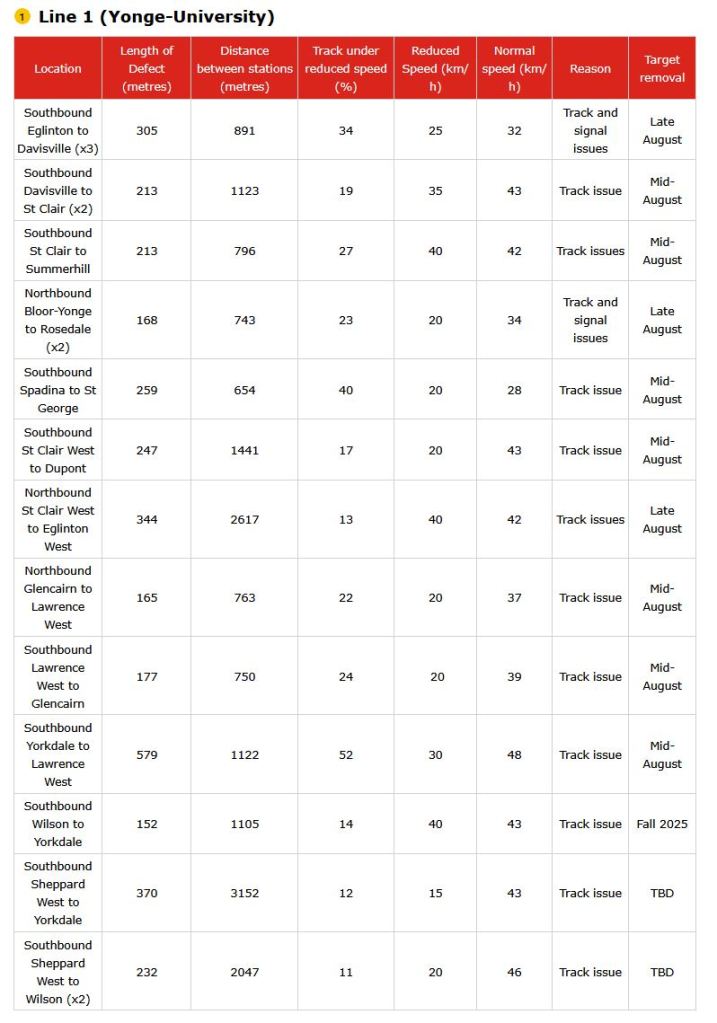
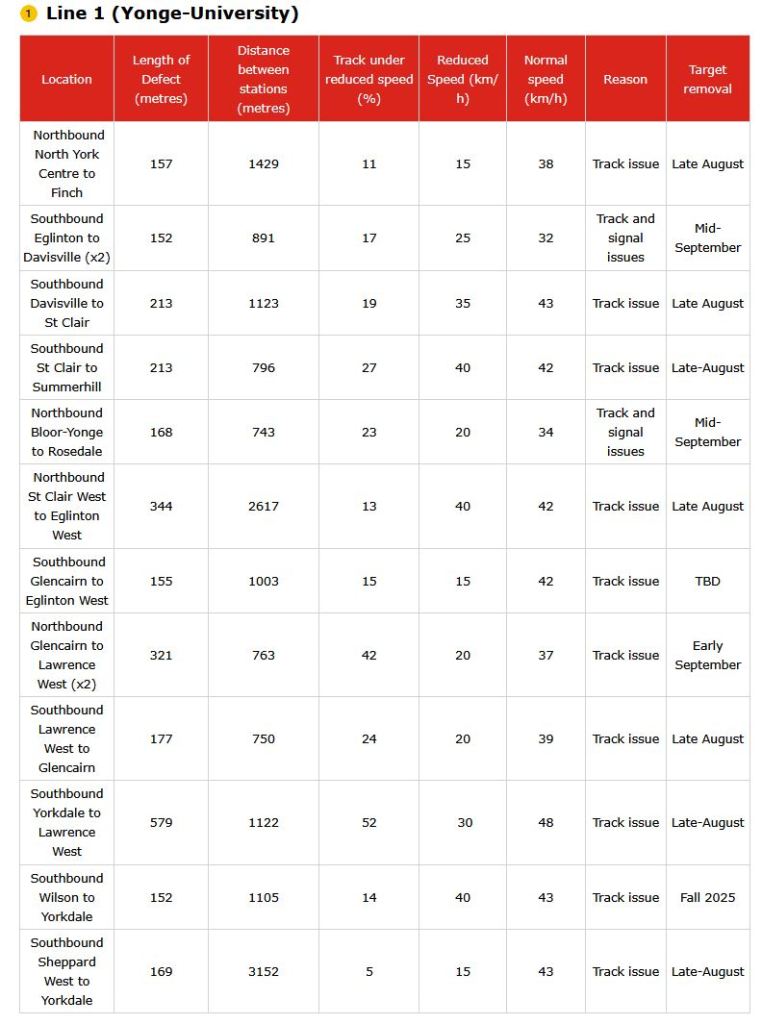
Much hand wringing and predictions of fiscal disaster met this report and a related one on the large shortfall in the State of Good Repair Capital Budget. More on that in my main article.
The big item, indeed the supposed primary reason for the meeting, was a report on possible 2026 implementation of six items from a proposed Ridership Growth Strategy. Many public deputants, mostly members of TTCRiders, spoke in support of various items notably the proposed capping of fares, a fare freeze, and improved service. This is precisely what one would expect from an advocacy group.
However, Chair Jamaal Myers lit into one of the speakers asking why they kept asking for things the TTC cannot afford. Those of us with long enough memories recall the tactic of harassing deputations as a classic trick from the Tory and Ford eras. It is not the role of a deputant to accept that nothing they ask for can be done, and meekly thank the Board for listening to their whispered requests.
Myers should remember his days as a community activist and know better than to berate a deputant for having the temerity to ask for better service from the City.
The debate became even more bizarre in consideration of Fare Capping and the idea that TTC should not be losing money on fare initiatives. One Board Member, Councillor Saxe, actually suggested that new riders who pay for their trip are more important than those who get additional free rides. She is woefully unaware that it is almost impossible to gain any new riders at a profit, even more so now that farebox revenue covers a much lower portion of total costs than it did before 2020.
This position does not prevent Saxe from pushing her hobby horse of free rides for groups of high school students on field trips. The premise is that this cost will build a future desire to use transit. Subsidy today, more fares, maybe, tomorrow, although the same students are likely to be unimpressed by indifferent service.
In this debate, two Board members one might think of as “progressive” went out of their way to downplay any proposals that might cost money even though they could make the transit system more attractive. Myers even toyed with the idea of service cuts downtown so that bus service could be improved in Scarborough. (I will turn to that nonsense in a separate article.)
The other members present offered little. Commissioner Jagdeo is a fiscal hawk from the Tory era, and predictably worried about how the TTC is effectively bankrupt. Commissioner Mihevc added little beyond concern for the size of the deficit in a way reminiscent of his days as a Councillor who also sat on the Budget Committee and was happy to limit TTC spending.
It is the TTC Board’s job to set policy and advocate for better transit. This might not always be possible in one go, but the Board should not start from an assumption that nothing can be done. Indeed, a spokesman for the mayor is quoted in the Star:
Mayor Olivia Chow said she “will not reduce service levels or raise fares,” adding the mayor “believes that improving service, reliability and safety is key to attracting riders back to the TTC.”
Committee Chair Alejandra Bravo strove to keep the discussion at a policy level, bouncing ideas around for strategic planning which is the purpose of her committee, while other members seemed intent on fixing the budget options today and closing off debate. How successful she will be in the long run remains to be seen given a clear desire to avoid such discussions by the Board’s Chair and others.
This was not the TTC’s finest day, and the blame must rest primarily with Chair Myers who seemed to hijack the agenda to preclude debate.
Solving the TTC’s problems will not be easy, but an attitude that nothing can be done runs counter to Council’s policy of improving use of transit. That’s not going to be cheap, and funders other than Toronto taxpayers and riders should contribute. Simply pushing discussion of what might be done off of the table is a backward move.