This article presents an update on previous reviews to service levels in January 2026 comparing it both with January 2020, and with November 2024 to show what has changed over the past year. Also reviewed is the evolution of travel times on major routes to show the effect of congestion-related schedule changes from 2020 to 2026.
All headway and travel time data here come from the TTC’s Scheduled Service Summaries. An archive of these files is available on this site here.
The usual citation is the number of vehicle and train hours operated today versus the “before times”. Here are the raw numbers:
Planned Weekly Hours
Regular Service
Construction
Total
January 2020
185,825
7,068
192,893
January 2026
193,662
5,234
198,896
These values can be misleading because the 2026 and 2020 networks are not the same. Moreover, one vehicle hour does not provide as much service to riders today because of slower operation and increased recovery times in the schedules.
From a rider’s point of view what matters is the headway, the time between vehicles.
Although many routes have more frequent service today than in 2020, this is not universal. Riders do not travel on “average” routes, but on those needed for each trip. Their experience could reflect a decline in scheduled service on their routes. This is compounded by reliability and the perennial problems of bunching and gapping.
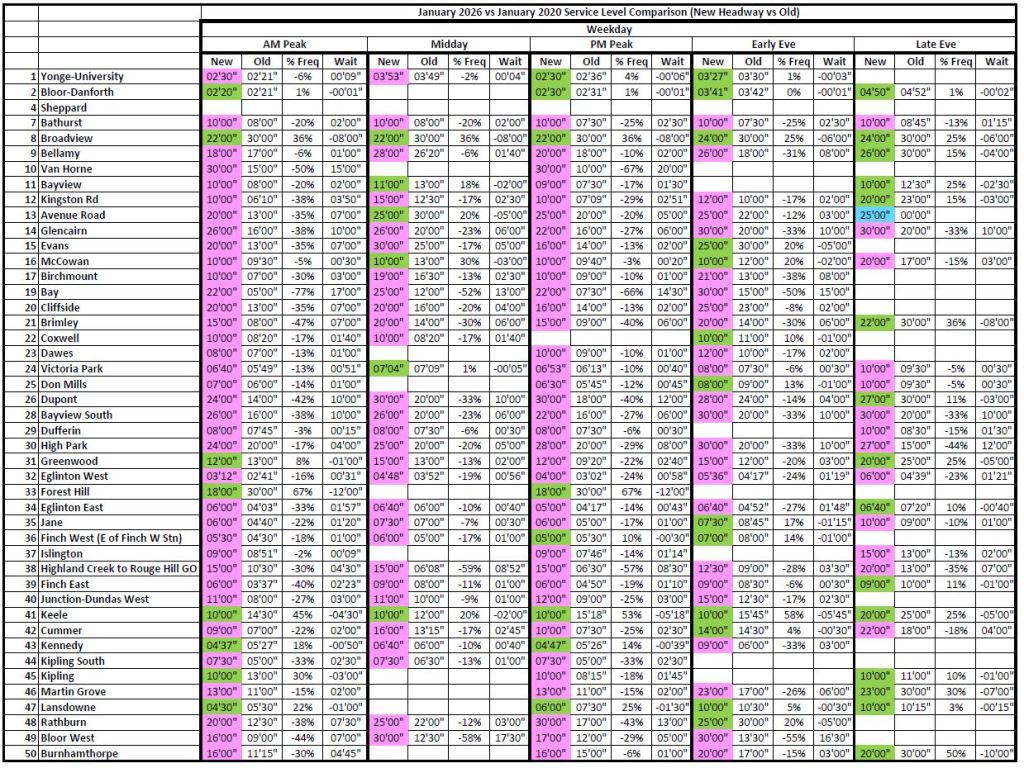
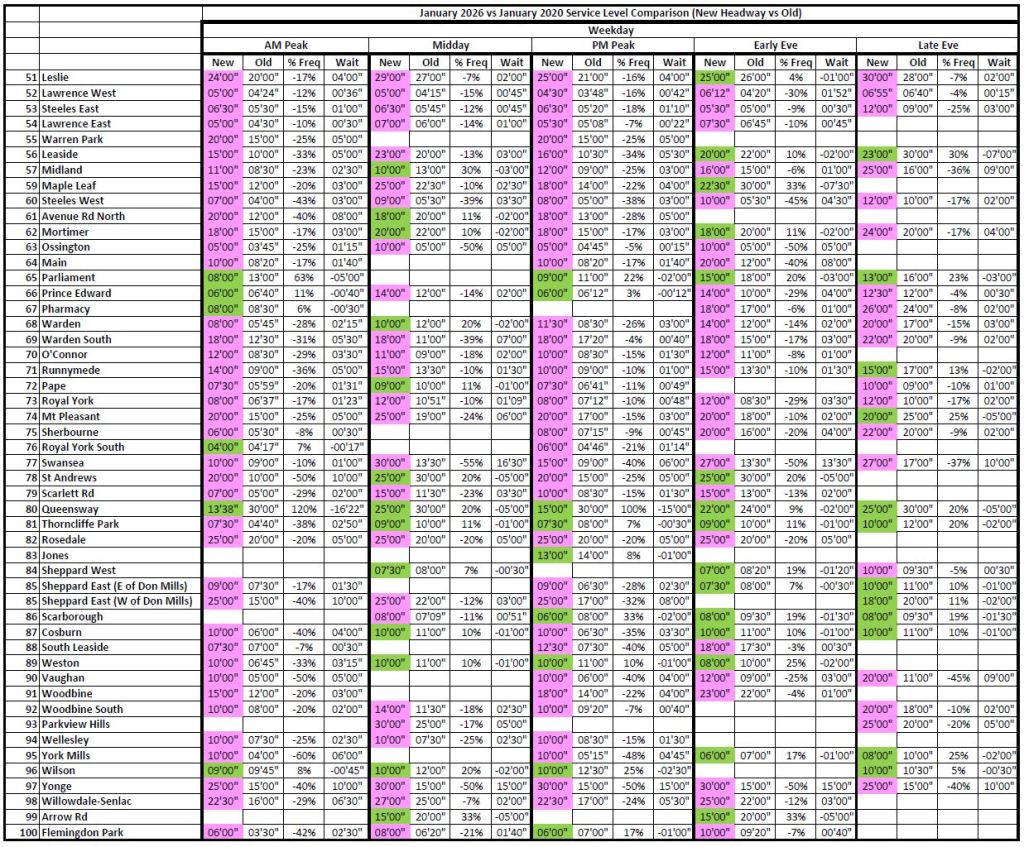
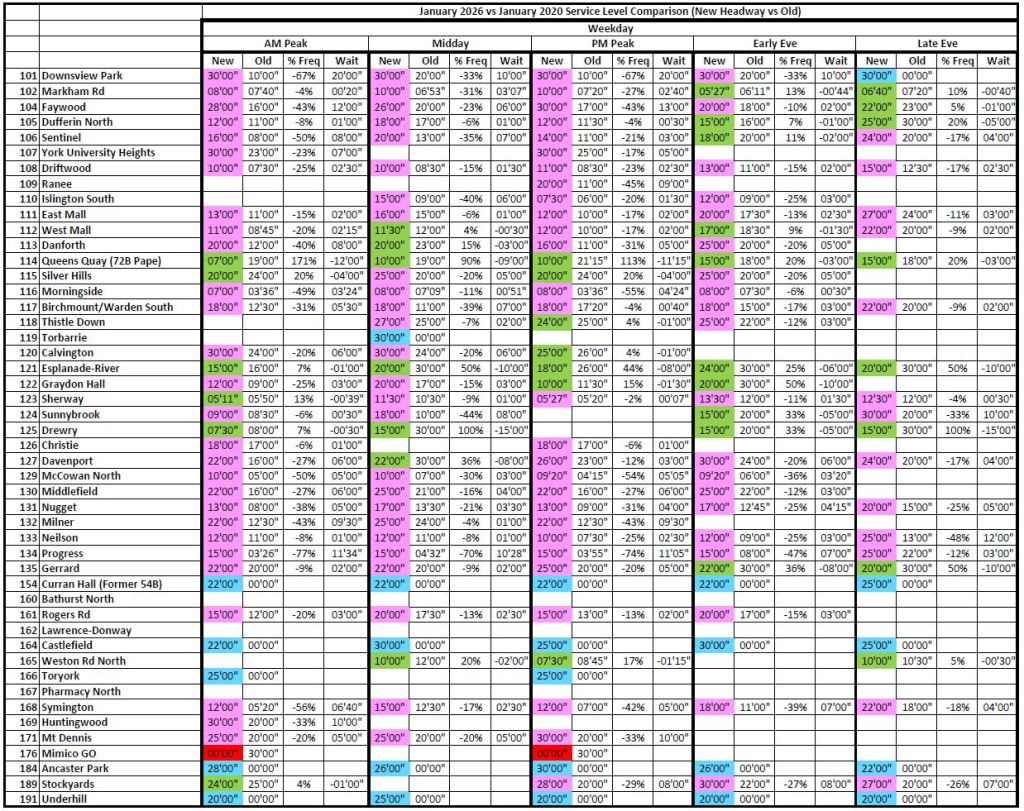
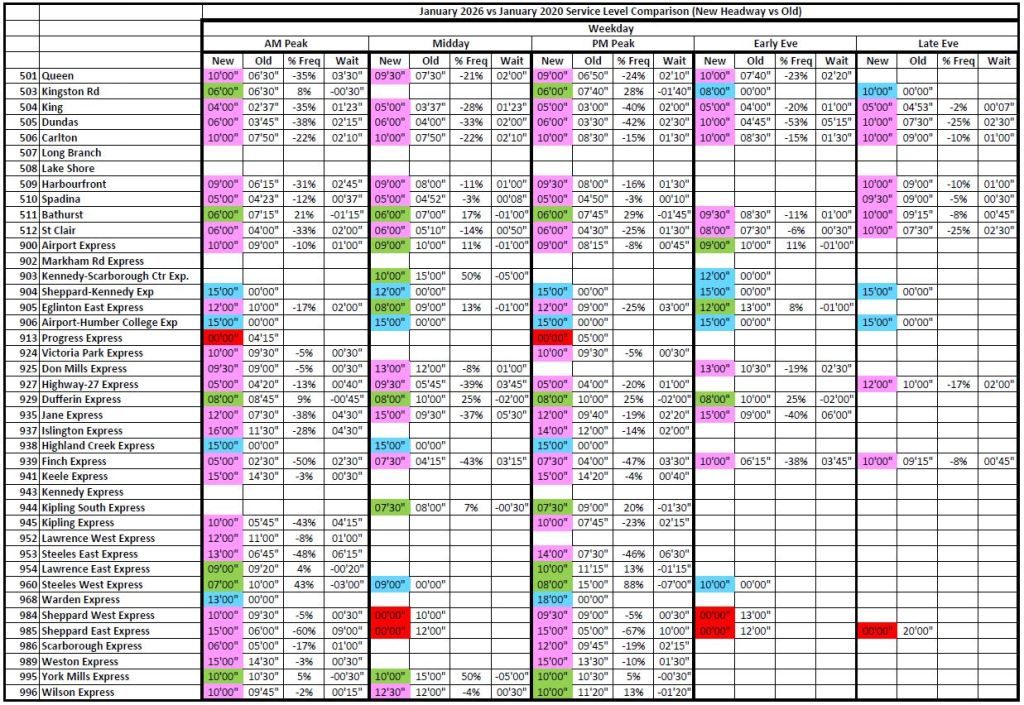
The table below compares January 2020 with January 2026 weekday headways. Five schedule periods are shown in the major groups reading across. Within these are the 2026 and 2020 headways, the percentage change, and the change in wait time.
Where the 2026 and 2020 times are unchanged, the cells are blank to avoid clutter. Otherwise, the 2026 headways are colour coded:
Green: Improved
Pink: Reduced
Blue: New service
Red: Service discontinued
There is a lot of pink in these charts indicating that many routes are less frequent today than six years ago.
Note that in January 2020, 503 Kingston Road and 505 Dundas operated with buses, and headways then reflected the lower capacity of those vehicles.
The TTC Board considered its Operating and Capital budgets on January 7 before passing them on to the City as part of the overall budget process. For details on these reports see:
Over roughly three hours there was a staff presentation, public deputations and a debate that often avoided major discussion of alternatives and future policy. A key item for future budgets is the shortfall in funding from provincial and federal governments, but also the city’s appetite for continued increases in the municipal subsidy.
Some commentary and claims about the TTC budget have distorted or missed some key items.
Yes, the TTC is asking for more subsidy in 2026, but at a level set by the Mayor’s Office before the budget was completed. We have known for some time that this number was $91-million, and the budget options were chosen to hit this target.
There is a confusion between actual cuts within the budget and “efficiencies”. The latter implies that there is always waste to be found that can keep subsidy calls down, but in fact barely $10-million falls under that heading for 2026, and there is even less available going forward into 2027.
The big reductions lie in accounting changes shifting depreciation costs to the Capital budget, and booking WSIB costs only for the current year rather than accruing future year costs arising from current incidents. There is also an unspecified corporate wide reduction with no indication of what the impact will be. These cannot be repeated in 2027.
The budget-to-budget comparison from 2025 to 2026 looks not too bad because 2025 budget was at a higher level than actual results. The gains needed in 2026 are considerably higher measured against the 2025 actuals which are below the budgeted levels.
Discussion of how to eliminate the operating shortfall through the farebox led to the frightening figure of a $1.90 fare increase. This of course would have a huge effect on affordability and ridership especially if programs to improve service were choked off at the same time. That big number is a direct result of years of fare freezes going back into the Tory era and the fact that ridership is still well below 2019 levels. The gap gets wider and wider, and would be paid for by bigger and bigger fare hikes if that approach were taken.
Appeals for better operating funding will inevitably run into claims that other cities have raised fares while Toronto chose to keep its fares low. That is a policy decision by the City. Should additional subsidy be paid to support that from other governments? One problem with numbers cited by management is a mix-and-match of cash fares and regular adult fares in some cities that they cite by comparison to Toronto. For example, the MiWay (Mississauga) cash fare is $4.50, but the adult Presto fare is $3.50, only slightly higher than Toronto’s.
Fare enforcement has improved revenue by more than expected, but is hampered by available staffing and operating practices such as all-door loading that would cost money and capacity if they were changed. The Board seems incapable of looking at both sides of the ledger and fixates on revenue, enforcement and limiting opportunities for evasion without considering the effect on service delivery.
Claims about service improvements in 2026 muddle what is actually in the budget. The subway service improvements were actually implemented in 2025. All the budget does is make provision for full-year funding of this change (and similarly for other 2025 changes). Subway service is constrained by the size of the Line 1 and 2 fleets, plus the limitations of the signal system on Line 2. Current replacement plans do not add to the fleets, and there is considerable expense to keep Line 2 trains running until the new trains arrive. There is some provision for extra bus and streetcar service, but some of that will disappear to congestion effects, and service improvements will not begin until Fall 2026.
Commissioner Saxe proposed that the TTC study the elimination of cash fares. Nothing will come back on this for two budget cycles (i.e. at least 2028) because the report is not due until early 2027 and will likely have no effect on that year’s budget.
Chair Myers proposed that the 2027 budget and subsidy consider linking goals and metrics for TTC performance. This is a dangerous idea on a few counts. Most obviously, what targets would the TTC aim at? It is no secret that existing metrics leave a lot to be desired and, in some cases, have been cooked to put management in the best light. The last thing we need is a potential cut in funding to arise from failure to meet targets, or to be based on metrics that do not reflect actual rider experience. In turn, that would encourage creative reporting of results when what is needed is transparency and honesty.
This article includes reviews of the 29/929 Dufferin local and express services to the end of 2025. The major item of interest is the introduction of “red lanes” south of Bloor Street and their effect on the bus service. Detailed charts are included here for:
November and December travel times in both directions between King and Bloor.
January 2024 to December 2025 historical stats on travel times.
The segment between Lawrence and Wilson that does not have transit priority, but which has much more congestion than at the south end of the route thanks to Yorkdale Mall.
General observations:
The benefit of the red lanes is more pronounced for northbound than for southbound trips, and only at certain times of the day.
There is much more severe disruption of service northbound near Yorkdale Mall, but no transit priority measures are proposed there.
Headways on Dufferin remain widely scattered near terminals (northbound at King, southbound at Transit Road just outside of Wilson Station).
Even on Christmas Day when weather was relatively benign and travel times were lower than normal, headways were not reliable.
Part of the improvement in travel time in December 2025 could be due to seasonal effects. When the data are in for early 2026, we will see how long-lived the saving actually is. I will publish an update to this article in a few months when the pattern is clear.
There are a lot of charts in this article, and I have put them all after the “more” break. Those who are interested in the details can open the full article.
I will turn to a review of 511 Bathurst streetcar and 7 Bathurst bus which both saw recent changes in future articles.
Update: For clarity, the red lanes currently extend only as far north as Dundas. After work up to Bloor is completed in the Spring, I will publish an update showing the effect.
The TTC’s 2026 Capital Budget and Plan will be discussed at a Board meeting on January 7 in advance of passing this on to Council for the beginning of the City’s budget cycle on January 8, 2026. There are four reports in the budget package:
There is a lot of detail in the plans, and reading them can leave one mired in a sea of projects and figures. All the same, this plan is as important to the TTC’s future as the Operating Budget which usually gets most of the attention. Key to the Capital Plan is the “State of Good Repair” (SOGR), the need to keep many parts of the system in working order to provide reliable, safe service and to be a foundation for transit growth. Political effort tends to go to single, large projects such as the replacement of the Line 2 subway fleet, but the combined value of less glamourous capital maintenance is considerably larger.
There are two types of maintenance budgets. One lies in the Operating Budget where day-to-day repairs are funded. The Capital Budget funds major overhauls and replacement of infrastructure and vehicles. The capital side can be “spikier” in individual budget lines because some components are totally replaced but infrequently. This leads to uneven funding needs, and the marquee projects can crowd out routine but necessary work.
Another consideration for capital is that some infrastructure has a very long lifespan, but eventually reaches the point where major investment is needed. The subway system was built in stages from the 1950s onward, and as it ages there are new costs just to keep old infrastructure in good repair. For example, the signal system on Line 1 has been replaced and preliminary work for Line 2 is underway. The Line 2 signals are 60 years old, and they will be even older when they are eventually replaced.
Fleet planning for the rail modes, subway and streetcar, has peaks and valleys of procurement because entire sets of cars are replaced in a single order. On the bus fleet, in theory the procurement should be continuous, but even here there are peaks caused by uneven purchasing in past years, occasional special subsidies for purchase of specific vehicles, uneven reliability among various bus types, and an uneven rate at which old vehicles are retired. Quantities can be affected by manufacturing issues as is now the case with eBus procurement.
Funding programs come in two flavours. One is project specific such as the subway car purchase, while the other comes at a fixed annual rate such as gas taxes and the new Federal transit funding program. Capital spending plans have to fit around the rate at which money flows from many different sources. Major expansions such as the Scarborough Subway used to reside in the TTC’s budget, but they are now completely funded and managed by Metrolinx with provincial funding.
The TTC presents its Capital Budget in three versions with different timelines.
A one-year budget for the current year.
A ten-year plan corresponding to the City of Toronto’s financial plans.
A fifteen-year plan showing all projects beyond the ten-year window but with an important difference to the one- and ten-year versions — all projects are included whether they are funded or not showing the gap between the funded 10-year version and actual needs.
Historically, the 10-year plan was trimmed to fit known and expected funding, and everything else went “below the line” (in the sense that it came at the end of the budget). A common trick was to push enough of the planned spending beyond the 10-year window. In spite of routine hand-wringing about TTC finances, the current budget was always magically kept intact and the hard decisions were left to another day. Now with the 15-year plan, those future costs are visible, and even then new items crop up. The “below the line” segment is now twice the size of the funded budget.
The lack of long-term funding is a major issue for Toronto especially considering Council’s desire to substantially increase transit’s share of travel.
Overview
Here are high level views of the one year, ten year and fifteen year plans.
Source: TTC Capital Budget
Although the one year plan for 2026 is about 10 percent of the ten year plan, the spending is uneven with more than half of the total in the first five years. This reflects anticipated funding availability which drops off in the latter half.
Source: TTC Capital Budget
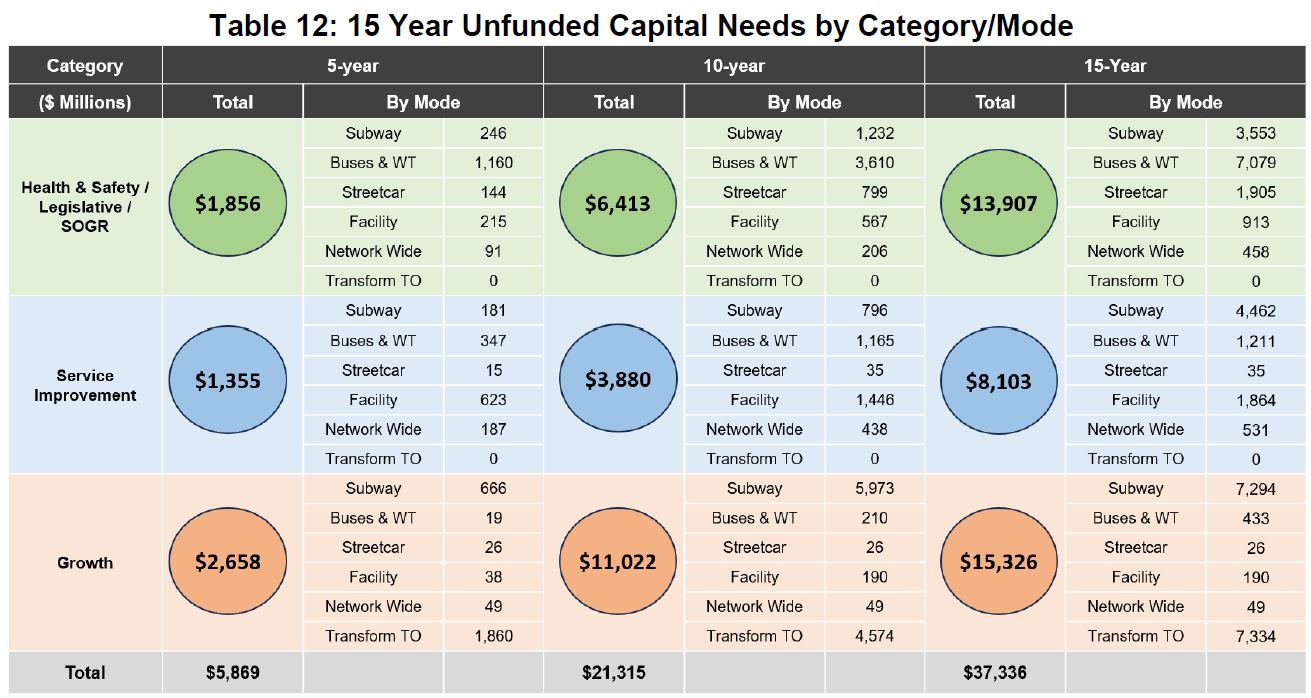
Longer term, over two-thirds of the fifteen-year total is only in the Capital Plan. This does not mean that the TTC would spend the remaining $37-billion in the last five years. This is the “below the line” effect where work that is not yet funded is shown in the long-term plan even though much of that work is needed well before 2036.
The unfunded projects span every aspect of the TTC. The chart below breaks down the funding gap and shows how it grows from the short to long term. (Note: the values reading across are cumulative.) The $37.3-billion here is the difference between the 10-Year Capital Plan ($16.7-billion) and the full 15-year plan ($54.0-billion). This is not an issue for the indefinite future, but one which faces the City today with a shortfall of over $1-billion annually for the next five years, growing to over $2-billion in a 10-year view and even more in a 15-year view.
Note that TransformTO is included at a projected capital cost of $7.3-billion, over half of which would be spent in the first 10 years. If Toronto is really serious about major investments in system capacity and attracting many more riders, the decision to proceed must occur soon together with the spending commitment. Whether this will attract support from other governments is quite another matter, and there is sure to be a debate about competing priorities for transit funding regardless of its source. This will require a long-term political commitment to growth of the whole network, something notably absent except for subways.
Source: TTC Capital Budget
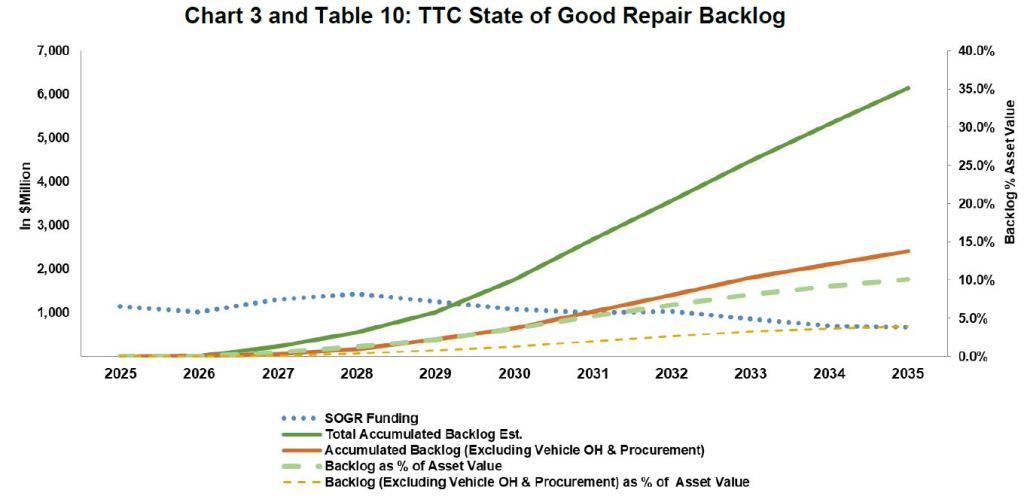
A related issue is the growth of the SOGR backlog as infrastructure and fleets age faster than funding is available to renew them.
Source: TTC Capital Budget
Although the TTC has chipped away at the SOGR backlog in the short term, changes in estimates for later years have worsened the problem. Three sources are cited for the increase.
eBus procurements, which count as SOGR because they replace existing buses, have increased “by $854.8 million as of 2034, and $1.277 billion as of 2035.” eBuses are proving more expensive to buy, and more or them are needed for projected service levels.
Overhaul costs for all modes increase “by $169.1 million as of 2034, and $277.2 million as of 2035”. Some of this is due to changes in fleet plans which push vehicle replacements further into the future requiring more SOGR maintenance on older vehicles, notably subway trains and buses.
Subway track goes up “by $123.0 million as of 2034, and $148.7 million as of 2035.” Thanks to new assessments of track condition, the TTC has recognized a need for accelerated replacement of older track.
This is a perennial problem with capital plans — the scope and/or pricing of future projects rises faster than the provisions built into the plan, and there is year-to-year growth even if nothing is added to the shopping list.
Funding
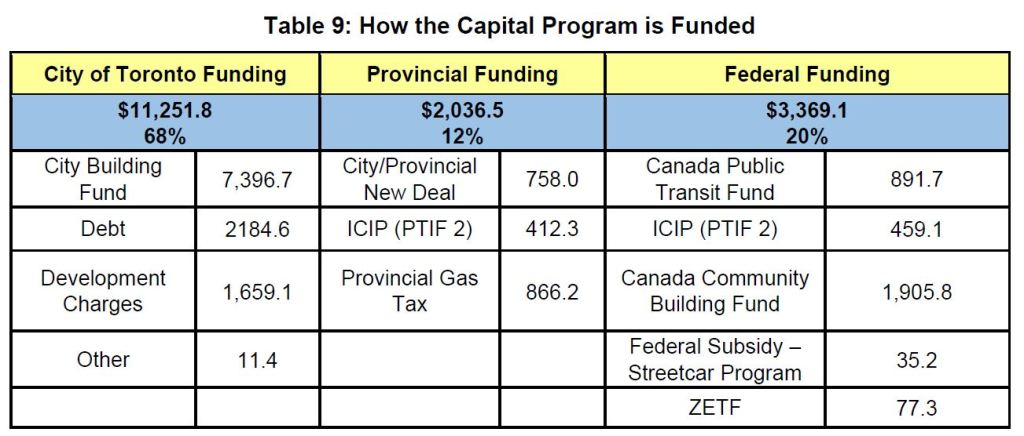
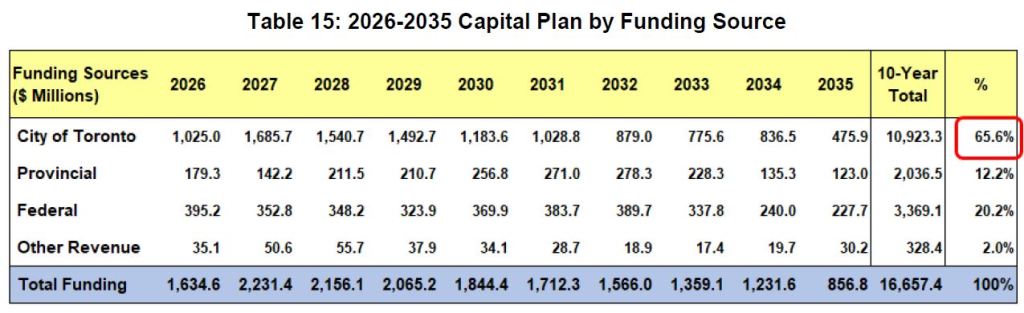
The 10-year plan is funded from various sources as shown in the table below. Some of these are time limited and project-specific. For example, the streetcar funding looks after the tail end of the 60 added car procurement and related changes at Harvey Shops so that it can function, in part, as a carhouse. The Zero Emission Transit Fund only covers current eBus procurement, and it is unclear how much this program will be extended, and what proportion of costs it will cover. Development charges will fall in later years of the plan as the current regime expires and rules for what can be included change. The New Deal with Ontario is also time-limited, although the City and TTC are negotiating an extension.
This only accounts for the funded part of the budget, and much more is required, some of it in the early years.
As things stand, the City carries almost two-thirds of the total cost primarily through debt financed through City Building Fund revenue (essential a property surtax) and by debt supported from general revenue.
From somewhere, the City must find a further $37.3-billion, a number certain to grow, or it must trim some projects from the wish list. The level of support needed from provincial and federal sources is woefully inadequate to address Toronto’s needs. Toronto is not alone with this problem, but it has the biggest funding gap given the size and complexity of the transit system.
Real Estate Investment Plan
A separate report details planning for real estate requirements.
When it was created in 2022, the Real Estate Investment Plan’s goal was to flag the need for property well in advance of actual requirements so that construction would not be delayed. One example of how this happened is the SR busway conversion where a project unforeseen in the plan was delayed awaiting settlement of various property issues.
The REIP highlights needs separately from the main budget, but the report is rather disorganized and is not cross-referenced to the main Capital Plan. Some items are quite small while others such as studies of future use for properties like Hillcrest and the Kipling Yard site are bound up with basic questions of what the TTC will become in future years.
Many parts of the REIP address housing various TTC functions which have grown over the years into an expanding collection of trailers as “temporary space”. The TTC also occupies many leased spaces for offices that have outgrown the Davisville headquarters and other major sites. Talk of a new consolidated Head Office has been heard for years, but nothing concrete emerged. The context now is a wider City plan to consolidate office space. This should primarily affect the Operating Budget both through reduction in rent costs and improved efficiency of co-located staff.
Updated December 30, 2025 at 10:45pm: The description of proposed service changes on the subway has been amended to reflect that the headway changes on Lines 1 and 2 are already in place. They show up as “new” in the 2026 budget because they were not included in 2025.
The Toronto Transit Commission’s Operating and Capital Budgets will be considered by the TTC Board on January 7, 2026, and will go from there to City Council for final approval. This article discusses the Operating Budget, and my next one will deal with the Capital Budget and Plans for 2026-2040.
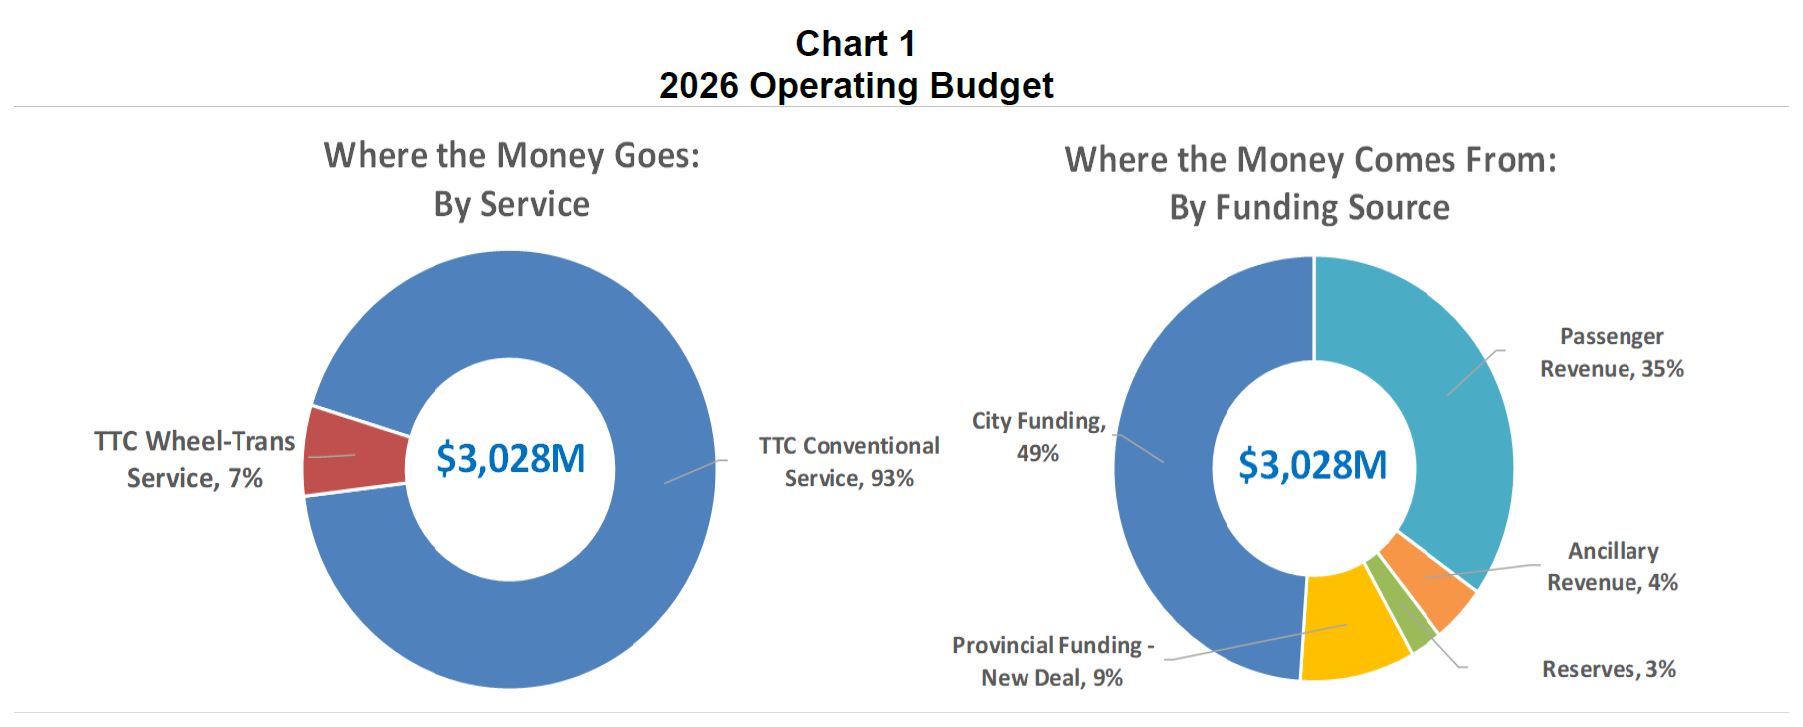
Through a combination of belt-tightening and accounting magic, some of which cannot be repeated in future years, the TTC manages to freeze fares for a third year, introduce fare capping, retain and improve overall service levels, and stay close to the City’s target of $91-million in added subsidy for the new year. This is roughly equal to the $90.8-million rise in Provincial subsidy for the operation of Lines 5 and 6.
The pie charts below give a high level view of the budget. Note that passenger and ancillary revenues (fares, parking lots, shop rentals, advertising) account for only 39% of the total, and City subsidy is almost half. This is a huge change from the days when the City and Province each paid one sixth of the total, and the lion’s share of the remainder came from fares.
Source: TTC Budget p. 3
Fare Changes
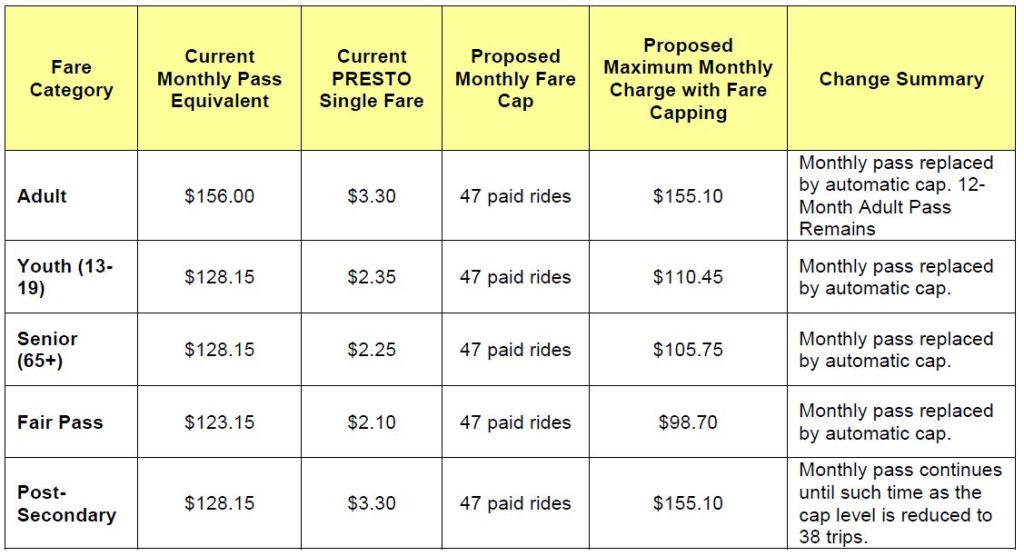
For riders, the biggest news is the fare freeze and capping, to be introduced in September 2026 with a view to further improvement in September 2027. The Adult fare cap is close to the price of a monthly pass, and so riders who already buy passes will see only a small change in their cost. However, the benefit of a capped price will be available to all riders without an upfront payment for a pass.
Youth, Senior and Fair Pass fares will be capped at the same ratio, 47 rides, and this is an improvement over the current higher multiples of 54.5, 57 and 58.6 respectively. Frequent TTC riders in these classes will see reduced costs.
The odd group out here are Post Secondary students whose pass is priced at the same rate as Youth and Seniors, but who pay the full Adult fare if they do not have a pass. This creates a situation where a pass is cheaper than capped single fares. The policy issue here is whether the Post Secondary single fare should be reduced to the Youth level and the monthly pass eliminated.
If the fare cap is reduced to 40 in September 2027 (a decision subject to the 2027 TTC Board and City Council), this will be equivalent to a 15% reduction in the monthly pass cost.
Source: TTC Budget p. 31
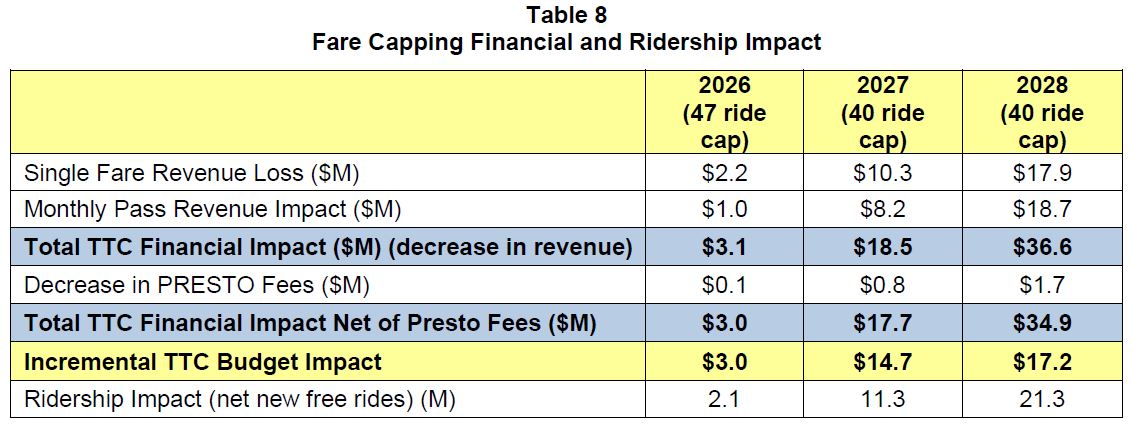
The anticipated cost of fare capping in foregone revenue is $3.1-million in 2026, $18.5-million in 2027 and $36.6-million in 2028 assuming that the 40 fare cap is implemented in September 2027.
Source: TTC Budget p. 22
All of this occurs with the hoped-for greater riding and extending the benefits of fixed transit costs to more riders. However, fare freezes and reductions cannot go on forever without also discussing the TTC’s ability to retain and improve transit service. A large “SALE” sign attracts few customers if the shop window is half-empty.
Service Changes
The service budget increases by 2% measured in service hours “to address congestion, adapt to changing travel patterns, deliver world-class service during the FIFA World Cup” with an expected ridership of 426.4-million in 2026 compared to a projected 414.0-million in 2025. Note that this is still lower than the original 2025 projection of 439.4-million. The budget does not explain how much of this increase will show up in more frequent service as opposed to congestion adjustments and the one-time bump for FIFA.
One specific change mentioned in the budget is the restoration of peak service on Lines 1 and 2. For reference, here are the current peak service levels and the levels operated in January 2020. Line 2 is already operating at the 2020 level, and Line 1 would only improve by 6% (measured as trains/hour) in the AM peak. The controlling factors in peak service levels are the signal systems and the fleet sizes which prevent service improvements beyond the 2020 levels.
Updated December 30, 2025 at 10:45pm: The “restoration” of peak subway service appears here because it is a budget-to-budget change even though it was actually implemented in late 2025. This does not represent net new service compared to year-end 2025.
Line
AM Dec 2025
AM Jan 2020
PM Dec 2025
PM Jan 2020
1 Yonge University
2’30”
2’21”
2’30”
2’36”
2 Bloor Danforth
2’20”
2’21”
2’30”
2’31”
Source: TTC Scheduled Service Summaries
Ridership
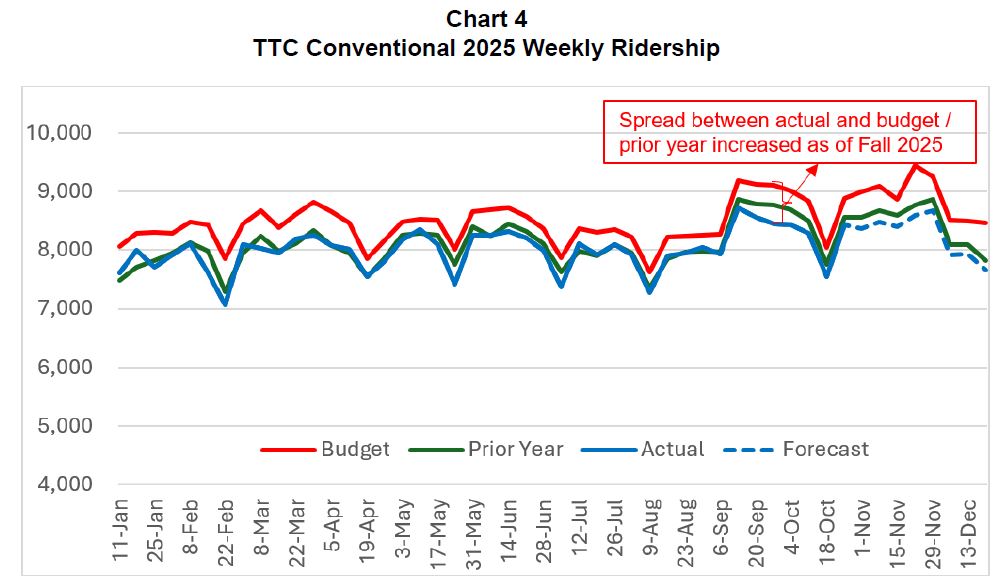
Conventional system ridership has not done well against budget projections in 2025. The budgeted value (top line, red in the chart below) has been consistently above actual counts (blue at the bottom). 2025 numbers closely tracked 2024 values (green) until the Fall when they fell lower. The shortfalls are attributed to a combination of undue optimism about the effect of return-to-work commuting and the loss late in the year of foreign students.
Source: TTC Budget p. 16
Projections for 2026 are less aggressive and, for budget and service planning, the “medium” increase will be used.
Source: TTC Budget p. 14
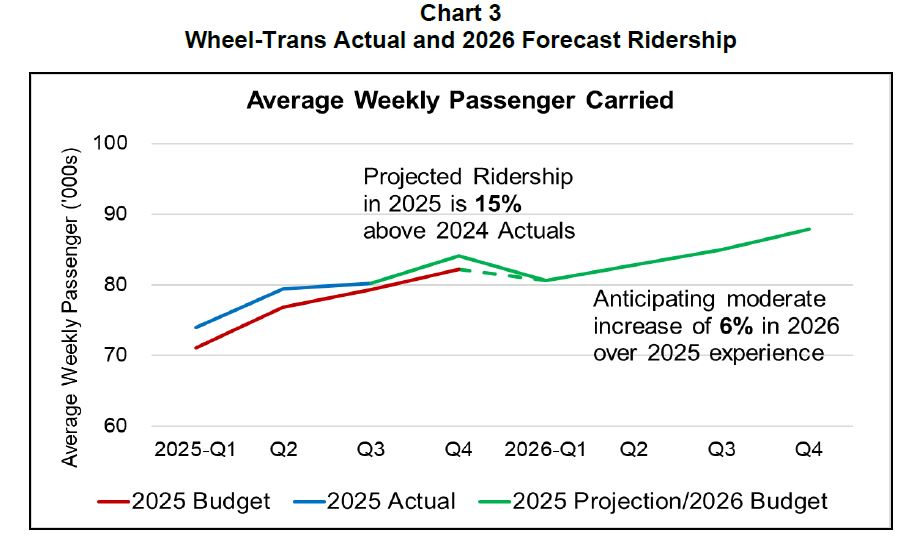
Wheel-Trans demand is strong and more growth is expected there in 2026.
Source: TTC Budget p. 15
The issue of future demand affects both the operating and capital budget planning process, and there have been conflicting indications of where the TTC thinks this is headed. In the short term, they expect little growth, but a recent Major Projects Update claims that current projections will accelerate the need for extra capacity on Lines 1 and 2.
Line 1 – Capacity Enhancement Program:
This program provides for the expansion of Line 1 capacity by achieving headways of up to 100 seconds, enabling the movement of up to 39,600 passengers per hour at peak hours. […] Headways of 100 seconds by 2037 were based on pre-pandemic projections. The updated ridership demand forecasts will require headways to be achieved earlier (2035). Full schedule and scope impacts are currently being evaluated. [p. 23]
Line 2 – Capacity Enhancement Program:
The ridership demand forecasts have been updated and are under review, extending to 2051, and will require the target headways to be achieved earlier than previously planned (135 seconds by 2028, 130 seconds by 2029, 125 seconds by 2030, and 120 seconds by 2037). Full impacts are currently being evaluated and will be outlined in a detailed report to the Board. [pp 20-21]
How this fits with overall system demand, fleet and service needs is not explored in the budget. As the chart below shows, TTC riding has not yet returned to 2019 levels. The “flip side” of that observation is that the pre-pandemic era was noted for overcrowding on many routes and spawned expansion plans such as the Bloor-Yonge project. Toronto should not wait to be back at 2019 and its capacity problems before planning for growth.
Metrics and Targets
The TTC has several metrics to track their operation and associated targets. Notable among these are Customer Satisfaction and On-Time Performance. Although the TTC is working internally on new metrics, these have not yet appeared. A major problem with the concept of “on time” is that it has more meaning for internal purposes than to riders on most routes where service is frequent, but erratic. It is reliability, not the schedule, that matters especially when considerable variation is allowed by TTC standards.
The TTC will make changes to several routes on January 4. Some of this is simply the restoration of service oriented to school traffic, but several routes will see a mixture of adds and cuts to address ridership. The actual change from December to January is only 518 weekly hours, and most improvements are offset by cutbacks.
One new route, 906 Airport-Humber College Express will begin operating.
The detailed service plans for all changes are in a spreadsheet at the end of the article.
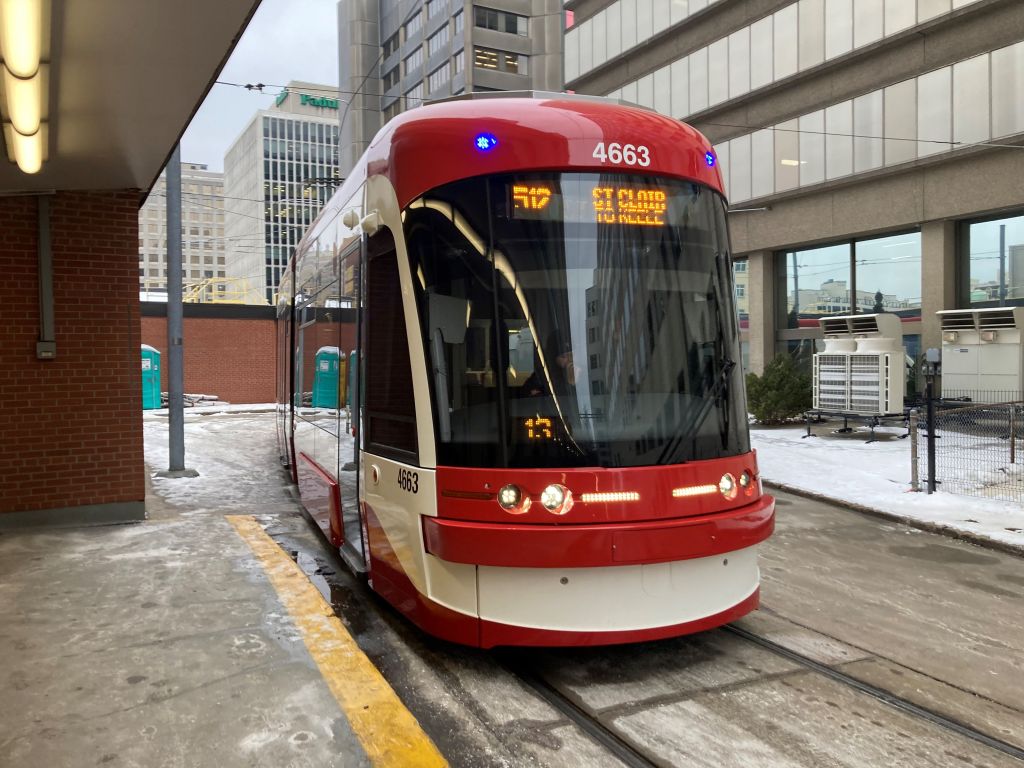
The last of the TTC’s 60-car add-on streetcar order arrived in Toronto recently, and entered service on December 16, 2025. This brings the streetcar fleet to 264 vehicles.
4663 at St. Clair Station Loop, December 16, 2025. Photo by Jeffrey Kay.
With so many streetcars, the real shame is that the service is so poor on many routes through a combination of 10-minute headways and erratic operation, not to mention the effect of never-ending diversions, construction projects and bus replacements.
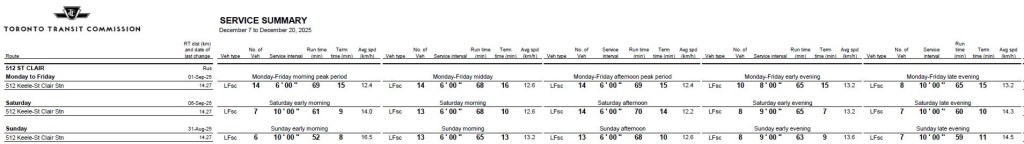
The TTC began a shift to a 6-minute headway standard with 512 St. Clair earlier in 2025, and this was followed by 505 Dundas and 511 Bathurst in mid-November.
Due to construction at Queen & Broadview, the 503 Kingston Road car is operating with buses, and will continue to do so at least until April 2026. There are moves afoot within the TTC to kill off the all-day operation of the 503 downtown, but one of its biggest challenges comes from irregular service on the 503 itself, and the total absence of headway blending where the 503 joins the 501 Queen car westbound at Kingston Road and Queen. Pairs of 503 buses are a common sight today, and 503/501 pairs were common when streetcars plied both routes.
The TTC simply does not take seriously the effect of unreliable service on ridership.
As we see a move to a new 6-minute standard, the question is just how far the 264-car fleet will stretch. The table below shows all of the streetcar routes with headways and PM peak car requirements. Toronto has not seen every streetcar route active at the same time for a very long time thanks to equipment shortages during the later days of the CLRV fleet, and the omnipresent construction projects that always managed to keep a route running with buses. One might think that the TTC overextended its route closures simply to save on streetcar operations.
In fact, a big shortage lies in operating staff and in budget headroom to field more cars on a scheduled basis.
If all streetcar routes were operating with streetcars today, the TTC would need 172 cars for service. A 20% provision for spares would raise this to 206 leaving a substantial pool of cars on the sidelines.
The right-most column below shows the current peak requirements scaled up for routes that now run on headways above six minutes. For example, getting 501 Queen down from a 9-minute to a 6-minute service would require 14 more cars. The total for an all-streetcar operation would be 215 cars, plus 43 spares for a total of 258, only slightly below the fleet size.
Until we see details of the 2026 budget, we will not know if any more routes will join the 6-minute network in the coming year.
Route
Headway
Peak Cars
Cars Required for 6-Minute Network
501 Queen
9’00”
28
42
503 Kingston Road to York (April 25)
10’00”
12
20
504 King (April 25)
5’00”
27
27
505 Dundas
6’00”
25
25
506 Carlton (Sept 25)
10’00”
19
32
507 Long Branch
10’00”
8
13
508 Lake Shore
Trippers
5
5
509 Harbourfront
9’00”
6
9
510 Spadina
5’00”
14
14
511 Bathurst
6’00”
14
14
512 St. Clair
6’00”
14
14
Total
172
215
The 60 new cars were intended both to handle growth and to provide for the Waterfront East line that is still only a faint hope for better transit there. An update on this project is expected at Council early in the new year, but a projected opening date lies in the 2030s.
The TTC is also short carhouse space. Thanks to the arrival of all 60 cars well before planned work completes to expand storage and maintenance capacity at Russell and Hillcrest. Part of the main shops will be converted as a streetcar barn serving 512 St. Clair and possibly 511 Bathurst. Several Blue Night streetcar routes operate with improved headways simply to reduce overnight storage demands on the carhouses.
The streetcar system always pulls up the rear in reliability stats, and recovery of pre-pandemic demand is not as strong on that part of the network as elsewhere. This is due in part to a shift in travel and work patterns in the area streetcars serve, but one cannot help wondering how much the erratic service deters riders from returning.
An ironic side-effect of a move to 6-minute service is that this makes “on time” an easier target, but with bunching as a daily event. The reason is that TTC vehicles can be up to 5 minute late and still count as “on time”. On a 6 minute headway, this easily leads to pairs of “on time” vehicles every 12 minutes. The real condition of service is hidden by a too-easily attained “target”.
The bus network also has fleet utilization issues, but these are a mixture of scheduled service levels, vehicle reliability, budgeted headroom for growth and the use of “Run As Directed” buses. The “RADs” are a relic of the Leary era that were routinely cited as a catch-all alternative to addressing specific problems. The vehicles were not well-used and their numbers dwindled as the pool of spare operators moved to other duties, notably on Lines 5 and 6. I will turn to the bus fleet in a future article.
For 2026, streetcar routes face many challenges:
Provision of enough budget to allow improved utilization of the streetcar fleet.
Service management that actually brings evenly spaced streetcars on dependable headways.
Addressing the validity of operating practices that hamper streetcar speeds everywhere, rather than just at locations with problems such as badly worn track. This includes sorting out constraints that really do relate to “safety” as opposed to using that as a catch-all excuse for padded schedules.
Addressing track switch controller issues that have plagued the streetcar network for decades.
Providing real transit signal priority for streetcars including at locations where diversions and short turns see streetcars fight through traffic attempting turns with no signal assistance at all.
An end to construction diversions scheduled for longer periods than actually needed to complete road, water, track and overhead repairs or upgrades.
Getting City projects that are supposed to be co-ordinated with streetcar track and overhead repairs to actually start and end when they are planned.
The TTC will adjust schedules on December 21 to reflect lower demand over the holiday period.
506/306 Carlton will revert to the normal route between Spadina and Bay following work at McCaul Street. Additional service on the west half of 94 Wellesley will be removed.
306 Carlton night service will be improved from a 20′ to a 15′ headway.
The following routes will get added, unscheduled service using surplus operators:
57 Midland
80 Queensway
89 Weston
123 Sherway
131 Nugget
960 Steeles West Express
Some routes which received unscheduled additions in November will lose it for the holiday period. This will be restored in January.
7 Bathurst
24 Victoria Park
25 Don Mills
29 Dufferin
100 Flemingdon Park
165 Weston Rd North
Service over the period will be adjusted day to day as shown below.
Date
Service Design
Fri. Dec. 19
Regular weekday service
Sat. Dec. 20
Regular Saturday service
Sun. Dec. 21
Regular Sunday service with minor changes
Mon. Dec. 22 to Wed. Dec. 24
Adjusted weekday service (school trips removed)
Thu. Dec. 25
Holiday service with most routes starting at 8am
Fri. Dec. 26
Holiday service with 32 shopping extras between 11am and 10pm
Sat. Dec. 27
Regular Saturday service with minor changes
Sun. Dec. 28
Regular Sunday service with minor changes
Mon. Dec. 29 Tue. Dec. 30
Adjusted weekday service (school trips removed)
Wed. Dec. 31
New Year’s Eve service (see below) (school trips removed)
Thu. Jan. 1
Holiday service with most routes starting at 8am
Fri. Jan. 2
Adjusted weekday service (school trips removed)
Sat. Jan. 3
Regular Saturday service with minor changes
Sun. Jan. 4
Regular Sunday service
Mon. Jan. 5
Regular weekday service including school trips
New Year’s Eve Service
Service will operate free of charge from 7pm on December 31 to 7am on January 1. Late evening service on most routes will be extended to 3am January 1.
Depart
Arrive
1 Yonge-University-Spadina
North from Union to Finch
2:31 am
3:02 am
North from Union to VMC
2:27 am
3:10 am
South from Finch
2:00 am
South from VMC
1:50 am
2 Bloor-Danforth
East from Kipling
2:15 am
East from Bloor-Yonge to Kennedy
2:40 am
3:02 am
West from Kennedy Station
2:18 am
West from Bloor-Yonge to Kipling
2:39 am
3:08 am
4 Sheppard
East from Sheppard-Yonge to Don Mills
2:57 am
3:05 am
West from Don Mills to Yonge to Sheppard-Yonge
3:09 am
3:17 am
Contract services on 52 Lawrence West to Westwood and 68 Warden to Major Mackenzie will end at about 3am. 160 Bathurst North, 102 Markham Road and 129 McCowan North will end at their usual times.
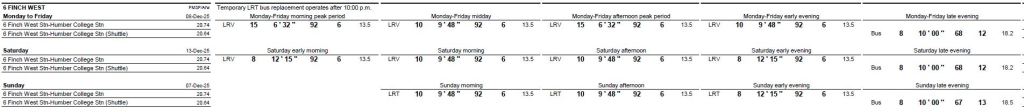
Note that the memo detailing these changes was issued before Line 6 Finch opened, and therefore contains no info about that route.
At the TTC Board meeting on December 10, 2025, there was an extensive discussion on the poor showing of Line 6 Finch since it opened a few days ago.
Predictably, this was a mix of “give us time to get things working”, disappointment over the bad impression left in riders’ minds, and attempts at hard questions about what went wrong. I say attempts because there were many evasive or just plain misleading replies, coupled with a stifling blanket of Metrolinx confidentiality thrown over the debate.
Yes, thanks to the multi-party agreement between TTC, Metrolinx and others for the Finch project, many aspects of it cannot be discussed in a public session because Metrolinx enforces silence as a condition of their contract. Commissioner Josh Matlow attempted a line of questions early in the meeting, but was shut down on this by Chair Jamaal Myers as the issue would be debated later in camera.
Global News recently reported that the TTC and Metrolinx did not agree on a planned opening date for Line 5 Eglinton. Metrolinx wanted December 28 and the TTC wanted February 8 as there were “still issues to be ironed out”. In the end the TTC prevailed, but the gravity of the meeting was clear from the presence of the Mayor, Premier and Minister of Transportation. This was no ordinary staff gathering. Attempts by Commissioner Matlow to elicit any information about discussions with Metrolinx were shut down by the Chair.
All the same, two motions regarding transit priority were proposed, amended and adopted, and discussion of them revealed details on the Finch and Eglinton projects. They also revealed many errors in understanding by some board members, TTC and City officials. This does not bode well for a frank, well-informed discussion of what might be done to improve Finch and other lines.
From the moment Line 6 opened in a magisterial whoosh of grandeur, well, maybe not exactly a whoosh, the issue of its glacial operating speed has fuelled many debates in social media.
One comparison that is always made is between the “LRT” and subway speeds. Yes, the LRT has closer stops, it has to deal with traffic signals, errant motorists and pedestrians, but it gives a new meaning to “glacial”. The downtown streetcar lines are in the same ballpark, and some of them best the brand new “LRT”.
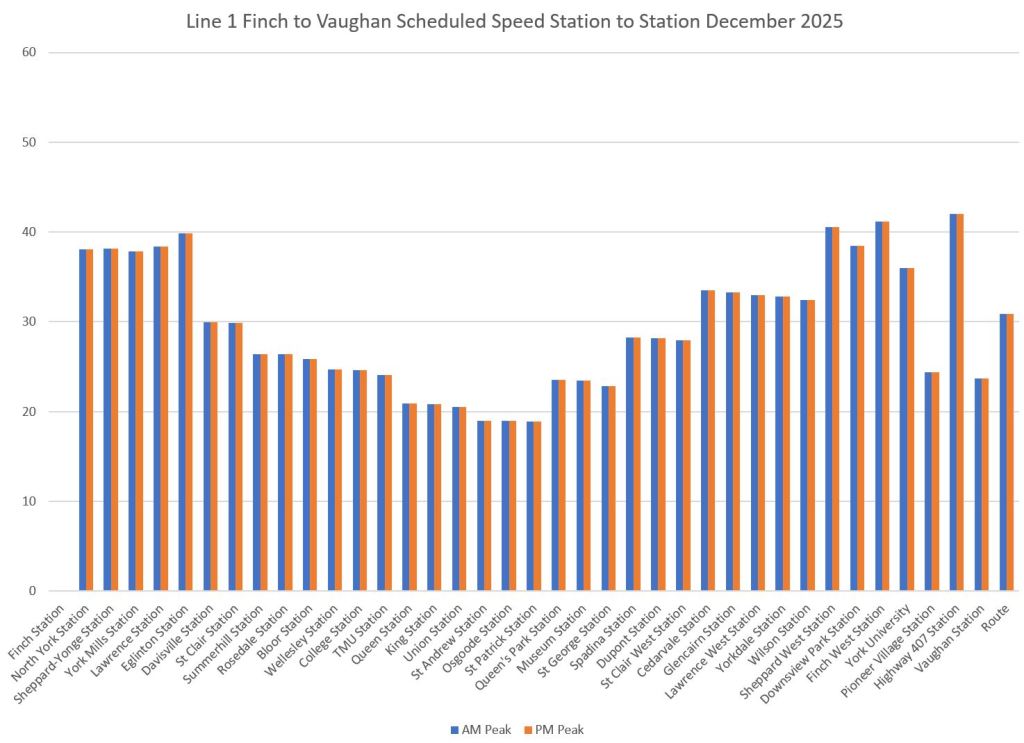
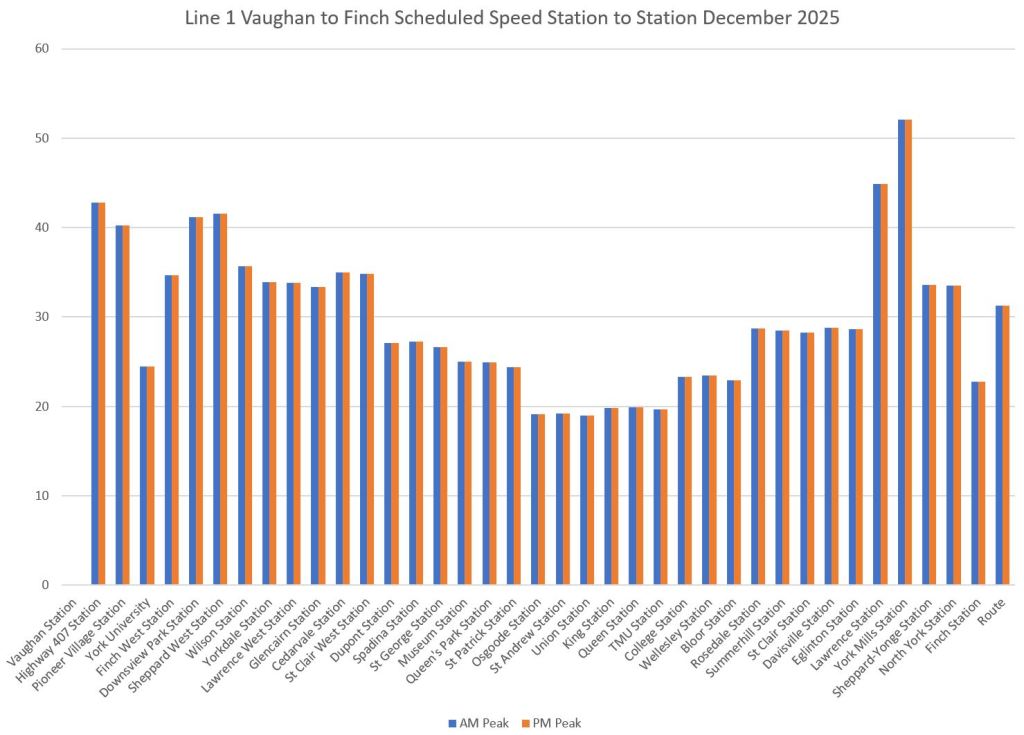
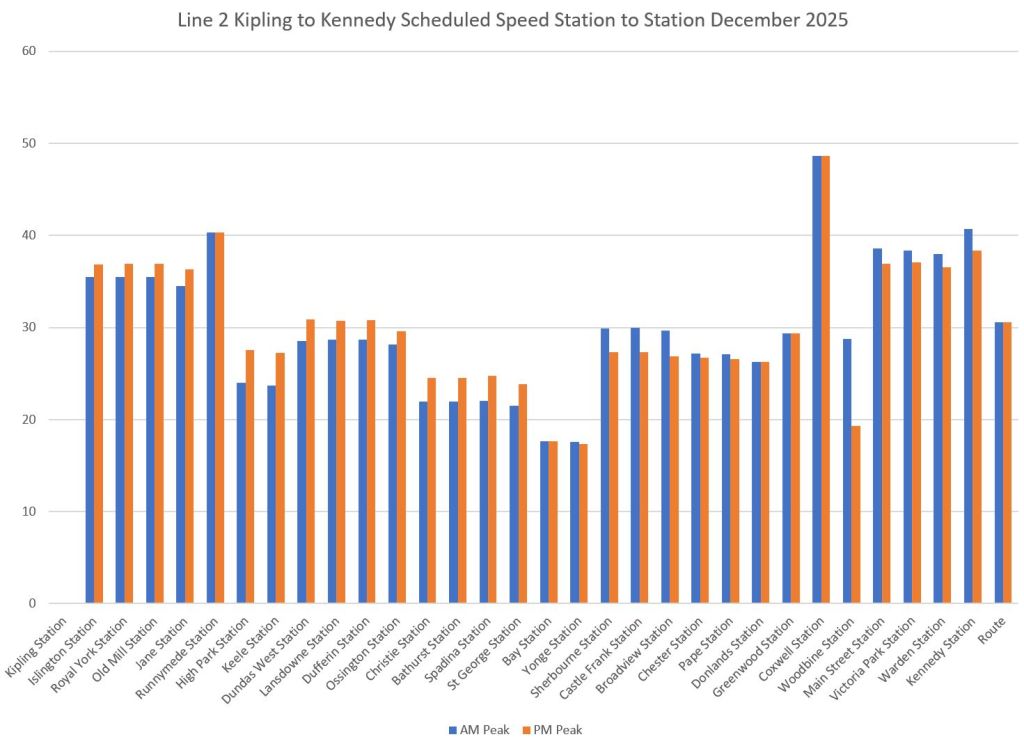
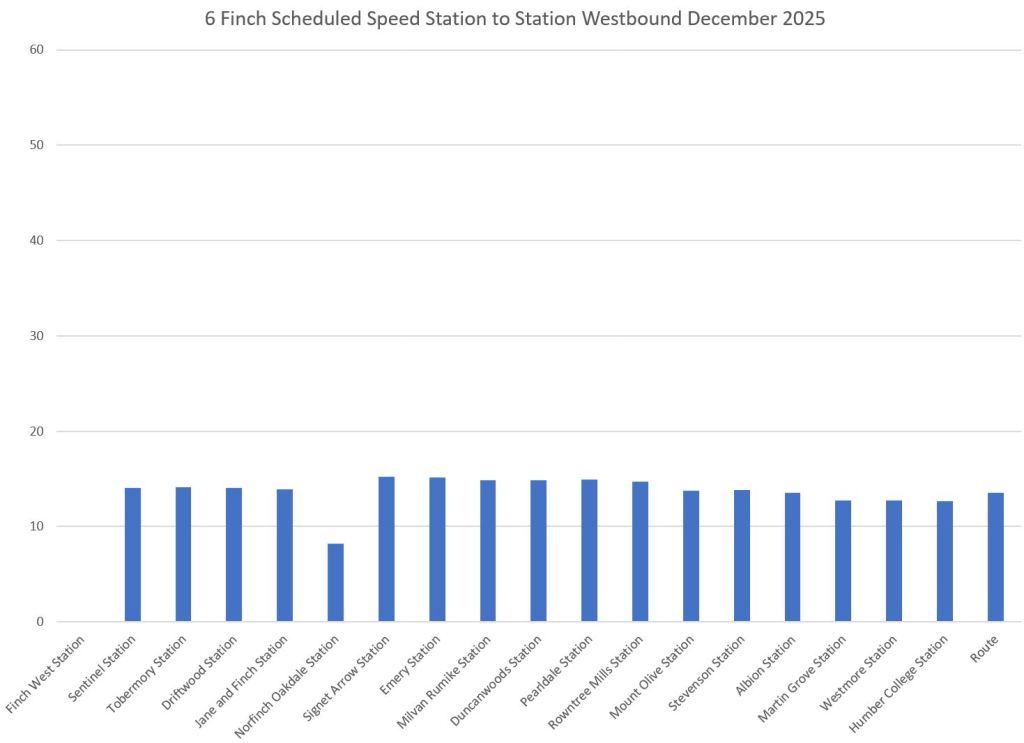
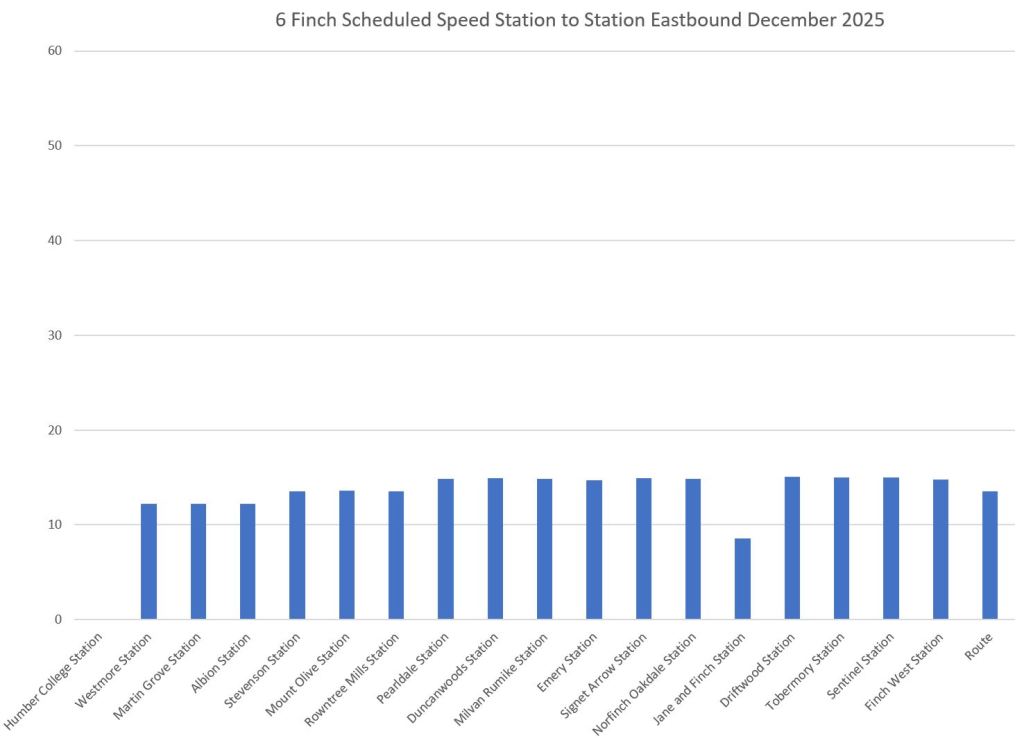
There are many factors at work which I will leave for another day. This post is intended to provide info on the scheduled travel speeds of the two major subway lines and the new 6 Finch West.
The data are taken from the GTFS version of schedules used by trip planning apps. They do not match the actual speeds, but give a sense of what the TTC expects these to be, in general, for trains running “on time”. (The GTFS data includes times and spacing for every stop from which the scheduled speed can be calculated easily.)
In the charts for Lines 1 and 2 (Yonge-University and Bloor-Danforth), data are shown for both the AM and PM peaks. For Line 6 Finch, only one set of data is shown because the TTC has used a generic all-day schedule for the initial service.
The vertical scale is set at 60 km/hr for all charts. The average values for each set of data are at the right end of each chart labelled “Route”.
It is self-evident that subway speeds will be higher for many reasons including stop spacing and the fact that trains both accelerate to and run at higher speeds. However, the LRT speeds are embarrassingly slow. Riding the line even on a trip that makes its scheduled time, the car crawls across the route.
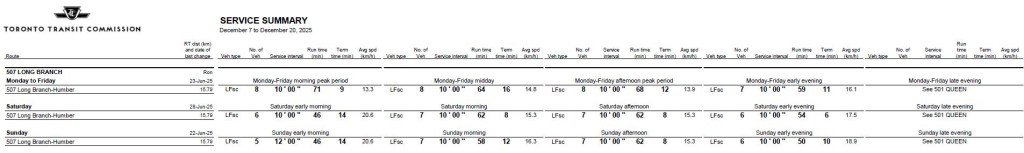
As a matter of comparison, the 512 St. Clair car is only slightly slower than 6 Finch and at times faster. The 507 Long Branch running on Lake Shore Boulevard in Etobicoke is consistently faster than 6 Finch.