According to a bulletin from the TTC’s Safety and Environment Department, effective May 24, 2026 some speed restrictions that hobble streetcar operations will be dropped.
At crosswalks and signalized intersections, streetcars are now restricted to entering at 25 km/h. This will change so that cars can operate at up to the posted speed limit.
The 10 km/h speed restriction at intersections on The Queensway will be removed, and cars can operate up to the posted speed limit.
Intersections with special work, or with other explicit restrictions, continue to be subject to slow orders.
Notwithstanding these changes, Operators are expected to drive defensively and adapt to road and weather conditions.
This is a first step in attempting to speed up streetcar routes, but the limits at special work (switches, crossings) remain in place. This will not change, if at all, without a thorough review of factors contributing to that long-standing policy including:
Reliability of electric switch controllers,
Benefits of double-blade switches for Flexity streetcar movement through turns, and
Signaling to provide a positive indication for operators that switches are set and locked to the desired route.
That study is underway, but we are unlikely to see major changes quickly especially if replacement of existing track and controllers is needed. Related issues include:
The number of manually operated switches at locations where streetcars regularly turn for diversions and short turns, and
The degree, if any, of aggressive transit signal priority provided at existing and future switch locations.
Removal of speed restrictions related to trolley pole operation notably at low underpasses.
It is not clear why there is a delay of over three weeks for this change to take effect, but it will be in place before the World Cup games.
TTC Plans for service to the six World Cup games to be played in Toronto, as well as to the nearby Fan Fest area, were covered in a presentation deck in a recent TTC Board agenda. Because the Board had been rather chatty on previous items, this one was not presented although there was a media scrum afterward.
The plan for transportation to the venues depends on a combination of routes. However, the description of the service varies between the presentation deck and info on the TTC’s World Cup web page.
On the left, the presentation clearly shows the 63 Ossington bus as a World Cup route, but it is missing on the web page.
According to the web page, there will be “expanded service” on subway lines 1 and 2, and “enhanced sevice” on 29/929 Dufferin. Service on 504 King, 509 Harbourfront and 511 Bathurst will run every 5 minutes all day on game days.
Because the 509 and 511 streetcars merge at Bathurst and Fleet, this will mean a 2’30” combined service to Exhibition Loop. That is substantial by current TTC streetcar standards, but it will only provide 24 cars per hour with a capacity of 3,600 riders, generously allowing for 150 per car. The stress on service will be stronger after games when many fans want to leave in a short period. Whether the combined streetcar, bus and GO train service will be able to handle this remains to be seen.
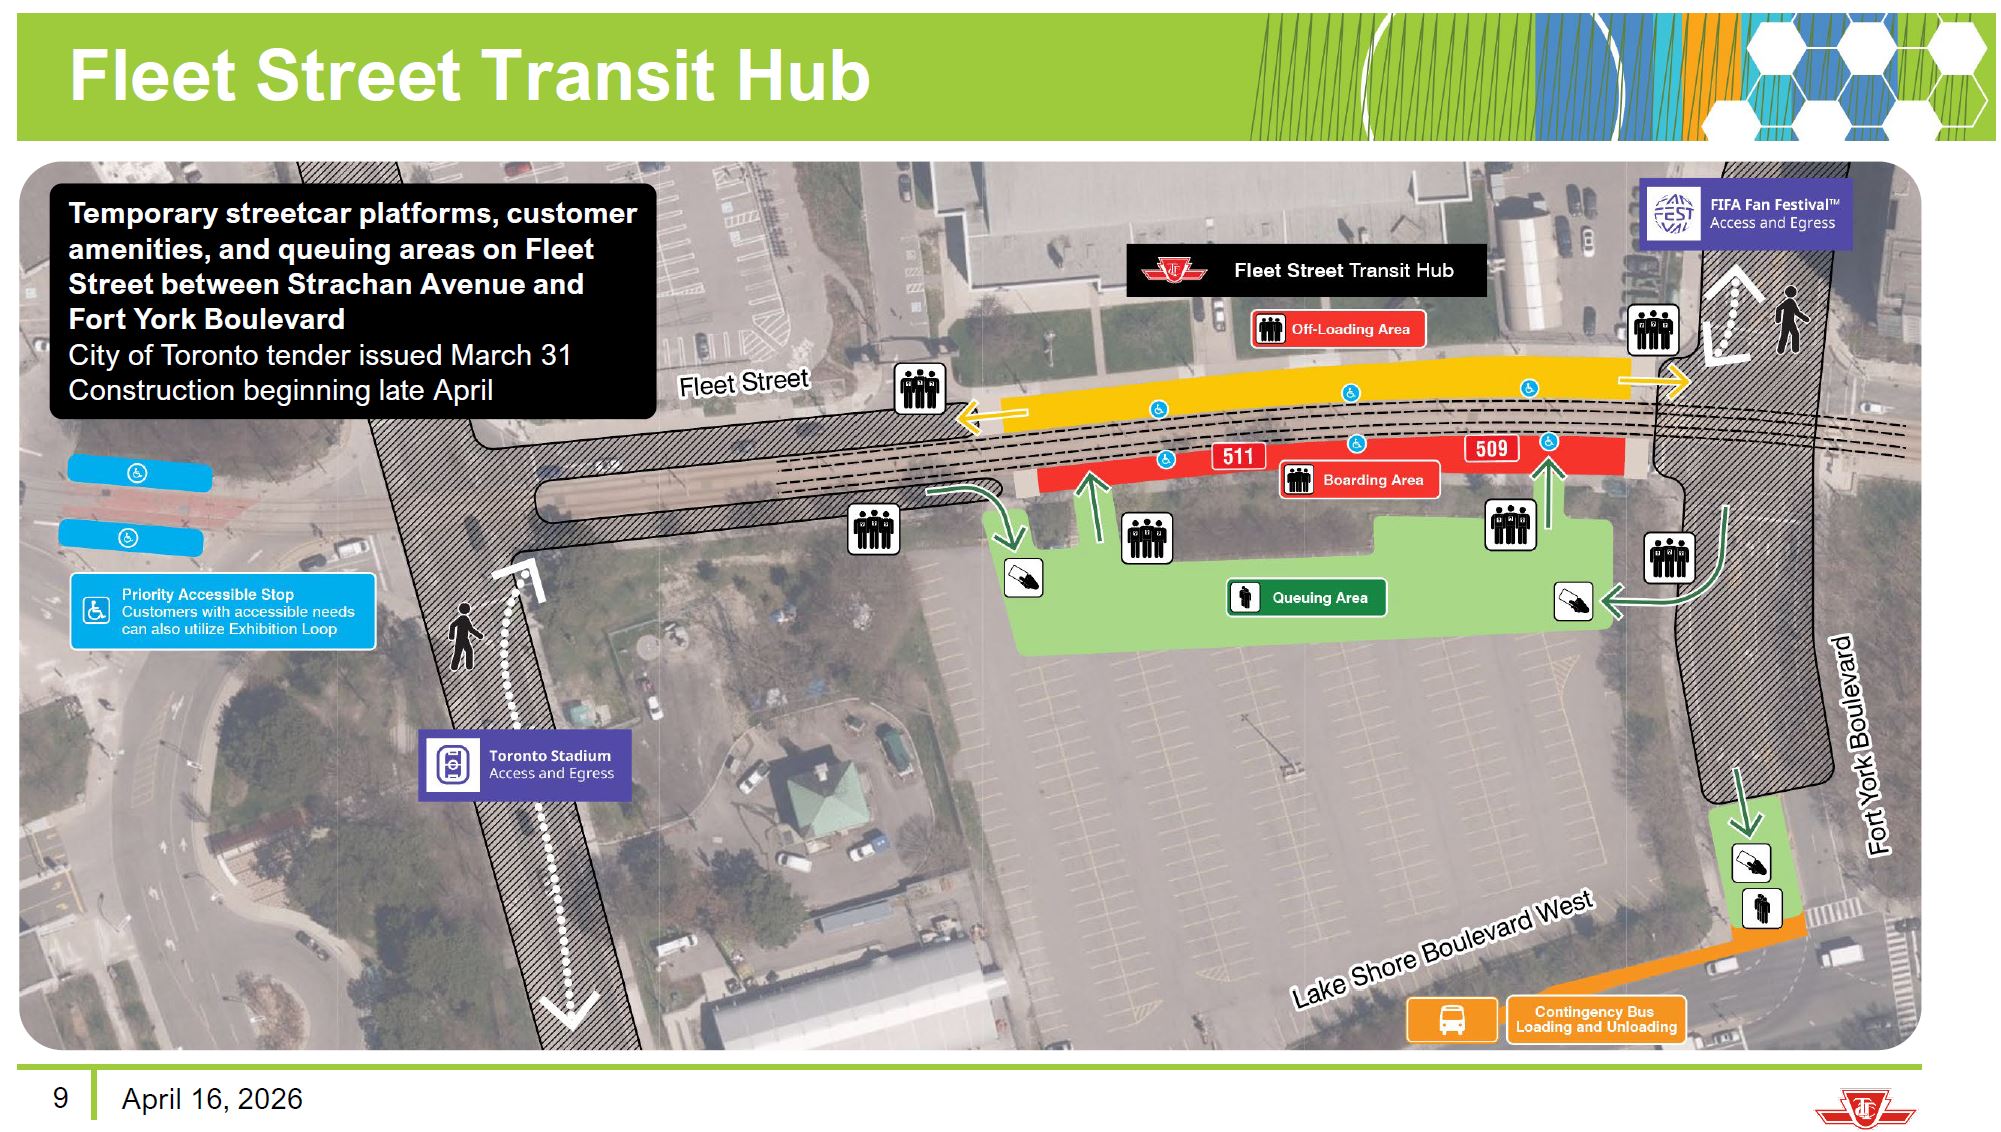
Note the planned access routes to the queuing area on Fleet Street includes fare payment points. This will allow the loading to occur from a fare paid zone without the delay of on board taps, and without the need for fare enforcement in a congested area. This is also shown for access to a contingency bus area at Fort York and Lake Shore, and it is reasonable to assume the same approach will be used at Dufferin Loop.
Aggressive transit priority measures will be needed to keep streets clear. Toronto does not have a good history in restricting motorists to leave the streets for transit service, and the affected areas are not just the downtown business district but residential streets.
Both Bathurst and Dufferin Streets will, by the time of the matches, have RapidTO red lanes south from Bloor. Early plans for Bathurst called for express streetcars and local bus service, but that scheme has been dropped.
I asked Josh Colle, TTC’s Chief Strategy and Customer Experience Officer, about this, and here is his reply:
Earlier iterations of our conceptual service plan envisioned removing intermediate stops along 511 Bathurst to increase the speed of travel along the corridor during the World Cup. Bus service would be provided to serve all existing stops.
With the expected travel time improvements from RapidTO, the implementation of 6-minute or better service, and further service increases during the World Cup period, the express streetcar concept was abandoned. There were also concerns about buses operating in the dedicated lanes and needing to merge in and out of potentially congested curb lanes to serve curbside stops.
This was originally seen as an opportunity to pilot a stop removal program for streetcar while operating a local bus service. However, given the recent priority to improving streetcar operations through other initiatives, our focus remains providing the best service for all customers during the World Cup period.
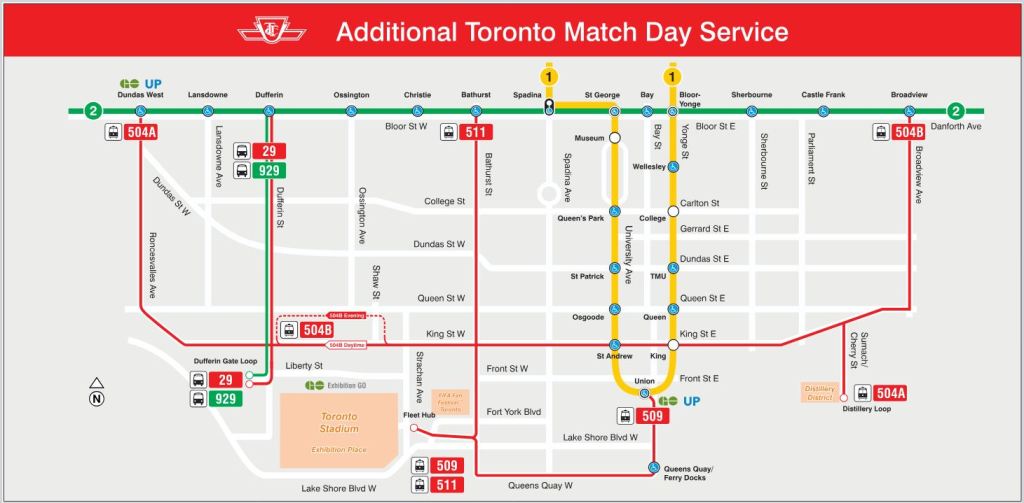
The TTC intends to provide Blue Night service as shown on the map below beyond the usual level.
Things do go wrong, inevitably, and here are the TTC’s preparations:
Service delivery and performance:
Supplementary supervisors in stations, on-street, and at key locations
Additional standby and change-off vehicles on all modes
Enhanced station staff, customer service and ambassadors
Real-time system oversight and coordinated decision making
Infrastructure readiness:
Streetcar switch duty operators at critical points
Extra janitorial and vehicle cleaning crews
Additional line mechanics, elevator, overhead, subway, signal, and track crews
Standby streetcar support and service trucks
Emergency safety:
Added security personnel on match days
Toronto Police paid duty officers EMS at key locations
Coordinated approach with Station staff, Transit Control and Special Constables
Continued access to social supports and resources through partnerships
This is substantially more than we see for day-to-day operations, and there may be some lessons to be learned about the level of supervisory and support services needed to handle major events and their demand.
(The reference to switch duty operators is a tad embarrassing considering that the planned streetcar routes do not involve any manual switches, and this does not show great confidence in their existing technology.)
There will be “testing exercises” although the exact scale of these is not yet known.
Finally there are plans for enhanced and visible safety and security with the use of Special Constables, Fare Inspectors (Provincial Offenses Officers) and contract security staff. Ideally, as many riders as possible will pass through fare controls at some point in their journey and extensive fare checks on board will not be needed. More important will be visibility of staff who can intervene, if only to report issues and act as a visible deterrent.
Management will bring an updated plan to the June 3 Board meeting.
In response to the “Toronto has the world’s slowest streetcars” meme floating around on line and among some transit advocates, various proposals were floated to speed up our system.
One of these is the idea that there are too many streetcar stops, and if only cars didn’t pause so often for passengers, we could have faster streetcar service. The TTC’s euphemism for this is “stop balancing”.
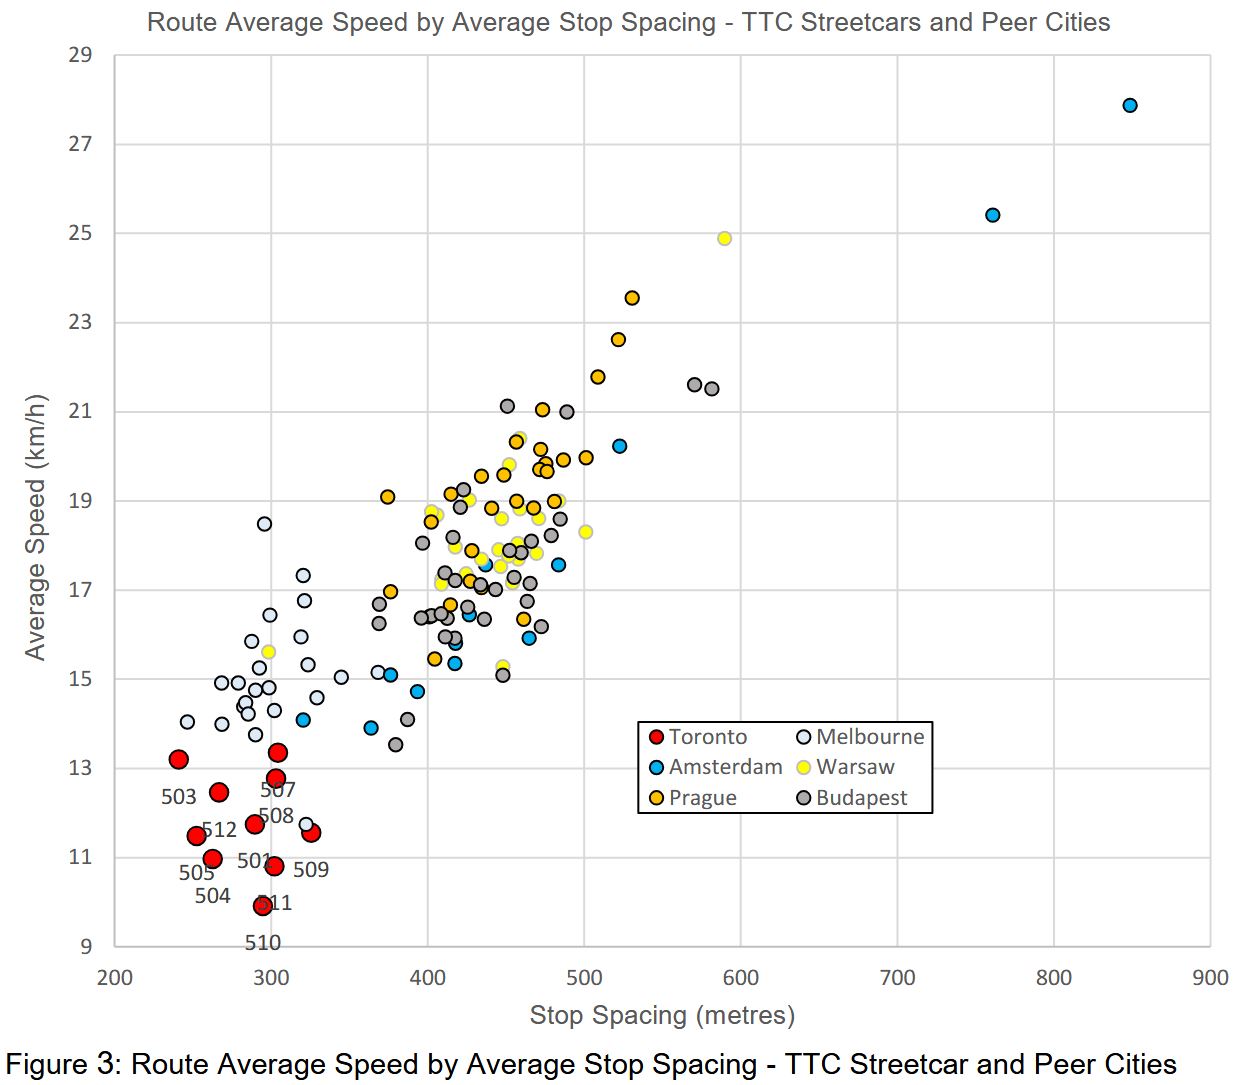
A chart accompanying the TTC report shows the speed and stop spacing values for several transit systems. Toronto is down in the left bottom corner with the closes stops and the slowest speed. However, Melbourne’s trams are in the same range as Toronto for stop spacing, but they operate faster. Nowhere does the TTC examine what differences might apply to Melbourne lines, nor for the other systems that are both faster and with wider stop spacing.
Although there are some outliers, the bulk of the data points are in the 400-500m range, but this does not examine route characteristics. The original study of slow Melbourne streetcars by Dr. Jan Scheurer commented about Toronto that “CBD-typical speeds seem to extend across the entire city” [p. 8]. Riders who sit in traffic jams on King or Queen Street West, or on Queen Street in the Beach are quite familiar with this problem. Toronto streetcars do not emerge from the core to fly into nearby suburbs.
There is also the issue that Toronto streetcars used to move faster both with the CLRV fleet and the PCCs that preceded them. Something beyond stop spacing is at work even on routes with dedicates rights-of-way. It is easy to go after stops as a source of delay because this would not require an examination of TTC operating practices and the City’s lack of aggressive transit signal priority. Indeed, during the last round of major works on St. Clair, it was discovered that TSP was not actually working in many locations.
Source: TTC
For the sake of argument, assume that the delays to TTC streetcars come from closely spaced stops. Any rider knows that there are other factors including slow operation through junctions, traffic signals that do not give streetcars priority and congestion both in the core and the outer parts of many routes.
The premise is that fewer stops will speed service benefiting those already on streetcars at the expense of those who have to walk further to a stop. This is a bogus argument regardless of stop spacing. There will almost always be more riders passing any individual stop who would “benefit” from its elimination than riders who use the stop. The same argument could be made for some subway stations.
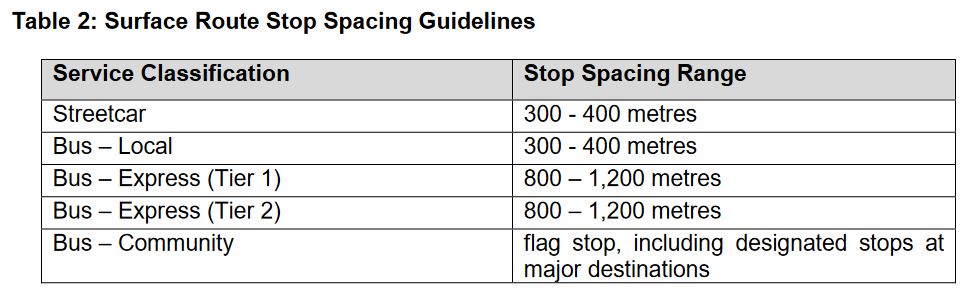
Here are the TTC’s Board-approved stop spacing standards. The target range of 300-400m for local surface routes implies an average stop spacing of 350m giving some leeway to adjust to conditions.
(To give readers a sense of distance, a subway station platform is about 150m long, and so a 300m walk is from one end of a station platform to the other and return.)
Streetcar route averages lie roughly in the 250m-325m range below the standard’s midpoint of 350m. Some stop trimming has already occurred to eliminate very closely spaced stops.
Note that 508 Lake Shore shows the same average as 507 Long Branch even though the 508 travels into the core. The reason is that the stop spacing between Humber Loop and Roncesvalles is quite wide, and this offsets the closer spacing on King Street in the average.
Route
Termini
Stop Spacing (m)
501 Queen
Neville-Roncesvalles (*)
241
Roncesvalles-Humber
448
503 Kingston Road
Victoria Park-York
284
504 King
Dundas West Stn-Distillery (*)
283
Dufferin Loop-Broadview Stn (*)
280
505 Dundas
Dundas West Stn-Broadview Stn (*)
278
506 Carlton
High Park-Main Station (*)
260
507 Long Branch
Long Branch Loop-Humber Loop
312
508 Lake Shore
Long Branch Loop-Distillery
306
509 Harbourfront
Exhibition-Union Station
373
510 Spadina
Spadina Station-Queens Quay
293
511 Bathurst
Bathurst Station-Exhibition Loop
328
512 St. Clair
Gunns Loop-St. Clair Station
270
Source: Calculated from TTC GTFS Schedule Data
Notes:
501 Queen stop data are taken from the pre-Ontario Line construction with service running directly across Queen from Church to York.
Stops near Dundas West and Broadview Stations that are used primarily by overnight services have not been included in the stop counts for 504 King and 505 Dundas.
506 Carlton stop data are taken from the through route before construction diversion around Bay & College.
Some Basic Math
If one wants to achieve a major saving from stop time, many stops have to be cut on a route. One or two will annoy their regular users, but the change in travel time, if any, will be quite small and disappear into the background noise of other variations.
The basic calculation is simple: if a route now has an average spacing of 300m, and you want to raise this to 400m, then one quarter of the stops must vanish. The bigger the change in stop spacing, the more stops must be eliminated.
The numbers of stops for various spacings per 1km are shown below:
250m: 4.0
300m: 3.3
350m: 2.9
400m: 2.5
450m: 2.2
500m: 2.0
With the TTC standard of 300-400m, 350m falls half way along, or 2.9 stops/km. Just to bring routes now at a 250m spacing (4.0/km) to that level would require a reduction of about 1.1 stop/km, or about 12 stops each way on a route the length of 505 Dundas (11km).
If the goal is to move to a 400-500m standard, this means the new target average would be 450m. A route whose average is now 250m would lose almost half its stops. This would be extremely difficult as routes do not have that many “unimportant” closely-space stops to begin with.
The effect would not be on a few riders at a few minor stops, but on many riders all along the routes. They would face extra walking distance lengthening overall travel times, not to mention accessibility issues for those with mobility challenges.
A simple, but important, number is not the space between adjacent stops, but the space that would result if any stop were removed. (In other words, the space between stop N and stop N±2.) In some cases, the existing TTC standard would still be met, but in many the gap between stops would be well outside the standard. For example, if three stops are each 300m apart, getting rid of the middle one creates a 600m gap, well above the standard.
Stops cannot simply be re-spaced to maintain uniformity or iron out problems with stop elimination. For pedestrian safety, stops are almost always at signaled intersections or at least at pedestrian crosswalks so that riders can cross safely to/from stops on the opposite side of the street. The existing street layout, signal patterns and major destinations such as transfer points determine where stops might go. Toronto, unlike Manhattan, does not have a repeating grid as a base for designing standards.
In the sections that follow, I will turn to a few sample routes. There are occasional closely-spaced stops, some with good reason, but not many are ripe for plucking without adopting a considerable increase in the standard and substantial cut to the number of stops. This should be a conscious policy debate, not a change buried in a wider review of Service Standards without a clear indication of the effects on routes across the city.
The TTC Board agenda for its April 16 meeting includes a pair of reports giving the year-end status for the Operating and Capital budgets, as well as a detailed update on major capital projects.
In this article, I will review the status of major projects to summarize info for readers. In a separate article, I will turn to the 2025 operating results. Those wishing more detail should refer to the full reports.
An important factor with many projects is that they are multi-year efforts, and some of them are not fully funded. This has different implications for various types of projects such as:
A project might still not have full funding, but a portion can proceed with the hope of additional moneys appearing along the way.
A project might have stages, but only be funded for some of them. A new vehicle purchases might have money for part of an order, but not for a sustained rollout.
Projects could be interrelated in that full exploitation of benefits cannot be achieved without completion of both. For example, a new Automatic Train Control cannot work without a fleet that can “talk” to the new signal system. Larger fleets cannot be accommodated without new storage and maintenance facilities.
Although these are large and in some cases quite expensive projects, this is not an exhaustive list. Some parts of TTC State Of Good Repair budget involve areas with many smaller projects (for example, building and structures maintenance) that are quite large in the aggregate. Vehicle overhaul is an ongoing cost, but it is not listed as a “major project” because it is routine work. These items do not appear in the Major Projects report although they comprise a large portion of the capital budget.
The projects discussed here are:
Subway Work Car Fleet and Maintenance
Station Easier Access, Second Exits and Fire Ventilation
New Subway Cars for Lines 1 and 2
ATC Signals for Line 2
Rogers 5G Rollout
Capacity Enhancements for Lines 1 and 2
Bloor-Yonge Capacity
Scarborough Busway Project
New Buses for Conventional and Wheel-Trans Service
Updated April 13 at 10pm: Comments added about line management practices.
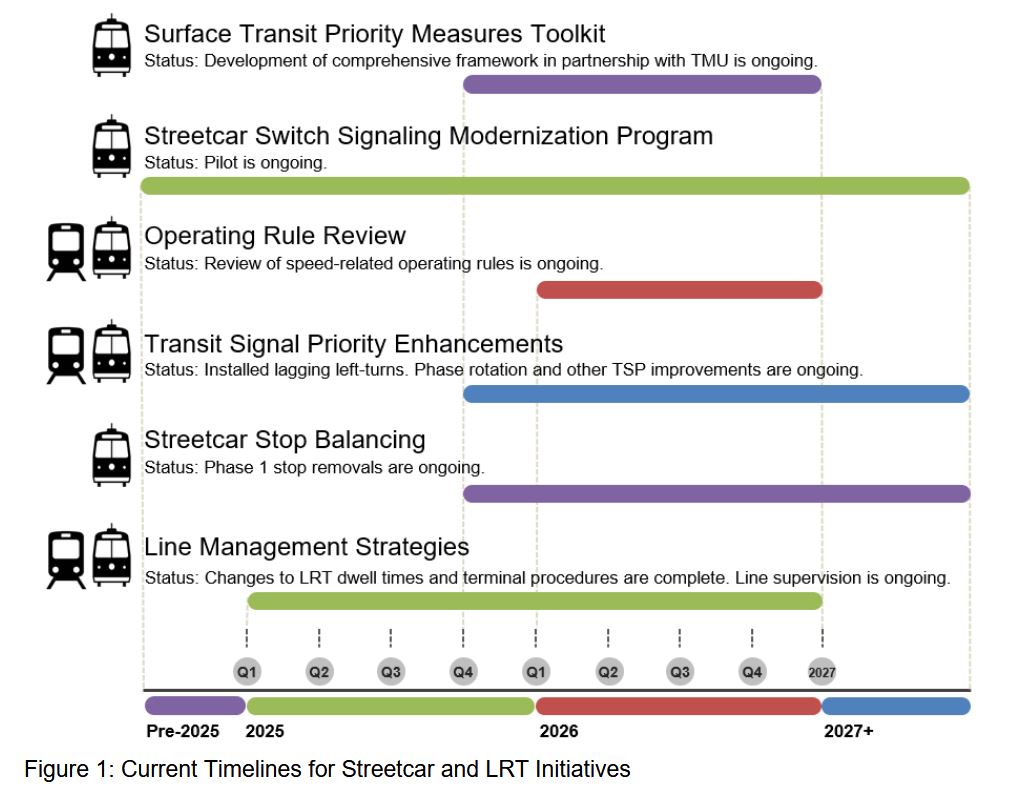
Various tactics are proposed including priority measures and a review of operating practices that can hobble streetcar service. A problem with some of the analysis is a poor or forgotten history of how current arrangements evolved. In some cases, there is a confusion of cause and effect, of equating co-incidence with causality. Some potential solutions have extremely long lead times that will doom riders to slow operation for years if not decades.
A thread running through some issues is slow operation at junctions where streetcar tracks diverge and cross. TTC has a lot of these thanks to its network descending from a dense grid of streetcar lines over a century old. Recently, operating practices from this “legacy” system were exported to the new LRT lines 5 Eglinton and 6 Finch giving these routes, and the technology generally, a black eye. The bad reputation is so severe that new “LRT” proposals face stiff criticism and outright “we told you so” hostility.
The blame for this rests squarely with TTC, Toronto Transportation Services, and Metrolinx who collectively accepted a much-diluted version of “priority” compared to what was promised during project development. This has been partly remedied, but should never have been allowed in the first place. Imagine if a new subway line opened with permanent slow orders. This would have been laughable and unacceptable, but for a “streetcar line”, it’s just fine.
Six areas are proposed for review on the timelines shown below. The troubling part of the chart is the section labelled “2027+” which reaches into the indefinite future.
On April 7 and 10 two major outages on Line 2 Bloor-Danforth were caused by hydraulic fluid spills from work cars. The TTC has sidelined its entire fleet of work cars pending inspection and repair. This has placed much subway infrastructure work on hold at a time when there is already a backlog.
A previous leak incident in 2024 led to TTC Board reports, and the findings were not impressive. Some work cars were beyond their useful lives, and there were ongoing issues with inspection and maintenance of equipment.
A common thread in these delays has been a car leaking fluid onto the rails over an extended distance before this problem is discovered. That leads to extensive, manual cleanup work to ensure that revenue service trains can accelerate and brake without slipping.
Problems with these cars are not the only source of major disruptions, and failing signal systems requiring service suspensions are common.
The TTC has not published a list of signal failure incidents to give a sense of their frequency and severity, let alone any plan to improve reliability over the decade before a new ATC system can take over.
It is rather comical that TTC Board meetings can include extensive discussion of a new enterprise asset management system, but little info on actual condition, maintenance and plans for what we have. We should not have to wait for a large IT project to know what the issues are today.
Behind both the fleet and signals problems lie bad capital budget planning by TTC management in response to political pressure to trim spending. In past years, key interrelated projects were downplayed or sidelined including:
The need to refresh and expand the subway work car fleet
The need to convert Line 2 to Automatic Train Control
The need for a new Line 2 fleet
Under former CEO Rick Leary, in his early days, there was a sense that existing infrastructure and fleet could be stretched out to about 2040, fully ten years longer than the then-current target of 2030. In time, the ATC and new trains projects were restarted, but with much later delivery dates. According to the December 31, 2025 Major Projects Update Report, the delivery of 55 new trains will not complete until 2035, and the final cutover of ATC will not occur until 2037. Existing systems will have to last another decade.
Another factor is the timing of the Scarborough and North Yonge subway extensions which are planned to open in the early 2030s and will need new trains before the existing Line 2 fleet is retired. This is further complicated by demand projections showing the need for growth trains in the mid 2030s. Trains for new lines and extra service require production capacity that would otherwise go to a replacement fleet.
With ATC for Line 2 a decade away, the Scarborough extension will have to be built with conventional signals to tide it over until an ATC-capable fleet is running.
The TTC has not published a fleet plan showing how the various proposed deliveries of new trains will be staged. There is also the small matter of storage and maintenance space for the expanded fleets, and projects for new yards are not yet funded. The Province is happy to announce new subway lines, but conveniently omits the very large cost of the maintenance facilities.
This ties back to the work car reliability and fleet size issues because the volume of subway work will not decline, but will actually increase both thanks to aging infrastructure and system expansion. There are already severe scheduling problems for the work plans due to conflicting requirements for this fleet.
The focus at an upcoming TTC Board meeting will no doubt be on recent failures, but there are much larger issues affecting subway reliability for the coming decade and more. 2027 might seem a long time (and an election) away, but planning for that budget is already underway. The Board should demand a detailed review and plan to address the situation, and this should not be another “we’ll get back to you next year” report.
Two new lines on Toronto’s transit map suddenly sprang back to life this week with announced funding for the Waterfront East route by the City, Province and Federal governments. Days later, both Mayor Chow and her competitor, Councillor Bradford, came out with competing support for the Eglinton East LRT, now rebranded by Chow as the Scarborough East Rapid Transit, or “SERT”. “LRT” has become a dirty word thanks to the botched implementation on Finch, and a less than steller launch on Eglinton.
I will leave discussion of the details of SERT for another post once there is a better sense of just what technology and infrastructure options are actually on the table.
It’s important to remember that whoever is Mayor after the 2026 elections, there’s a good chance they will not be in office to see SERT, whatever it might be, open for service.
Meanwhile, long-suffering Scarborough transit riders will have only buses to ferry them around. The same can be said for other parts of the city waiting for transit improvements, and large parts of Toronto will never see anything more than a few RapidTO red lanes.
This raises two fundamental issues about TTC service:
How much service should there be on TTC routes, and
How much can crowding and convenience issues be addressed with existing services?
TTC Service Standards set out crowding levels for various types of vehicle, service and periods of operation.
Although the TTC reports that overall ridership has not returned to 2019 levels, they also acknowledge that some routes are crowded beyond the standards. They do not list specifics of routes and time periods, and so it is hard to know the scope of the problem or the affected locations.
This situation is not corrected thanks to budget limitations. The TTC owns buses and streetcars, but they cannot afford to run all of them.
From a rider’s point of view there is more to service quality than the number of buses on the road. These vehicles should also show up reliably so that loads are evenly distributed between them, and wait times are predictable. TTC loves to blame all problems on traffic congestion, but a fundamental issue is that service does not run on even spacing, and little is done to improve this. One difficulty is the acceptance in standards of being off schedule up to 5 minutes, and this only applies leaving a terminus. This allows buses to run together on frequent routes and still be “on time” while giving poorer service than advertised.
Back in the early days of debates on a Scarborough LRT or subway replacement for the former Line 3 SRT, important research from UofT showed that in the off-peak period, the majority of trips in Scarborough stay in Scarborough. A transit network designed to get people downtown does not necessarily address local travel unless it happens to lie along well-used commuter routes. Such a network can also miss travel patterns to and from major suburban work and academic locations both inside Toronto and in the 905 beyond. Off-peak service is important, but it must be more than a line on the map representing a bus that will appear sometime, maybe.
Later in this article, I will detail service frequency on routes across Toronto. In some quarters it is common to say “Scarborough gets the dregs”, but in fact the problem of infrequent and irregular service extends well beyond Scarborough borders. If there is to be advocacy for better transit, this will be more productive with all affected neighbourhoods.
The view ahead to the 2027 budget is not hopeful. Increased spending on service falls in various categories:
Inflationary and cost-of-living effects
Service added to address growth
Service hours added to address congestion
Service added to promote growth
The budget focus is on the first three, and growth for its own sake gets little attention. The TTC might produce a ridership growth strategy, but it will not affect the 2027 budget.
There has been no discussion of the level of service possible with existing infrastructure and fleet, as opposed to changes that would require more vehicles and, possibly, more garage space. Any added service will, of course, require more operators to drive it and that drives up the budget and subsidy requirement.
TTC planning in recent years focused on making changes within existing financial resources, and the funding shortfall to improve service overall is never presented for public debate. Meanwhile, the politicians do not want to talk about anything that would increase operating costs and lead inevitably to proposals for new revenues including fares and subsidies.
Better service both in quantity and quality is key to the TTC’s growth. Drawing lines on maps keeps the announcement machinery turning and fuels endless social media debates, but it does nothing for service today.
Any politician or advocate claiming to serve their community needs to address service and how it can be improved to serve everyone now, not just in the decade to come.
Work on this article began before the March 30 announcement of tripartite funding for various housing and transit projects. Comments about this have been incorporated here.
At its meeting of March 31, the TTC’s Strategic Planning Committee will consider two reports relating to the financial future of both the Operating and Capital budgets.
The report on a long-term plan is less than its title might suggest in that it merely launches a process to develop a plan, but does not propose anything concrete. Some members of the TTC Board have wanted to see a long-term plan and options for years, but nothing usually comes of this beyond rehashing information we already know from the annual budget cycle. City Council cannot formulate capital and operating budget plans without a clear indication of the needs and trends at its most expensive agency.
A related problem is that conflicting indications come from the Council and the Mayor about spending priorities, and some TTC plans are closely linked to Provincial projects such as the North Yonge subway extension. Major committed projects have already claimed much of the announced Federal funding, and substantial additions will require net new funding.
That, in turn, requires the TTC and Council to think carefully about priorities rather than asking for money project-to-project on the assumption that money will always be available. In the context of high Provincial debt and considerable spending on transit, plus a refocus of Federal priorities and an attempt to decrease spending, Toronto is unlikely to receive everything it wants.
Short-Term Planning
Short-term planning placed the TTC in a very difficult position.
The short-term balancing of the TTC’s financial pressures would not have been achieved without a substantial City subsidy in recent years, including the Ontario-Toronto New Deal providing three-years of operating funding support, and project specific capital grant funding from the provincial and federal governments.
For instance, the injection of $5.1 billion in the 2025-2034 Capital Plan, which was predominantly city funding, reduced the TTC’s state-of-good-repair backlog by $3.9 billion, or nearly 50%. However, fleet plan changes, asset condition assessments and cost estimate increases have increased the SOGR backlog in the 2026-2035 Capital Plan to a projected $6.1 billion at the end of the 10-year planning window. Funding for new trains, buses and streetcars by other orders of government addressed immediate fleet needs, and the operating support through COVID, have kept the system going. While these efforts had significant impact in the immediate term, the TTC still has a long-term financial problem due to a fiscal framework that has not evolved at the same pace as the scale, complexity, and expectations of a world class transit system.
This cycle of finding immediate term solutions to the budgetary pressures of the organization is one repeated annually. With each successive year the balancing act produces increasingly limited opportunities to find new efficiencies and revenue generation opportunities. The TTC’s aging assets continue to drive state-of good repair investment needs to maintain existing levels of service, while struggling to fund capacity enhancements to keep up with growth. [Long Term Plan, p. 1]
As things stand, the projections for Operating and Capital Budgets assume very modest growth in demand, at least in the short term, but there is a long list of projects, mostly unfunded on the Capital side both for State of Good Repair (SOGR) and to accommodate projected demand growth. Rapid transit extensions now underway only include provision for fleets at the level needed to serve current demand, but not the extra trains to increase capacity nor the maintenance facilities to house the expanded fleets. Drawing lines on maps requires not just tunnel construction, but consideration for how the network will operate and what effect extensions and new lines will have on the existing network’s operations.
With all the focus on a few rapid transit projects, there is the much larger issue of subway and surface fleet renewal, not to mention infrastructure work. Any plan to increase service and ridership substantially places an additional load on the Capital budget not to mention the Operating budget to actually deliver new service.
Fare Revenue Will Not Pay For Capital
Fare revenue from ridership growth did not pay for expansion even when the cost recovery rate was 70%. Now that it is below 50%, the effect of additional service is even more acute. We cannot talk about system expansion and moving more people with transit if we are not prepared to pay for it.
Transit funding in other cities comes from a variety of sources as detailed in the jurisdictional review. Toronto’s problem is that actually levying most of these requires cooperation from senior governments, notably Ontario where new taxes or fees of any kind are not welcome. In at least the medium term, Toronto will have to make do with existing funding schemes while hoping/lobbying for increases.
Options For Ridership Growth
The other side of this dilemma is that Toronto has never been presented with options beyond modest business as usual transit service. We do not know what growth and service quality we might aim for because annual budgets only scrape by to keep the system running.
While ridership growth is essential to long-term sustainability, on it own it is insufficient to close the structural fiscal gap without complementary changes to funding, fare policy and cost structures. As a result, other options and strategies must be identified. Recognizing this, at the January 23, 2026 meeting, the City of Toronto’s Budget Committee directed City staff to work with the TTC to develop a multi-year operating budget that both supports ridership growth and addresses the underlying financial pressures.
Growing ridership and increasing the mode share of public transit trips will require additional levels of investment in both service and capital beyond what is currently projected and may demand consideration of other sources of revenue and/or fundamental changes in policy with respect to how transit is prioritized within the City. [p. 3]
The report proposes that various scenarios be developed for levels of future growth and service. This will inform future budgets, but not immediately. A four-phase program is proposed:
Jurisdictional review of major transit systems: See the attachment linked above.
Scenario development and long-term analysis
Balancing strategies including cost containment, fare policy including enforcement, funding, and capital priorities
Recommendations and implementation roadmap
There is no discussion of the range of options that might be considered, nor is there a proposed date to report back. Obviously major change will not occur overnight, but short-term plans should explore what can be achieved within existing resources (fleet, infrastructure) and at what cost to get more out of resources the TTC already owns. Further out, no rapid transit growth will come online until the early 2030s, but the surface system should not be ignored waiting for new trains to roll into Scarborough, Richmond Hill and Thorncliffe Park.
In parallel there is the TransformTO plan which has a very aggressive target for shifting travel away from cars. It includes a massive increase in transit service that will not be achieved overnight even assuming Council approves this and funding is available. The TTC Board and Council need to make hard decisions about the scope of transit expansion, and not just a few rapid transit lines, they are prepared to undertake.
Once again, Middle-East war has exposed economy to rising fuel prices. What this will do to economic growth and transit demand remains to be seen. Toronto is at least in the position of owning a large, if not entirely adequate, transit network serving a goodly chunk of demand. However, this is historically focused on downtown-oriented trips, with considerably less support for the more numerous trips between suburban areas.
Ontario bears some responsibility here too because for decades GO Transit’s downtown focus worked against better use for inter-regional trips, and support for local and regional bus service has not encouraged large-scale growth. Calls for us to “do something” to relieve the high cost of fuel, such as free transit, ignore the fact that transit simply is not present, or is too small-scale, to support a major shift of auto to transit travel. Moreover, this only addresses the cost of driving where transit is an option, not the much wider question of the wider economic effect of higher fuel costs.
The March 30 Announcement
The Federal, Provincial and Toronto governments announced funding for various transit projects, as well as tax relief for some new housing.
The first important point about this is that it affects only the TTC Capital budget, but provides no new support for transit operations. Moreover, none of this announcement addresses the TTC’s unfunded capital backlog. Note that Waterfront East is not part of the TTC capital plan.
The Federal contribution to several transit projects has been confirmed, but this is not “new money”, only the formalization of previous announcements. These projects are: Ontario Line, Eglinton Crosstown West Extension, Scarborough Subway Extension, Yonge North Subway Extension and Hamilton LRT. These are Metrolinx, not TTC, projects.
In the name of stimulating housing, municipal Development Charges will be reduced with the gap made up by transfers from other governments. This benefits housing prices, but has no effect on transit to the extent that TTC plans include a provision (albeit declining) for DC revenue as a capital funding source. The only change is which pocket the money comes from, tempered by the hope that replacement DC funding will match what might otherwise have been expected.
The Waterfront East transit line will be funded at $3-billion with one third coming from each level of government. Any overruns will be the City’s responsibility. Now that funding is announced, the next stage of design can get underway. Waterfront Toronto expects to reveal staging plans for construction soon to Council and to community stakeholders.
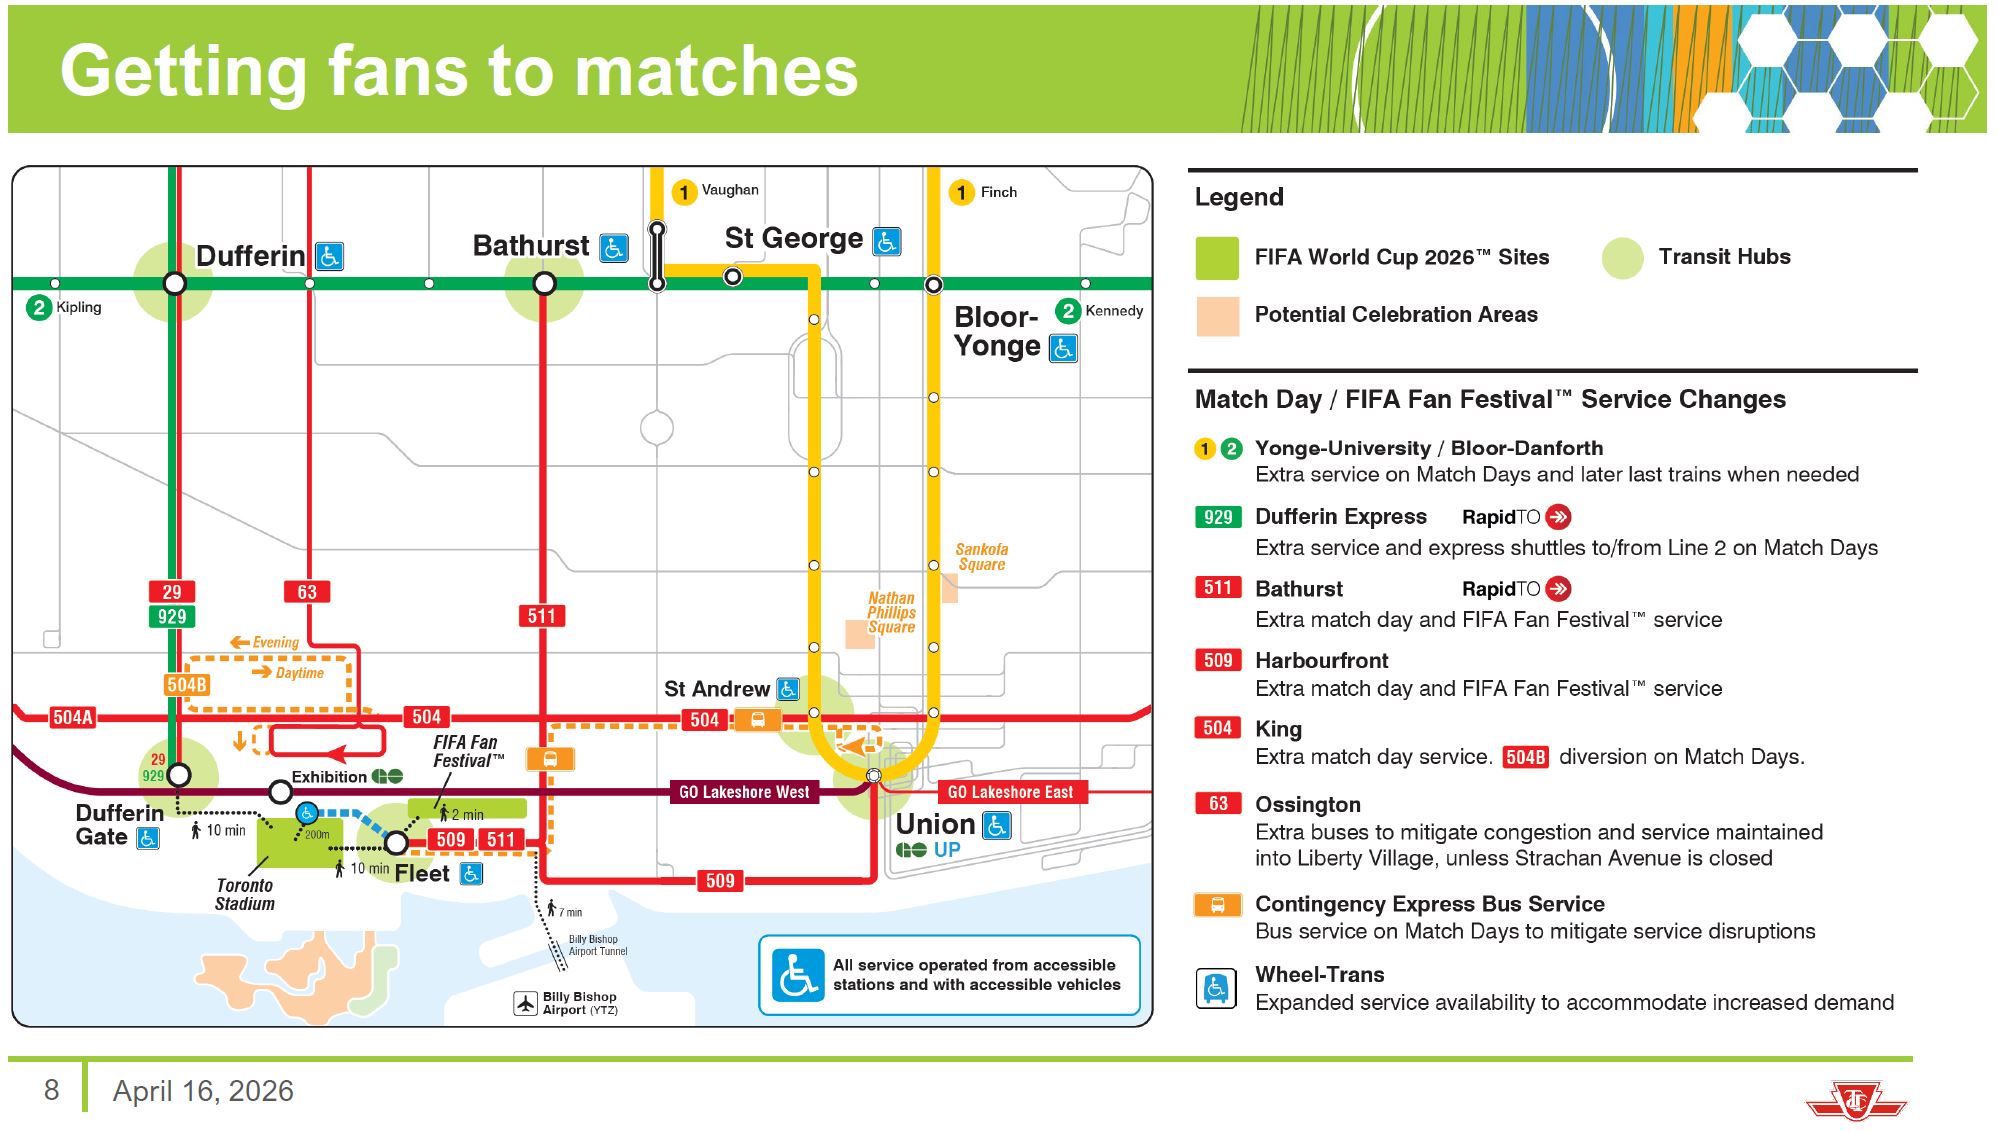
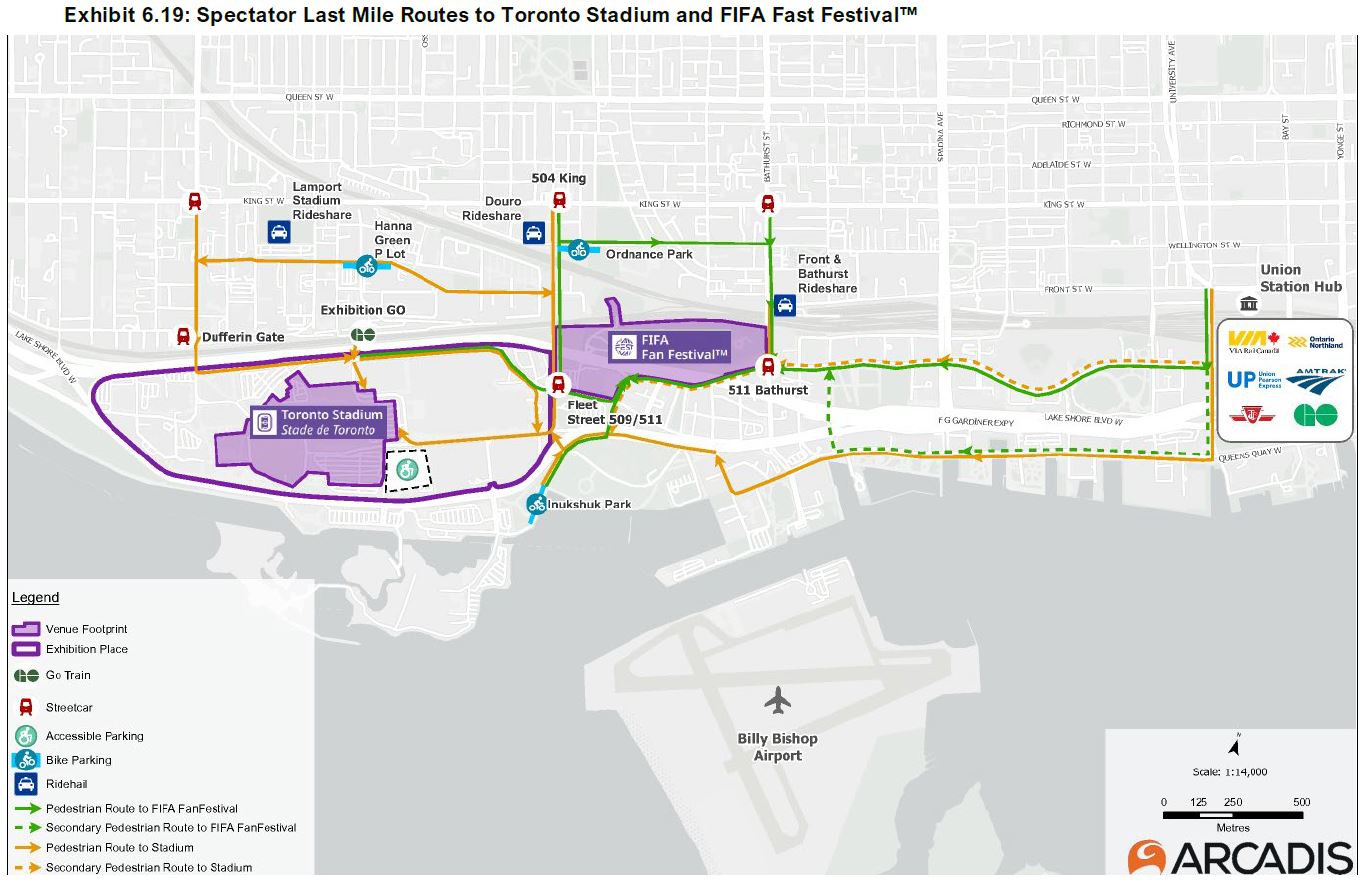
The City of Toronto has released its detailed mobility plan for the coming FIFA World Cup matches in June-July.
The document is over 100 pages long, although some of that is background on the city’s existing transportation infrastructure. In this article, I will primarily review the transit component and leave other topics to interested readers.
The World Cup matches will occur on June 12, 17, 20, 23, 26 and July 2. The June 12 and 26 games kick off at 3:00pm, June 20 at 4:00pm and the other at 7:00pm. From 5 hours before to 3 hours after each game there will be extensive constraints on the area around Exhibition Place, and transit will be the primary mode of access.
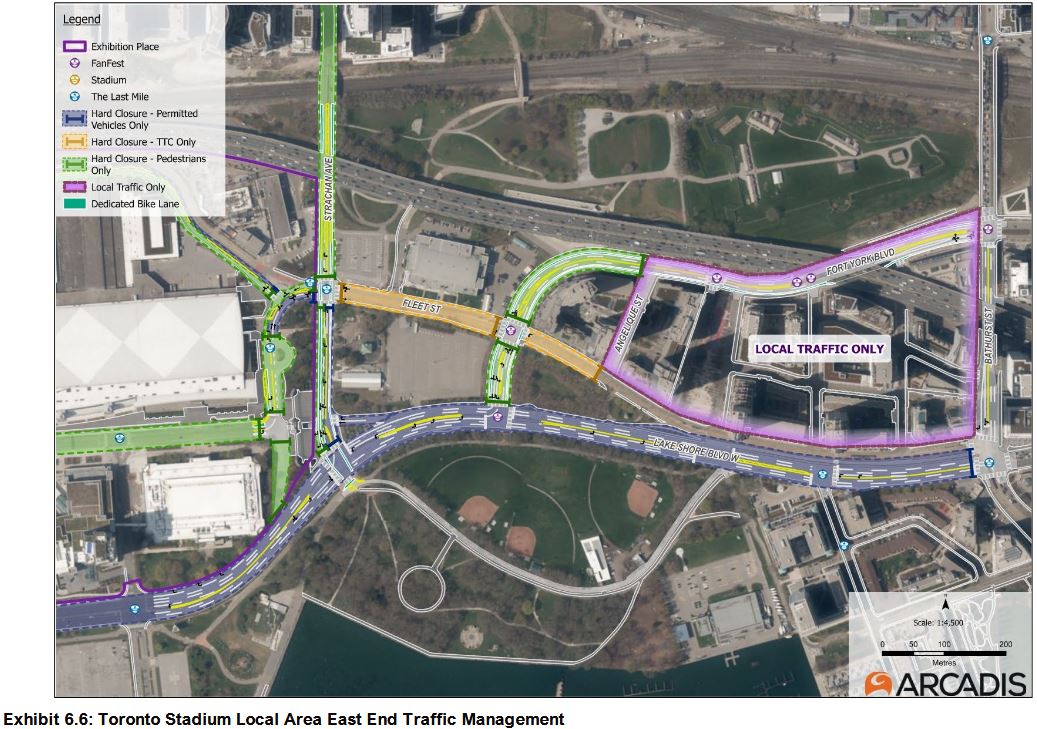
Road Restrictions
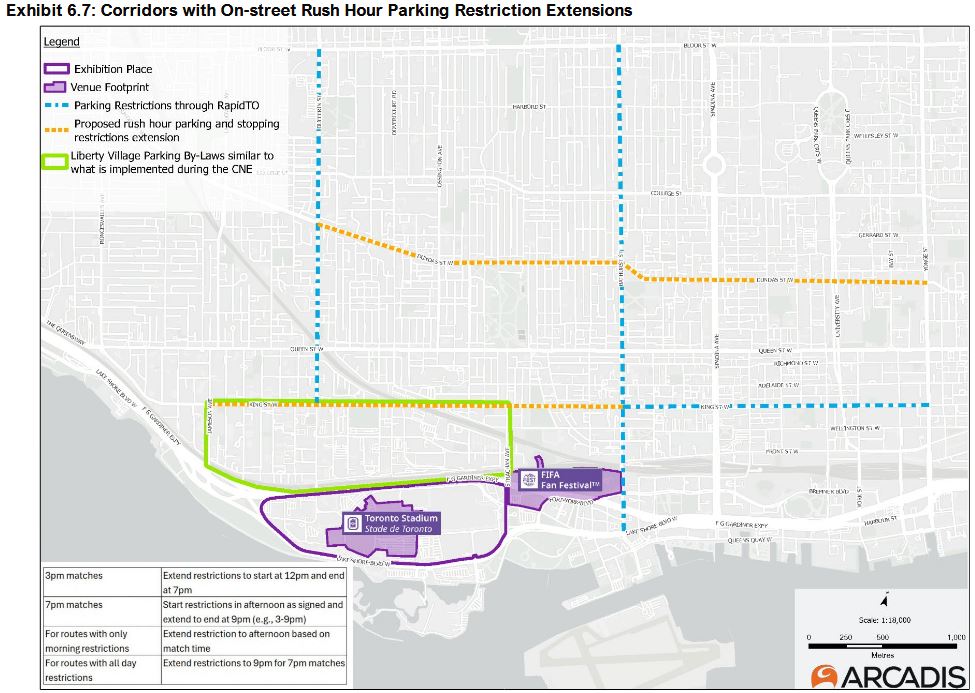
Parking restrictions on some arterials that now only exist during peak periods will be extended to improve road capacity.
Transit Access
The area east of Exhibition Place will serve as a transit hub on Fleet Street plus the Fan Fest area at Fort York and The Bentway (under the Gardiner Expressway). The primary access for 509 Harbourfront and 511 Bathurst streetcars will be on Fleet between Strachan and Fort York Boulevard (orange in the map below). Exhibition Loop will be used only by riders requiring deployment of an access ramp. Transit stops at Bathurst & Fleet will be removed from service.
The projected mode shares both to the stadium and to the Fan Fest area are:
Transit (TTC+GO): 70%
Active Transportation: 13%
Taxi/Rideshare: 10%
Auto (self driven): 7%
The GO Transit share is expected to be lower for the FanFest area because it is further from Exhibition GO station.
The plan is inconsistent about the number of attendees to be served. This will affect the total transit demand and the need for extra service on game days.
Stadium
Fan Fest Area
Capacity
45,000
20,000
Planned attendance
36,000
25,000
Transit service is expected to accommodate arrivals and departures with the following profiles:
Arrivals
3 hours before: 20%
2 hours before: 50%
1 hour before: 30%
Departures
1 hour after: 70%
2 hours after: 25%
3 hours after: 5%
With an expanded stadium, the Fan Fest and limitations on parking, transit will carry far more people than it does today especially during the after event surge.
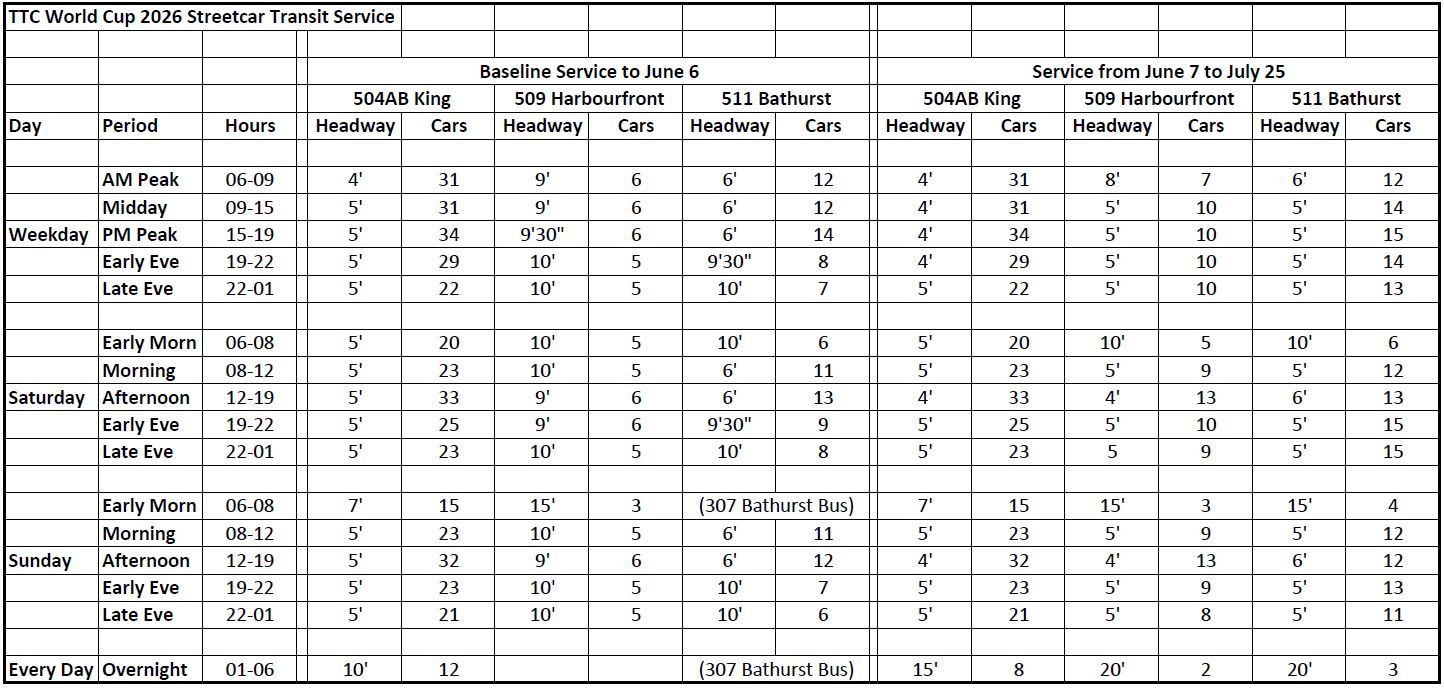
TTC service will be provided on various routes taking advantage of reserved lanes.
29/929 Dufferin bus service to Dufferin Loop
509 Harbourfront streetcar service from Union Station to Exhibition Loop
511 Bathurst express streetcar service from Bathurst Station to Exhibition Loop. Buses will run in parallel for local trips.
504 King will have extra service with riders expected to walk south to the stadium or Fan Fest. 504 cars will not use Dufferin Loop to maximize capacity for the 29/929 Dufferin bus.
The scheduled streetcar services will be improved beyond what is normally provided. Additional service will operate on game days. The values below are from the Mobility Plan and have not yet been confirmed by the TTC.
Adapted from Exhibit 6.8 at p. 60 of the Mobility Plan
Specific service levels for 29/929 Dufferin are not shown beyond saying that there will be “enhanced” service plus match day express shuttles.
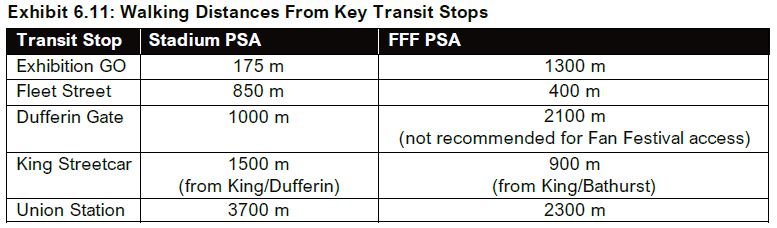
GO Transit will operate a 15 minute service on the Lake Shore corridor with extra trains possibly down to a 10 minute headway before and after matches. Their service is constrained by infrastructure including train spacing on the corridor and the combined service through Union Station. GO passengers arriving from other corridors face either a transfer to/from Lake Shore trains, a long walk from Union to Exhibition Place, or the limited capacity of the Harbourfront streetcar link notably the small loop and loading area at Union.
Taxis, Ride Share and Cycling
Access by taxis, ride sharing and cycling will, like all other traffic, not be allowed within the stadium or Fan Fest restricted zones. Three taxi/ride share drop off and pick up points will be created at Lamport Stadium, south of King at Strachan & Douro, and at Front & Bathurst.
Bike parking, including Bike Share terminals, will be at the Hanna & Liberty Green P lot, Ordnance Park east of Strachan, and at Inukshuk Park on the waterfront.
One challenge for cyclists is that there are areas with potential conflicts between large volumes of pedestrians and cyclists. “Walk your bike” will be the expected behaviour.
In the map below, a streetcar symbol is shown at Dufferin Gate, but the 504 streetcars will not actually go there, only the 29/929 Dufferin bus services.
Fare Payment
Fare payment will be via the PRESTO system at the standard rates including the GO/TTC integration. However, a limited time regional pass might be available.
A proposed new Regional Tourism Transit Pass pilot, subject to successful technology testing in early 2026, will provide visitors with an integrated and convenient means of payment across multiple transit systems while travelling throughout the GTHA. The PRESTO-enabled pass will offer unlimited travel on GO Transit, UP Express, and the TTC for 3-or 5-day periods. Modeled on established programs in global cities such as Paris and London, the initiative is intended to enhance the visitor experience, reduce transportation barriers, and support broader regional exploration. [p. 63]
The Rest of Downtown
Not mentioned in detail in the plan will be the effect of added travel demand and road closures both on traffic conditions and transit service in the central city. Past experience has shown that traffic control during events and in response to construction tends to focus on the immediate area, but locations further afield can be badly affected.
Not only does this snarl traffic, but transit service passing through affected areas deteriorates or vanishes affecting riders far from the event. Personally, I will completely avoid affected areas on game days, but many people do not have this flexibility.
Toronto talks a good line about transit priority, but does not always deploy the resources needed to provide it and to enforce restrictions on motorists’ behaviour. The FIFA games will be a major test in telling motorists that they are not in command of streets.