From the moment Line 6 opened in a magisterial whoosh of grandeur, well, maybe not exactly a whoosh, the issue of its glacial operating speed has fuelled many debates in social media.
One comparison that is always made is between the “LRT” and subway speeds. Yes, the LRT has closer stops, it has to deal with traffic signals, errant motorists and pedestrians, but it gives a new meaning to “glacial”. The downtown streetcar lines are in the same ballpark, and some of them best the brand new “LRT”.
There are many factors at work which I will leave for another day. This post is intended to provide info on the scheduled travel speeds of the two major subway lines and the new 6 Finch West.
The data are taken from the GTFS version of schedules used by trip planning apps. They do not match the actual speeds, but give a sense of what the TTC expects these to be, in general, for trains running “on time”. (The GTFS data includes times and spacing for every stop from which the scheduled speed can be calculated easily.)
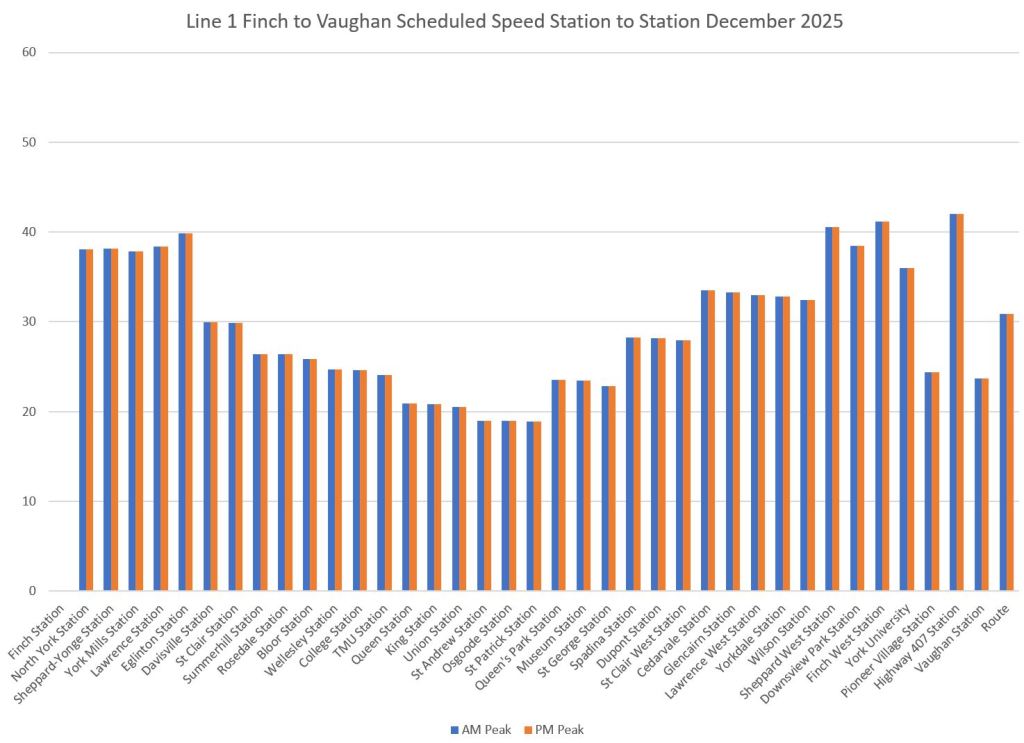
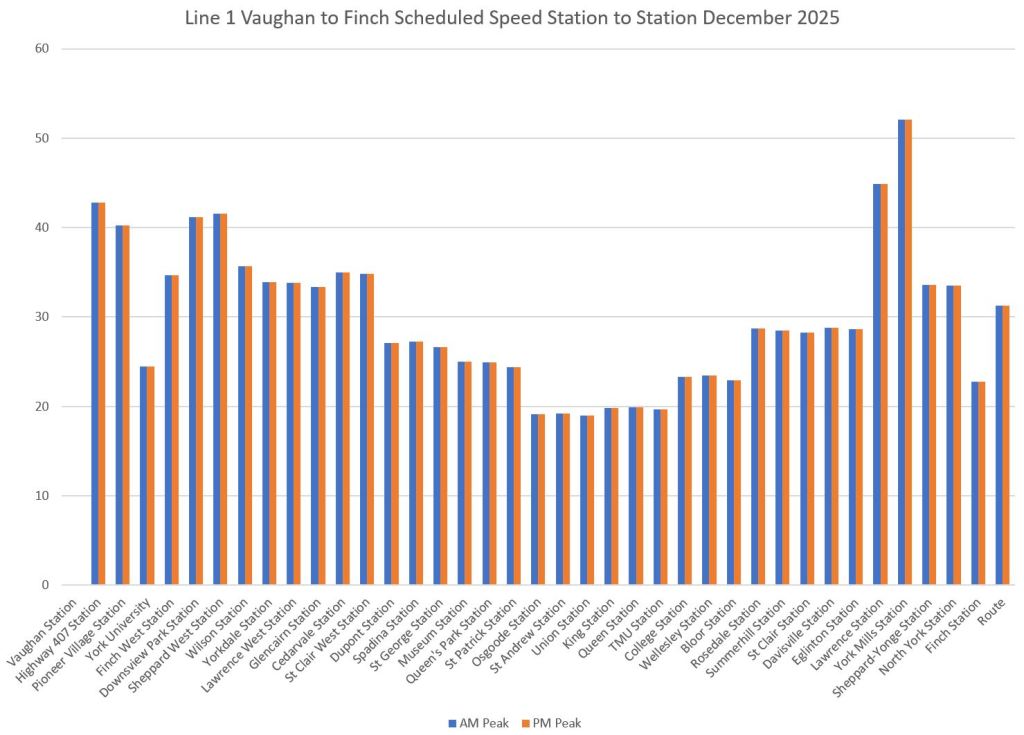
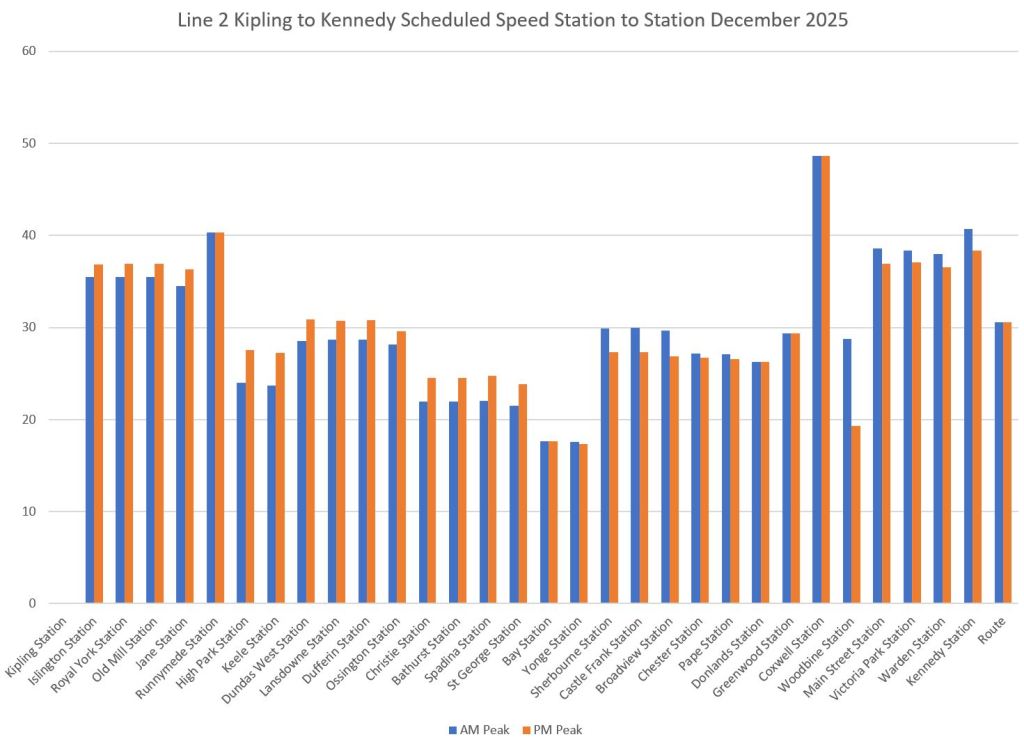
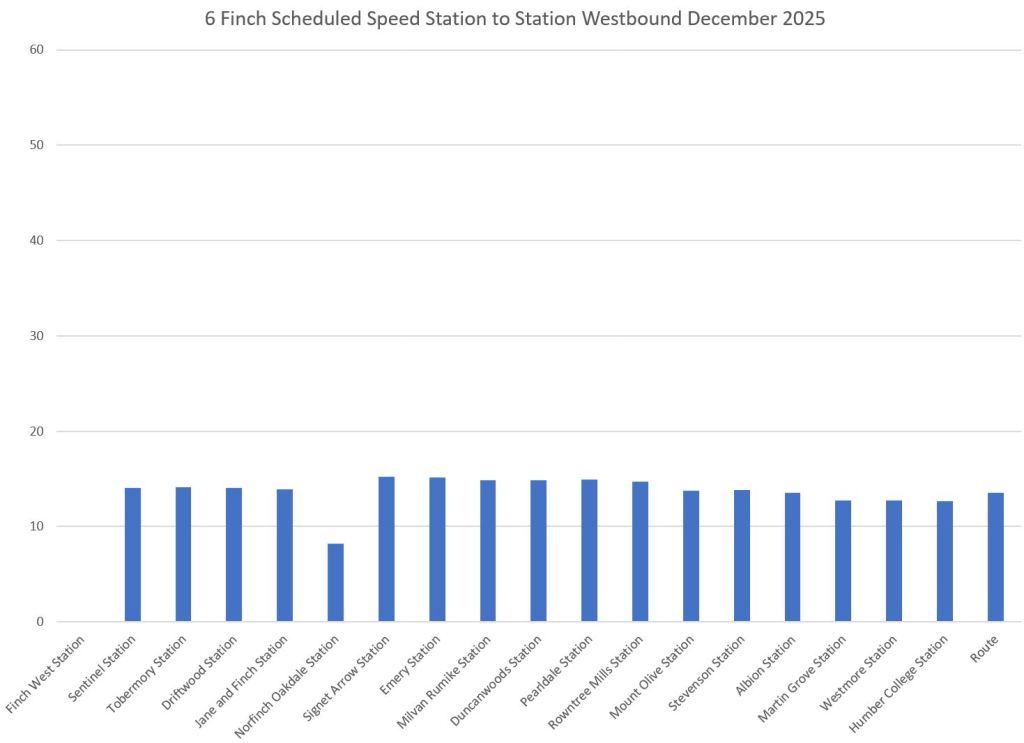
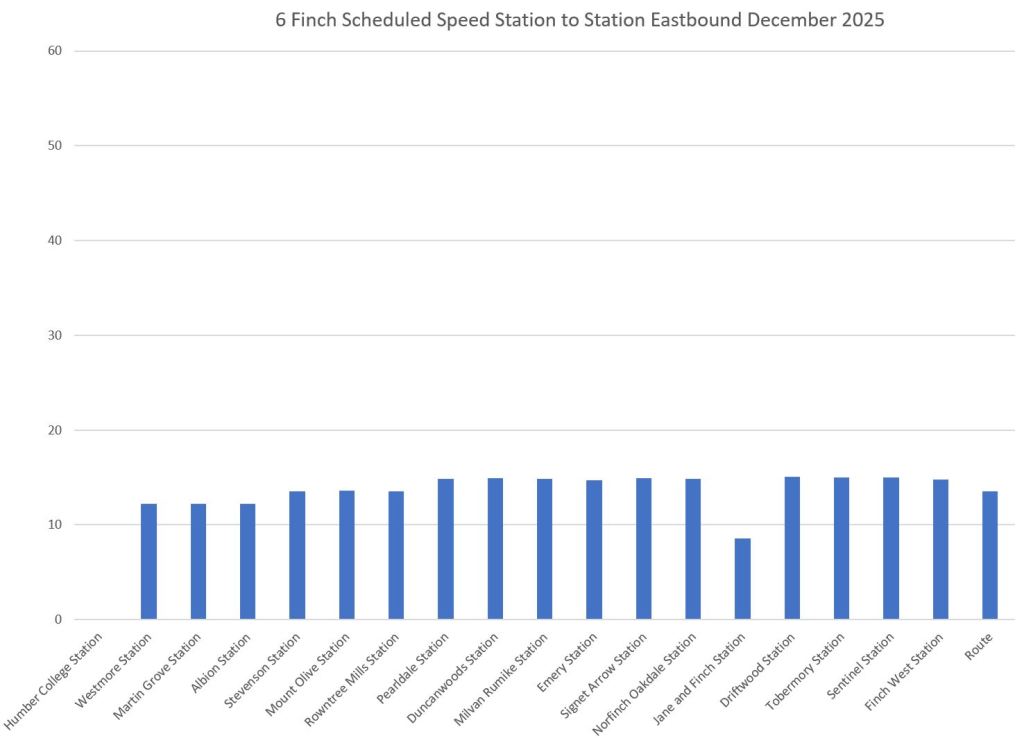
In the charts for Lines 1 and 2 (Yonge-University and Bloor-Danforth), data are shown for both the AM and PM peaks. For Line 6 Finch, only one set of data is shown because the TTC has used a generic all-day schedule for the initial service.
The vertical scale is set at 60 km/hr for all charts. The average values for each set of data are at the right end of each chart labelled “Route”.
It is self-evident that subway speeds will be higher for many reasons including stop spacing and the fact that trains both accelerate to and run at higher speeds. However, the LRT speeds are embarrassingly slow. Riding the line even on a trip that makes its scheduled time, the car crawls across the route.
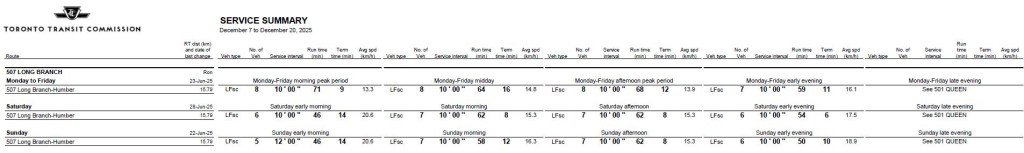
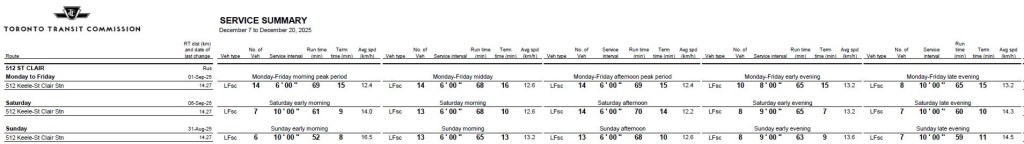
As a matter of comparison, the 512 St. Clair car is only slightly slower than 6 Finch and at times faster. The 507 Long Branch running on Lake Shore Boulevard in Etobicoke is consistently faster than 6 Finch.
With the mid-period update of schedules for opening of the 6 Finch line, TTC has published a revised Scheduled Service Summary. There are only a few changes, and they are listed here for convenience.
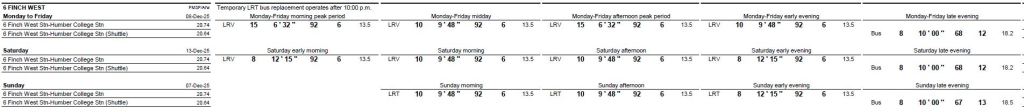
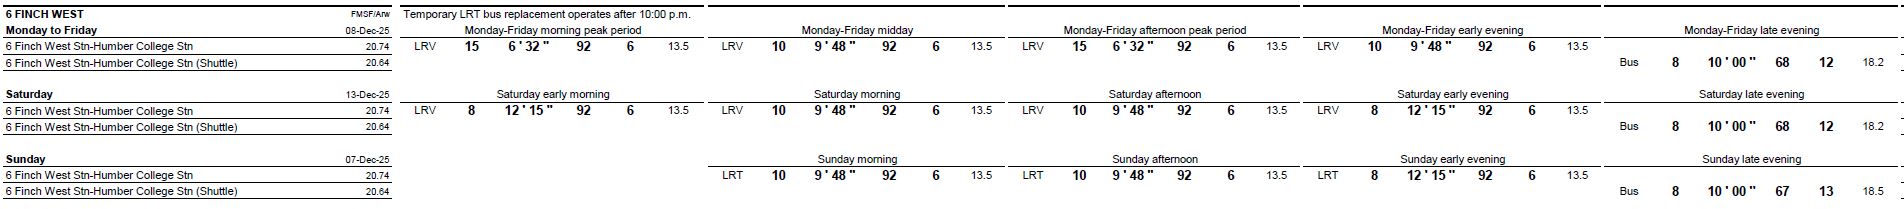
6 Finch
Here is the service summary for the new LRT line and the late evening shuttle bus. Note that the shuttle bus is interlined with the 37S Islington short turn service from Humber College to Humberwood Loop, although this is not mentioned in the summary.
Note that the scheduled speed of the bus is much higher than the LRT, and the buses get generous recovery time.
The peak requirement is 15 cars out of the 18 in the fleet.
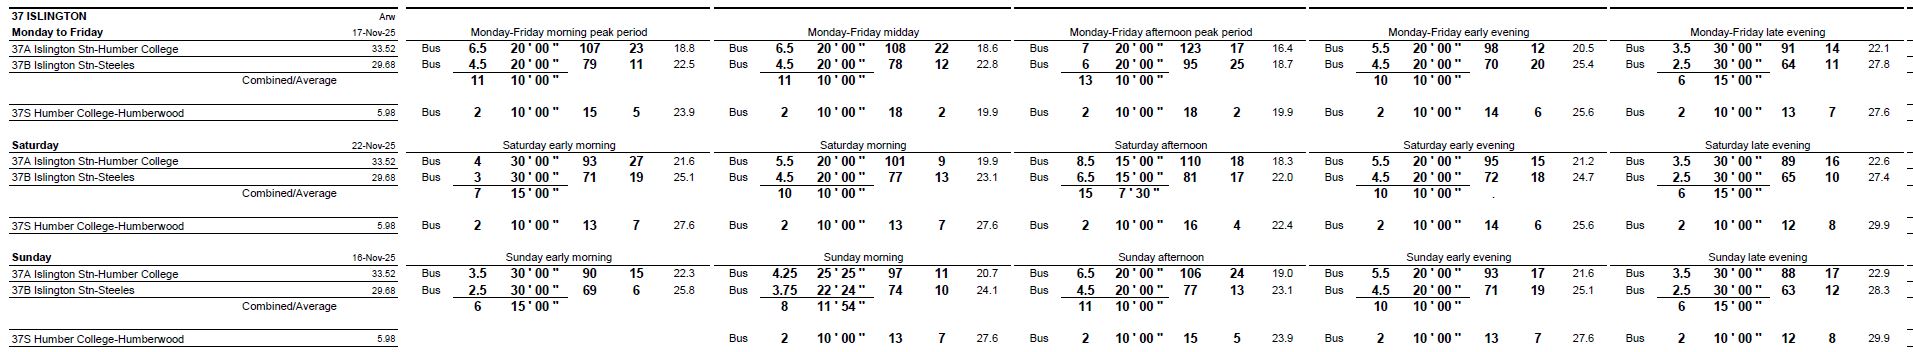
37 Islington
In the December 7 summary, a 37S Islington short turn service is shown between Humber College and Humberwood Loop, although the effective date of the schedule is supposed to be mid-November. This does not appear in the November 16 version of the summary.
During the late evening, these buses interline with the Finch West shuttle which has an internal route number of 806 even though it operates as “6”.
Mayor Chow announced that as part of her 2026 Toronto Budget, fare capping will be introduced on the TTC starting in September 2026.
The cap will be set at 47 rides per calendar month and will apply to all fare classes including adults, seniors and youth. This will bring the senior’s and youth monthly fares down to the same multiple as adults. Chow also proposes that the TTC budget for a 40 ride cap in 2027.
The caps will apply to fares paid by Presto, debit or credit card provided that the same card is used for all rides. This is enabled by changes in Presto’s “back end” system that will keep track of rides used and charge accordingly. Monthly passes will disappear, but frequent riders will get the equivalent benefit without buying a pass up front. This is important for those on tight budgets who do not know what their travel habits will be in advance.
The anticipated cost in 2026 will be $2.9-million less TTC farebox revenue, and a further $0.6-million for the City due to the reduced effective price of their “Fair Pass” for low income riders.
This is a long-overdue change to the fare structure that was first approved in principle by the TTC Board many years ago. Now finally it will be implemented because of the Mayor’s willingness to fund it, and Presto’s ability to support it for all types of payment.
No details of how this scheme will interact with regional fare deals such as 905+416 trips and GO+TTC trips have been announced.
The proposal will first go to the TTC Board’s budget meeting in January, and then through the City’s budget process to Council on February 10, 2026.
Ooops! The initial version of this article used Line 6 in the title. I am too focused on the impending Finch opening!
The Ontario Ministry of Transportation has announced that the Line 5 Crosstown project achieved substantial completion today, December 5. The line is now transferred to the TTC for operation.
No start date has been set, and the TTC will have to conduct its own final pre-service testing just as they did on 6 Finch after the provincial hand-off. A likely date would be mid-February which corresponds to a planned schedule change far enough in the future to accommodate both Line 5 testing and the crewing process for concurrent network changes.
The opening of Line 6 on December 7 is a “mid period” change that is not part of the TTC’s regular cycle, but is likely due to a political desire to complete at least one of the lines in 2025.
According to the Ministry, service on Line 5 will ramp up:
Opening Day
Operation from 6am to 11pm
Peak service every 4’45”
Six-Month Service
Operation from 5:30am to 2:30am
Peak service every 3’30”
The TTC has not announced what type of supplementary service will operate during the six-month interim period, nor the service to be provided on a parallel 34 Eglinton bus from Kennedy to Mount Dennis Station in the long term.
The TTC has issued a press release confirming the times for start of service on December 7:
Line 6 Finch West – Toronto’s newest transit line – will officially open to customers on Sun. Dec. 7. The first westbound train will depart from Norfinch Oakdale Station at 7:33 a.m., while the first eastbound train will leave Jane & Finch Station at 7:47 a.m.
For detailed first train times at each of the 18 new Line 6 stations, customers are encouraged to visit the official TTC schedules page: https://www.ttc.ca/routes-and-schedules.
Before regular service begins, two ceremonial trains will depart from Finch West Station.
Opening day is expected to be busy, and the TTC has organized special activities to mark the occasion. Customers will have the opportunity to collect exclusive Line 6 souvenirs, including special-edition ride guides, vehicle cutouts, and limited-edition commemorative coins and buttons.
[…]
Opening day schedule
On Sun., Dec. 7, the TTC will host a celebratory opening at Finch West Station. The planned opening day schedule is below:
• 7:00 a.m. – Brief remarks from dignitaries. • 7:20 a.m. — A ceremonial first train will depart Finch West Station. This trip will be reserved for media and invited guests. • 7:27 a.m. — A second train will depart Finch West Station. Members of the public are welcome to board and join the celebration. This train will be travelling to Driftwood Station and returning to Finch West Station. It will not be picking up customers at other stops. • 7:33 a.m. — The first in-service train will depart Norfinch Oakdale Station, heading west.
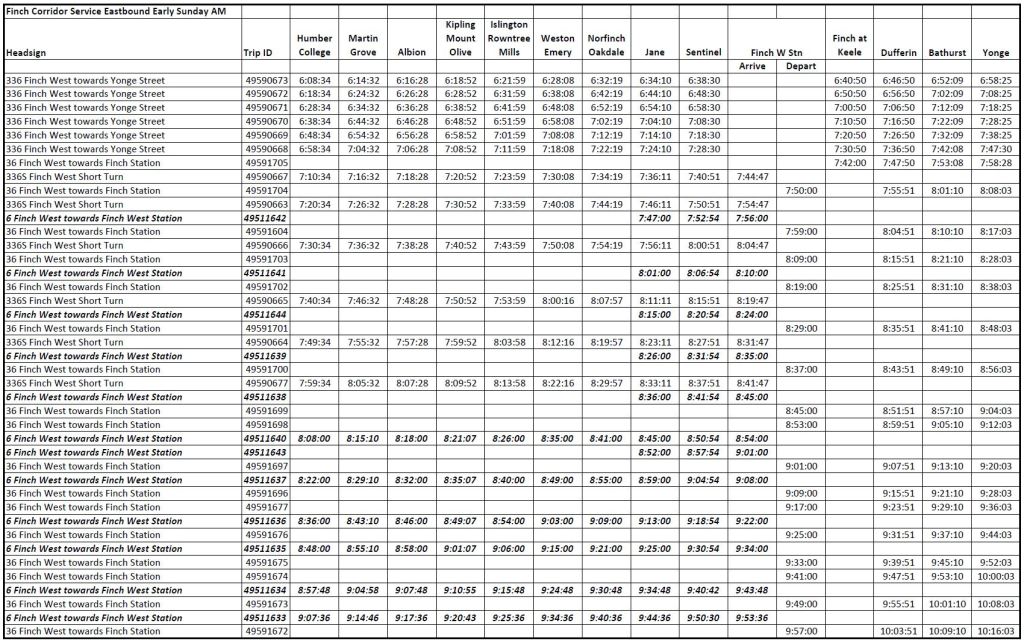
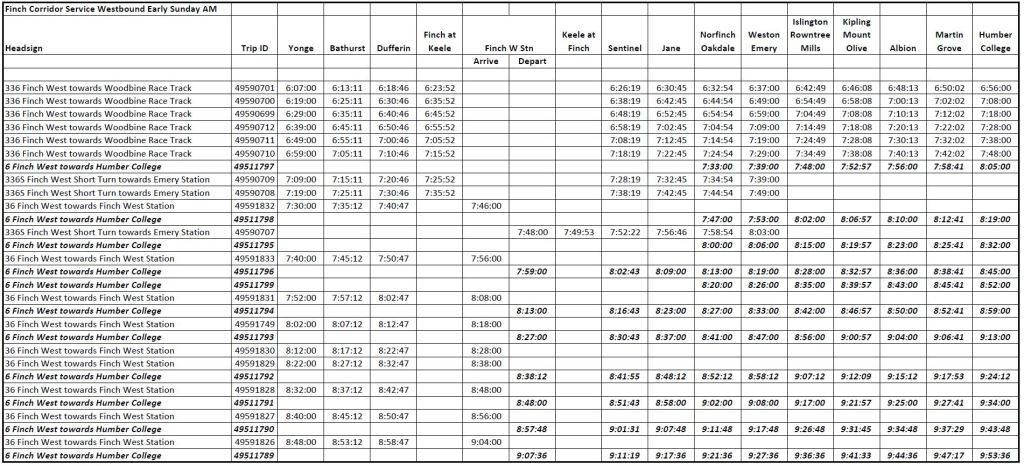
Note that the schedule pages for Line 6 have not been loaded yet, but you can see the early Sunday morning service on the Finch Corridor below, and the full schedule for 6 Finch West in this pdf. The schedules should go live on the TTC’s site when they flip over to the December 7 versions on the weekend.
Original article:
This post contains a consolidated view of schedules for:
6 Finch West LRT
36 Finch West Bus
336 Finch West Night Bus
The period covered is 6 to 9am on Sundays, and these timetables show the transition from the night bus covering the entire route to the split bus/LRT operation east and west of Finch West Station during the daytime.
The information is taken from the GTFS version of the schedules for these routes published on the City’s Open Data site recently. My intent in producing this is that the new schedules will not go live on the TTC site until December 7, and many eager transit aficionados will want to know the times of service at various locations on the route in time to plan to ride early trips.
The TTC’s web page about Line 6 gives a generic start time of 7:30am for the route on Sundays, but actual times vary along the route.
In the timetables below, the LRT trips are in bold italics. Only major stops are shown to save space.
For those unfamiliar with the new line, the carhouse is located between Jane and Norfinch stations, and some trips originate there during the build-up of service.
Corrected November 29, 2025 at 2:55pm: An error in the PDF containing the schedule information has been corrected for early Sunday service westbound.
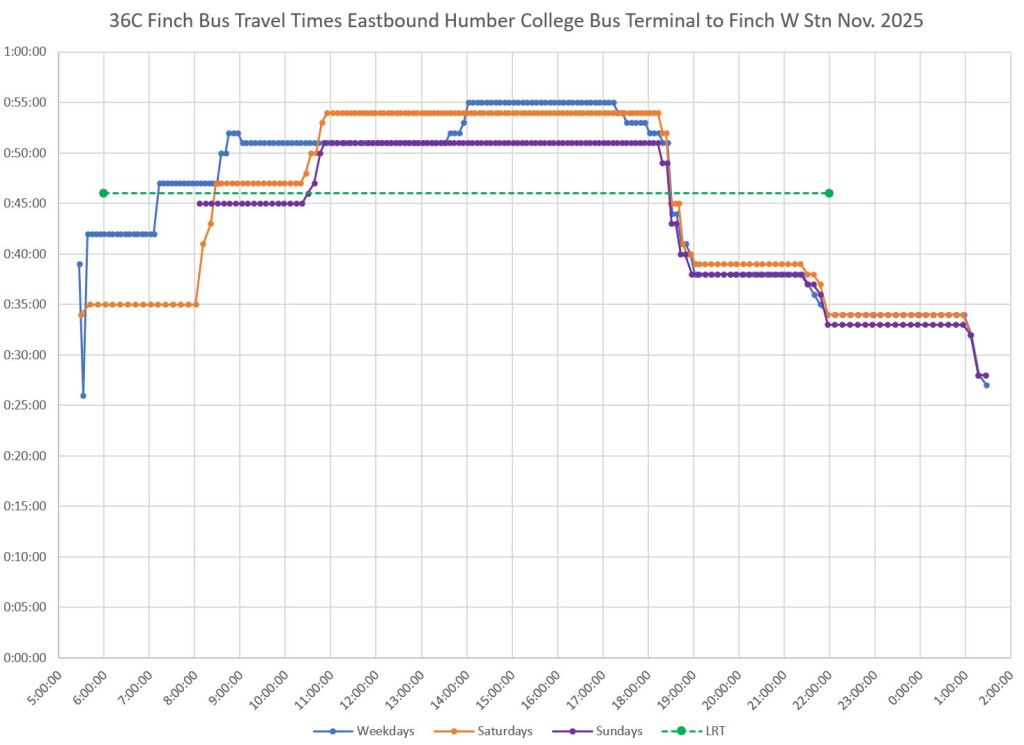
Updated November 29, 2025 at 12:15pm: Charts comparing the scheduled travel times of the 36C Finch West Bus with the planned 6 Finch West LRT have been added.
Correction November 29, 2025 at 7:45am: As some readers have noted in the comments, the times shown at Martin Grove Station eastbound on weekdays were the same as those at Humber College. This was an editing error on my part in copying columns from a larger version of the table. This has been corrected both in the snapshot and in the PDF of the full schedule.
The TTC has published the GTFS version of the schedule for 6 Finch West. This is the electronic timetable used by trip planning apps to understand how the scheduled service is supposed to behave. From these data, it is possible to construct a schedule in a human readable format as well as to calculate travel times and speeds along the line.
The full schedule for weekdays, Saturdays and Sundays is in this PDF. [Corrected Nov. 29 at 2:55pm]
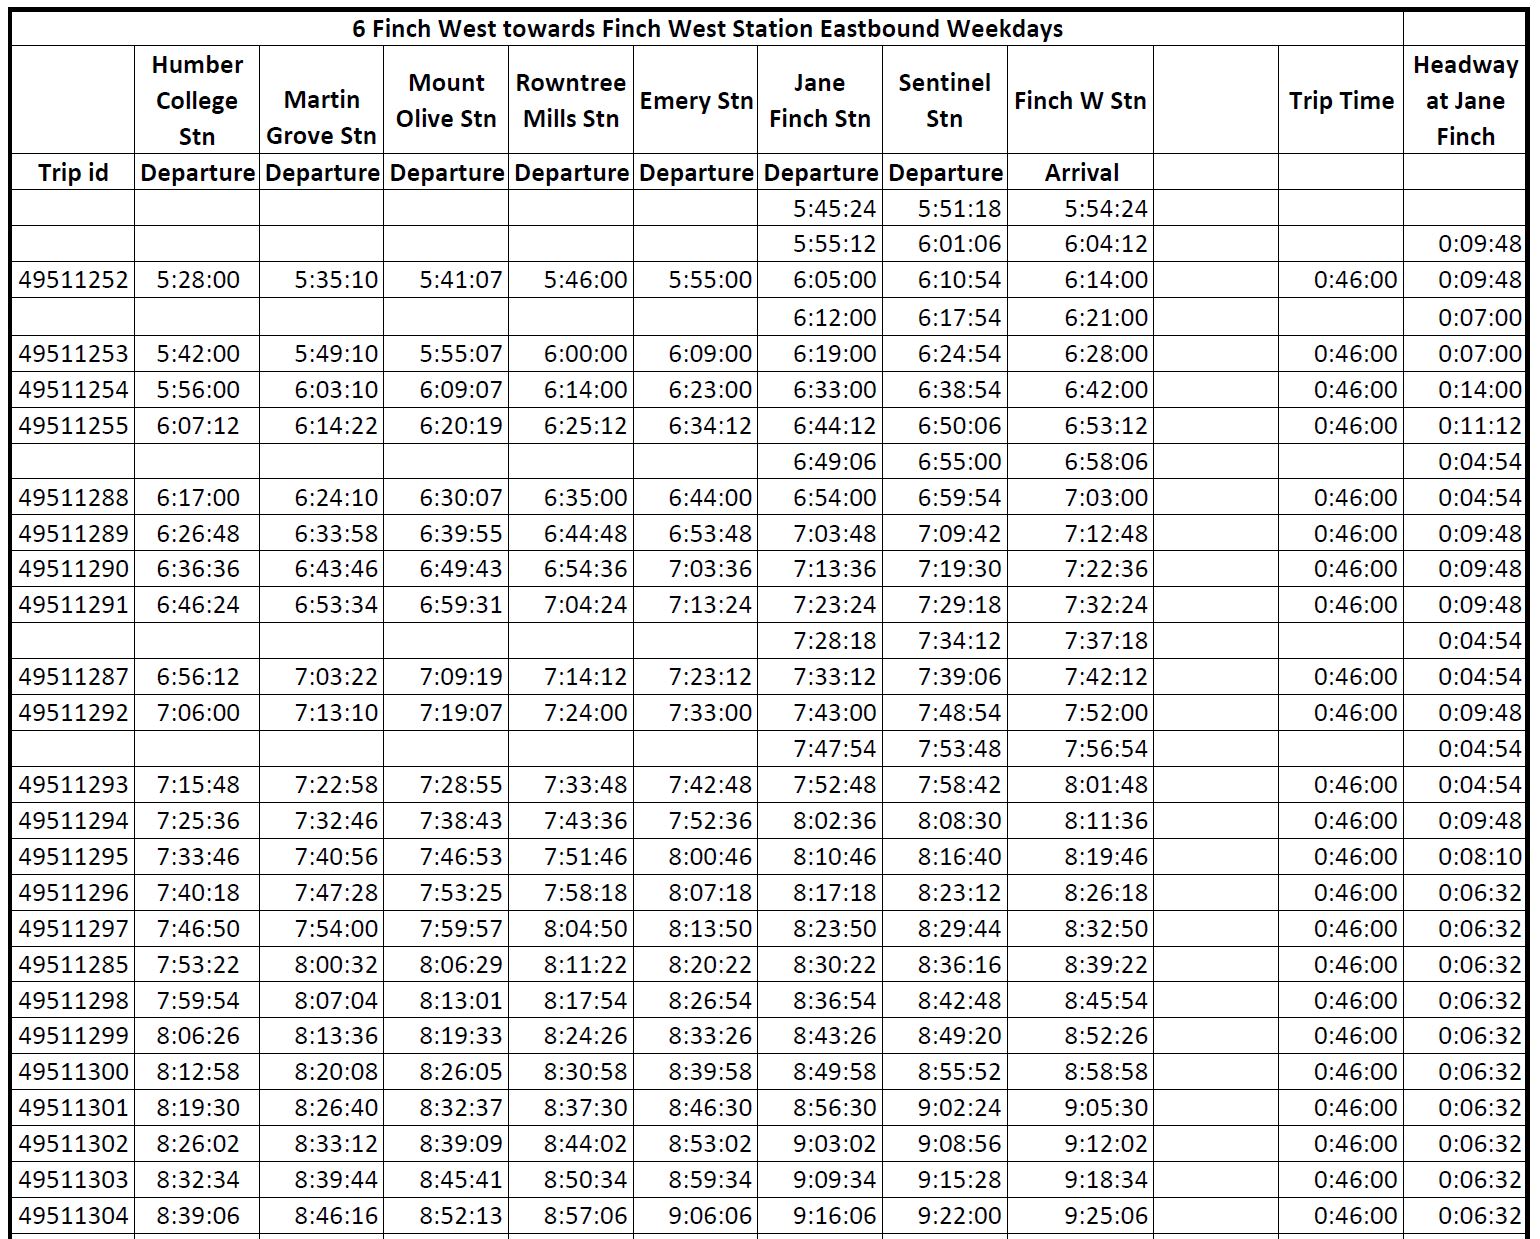
As a guide to reading this, here is the early part of weekday service eastbound.
Trip id: The internal trip number assigned by the scheduling system
Departure and arrival times: These are shown for selected major stops. Some trips originate eastbound from the maintenance yard, and so they first show up at Jane-Finch.
Trip times: The difference between arrival times at Finch West Station and departure times from Humber College Station. Note that they are all 46 minute. This is not typical for TTC routes where the scheduled time varies over the course of the day. This is likely a placeholder value until the TTC finds out what the actual travel times will be.
Headways: The interval between cars at a point where all trips are present.
Because there is only one schedule design for a 46 minute trip time all day, the scheduled speeds are the same for all trips. An obvious question is whether the TTC will force cars to hold to this schedule even if it proves excessive thereby delaying riders needlessly. Conversely, if cars operate at whatever speed conditions will allow, there will likely be terminal congestion just as on streetcar routes with excessive scheduled travel and recovery times.
The tables in this file show the spacing between stops, the scheduled time and the speed in kilometres per hour. Speeds vary over the route, and they average 13.53 km/hr. This does not include terminal turnaround time.
There is a particularly slow section at Jane-Finch both ways implying that provision has been made for a delay on every trip. I will inquire of TTC why the slow operation (8.2 to 8.6 km/hr) applies there.
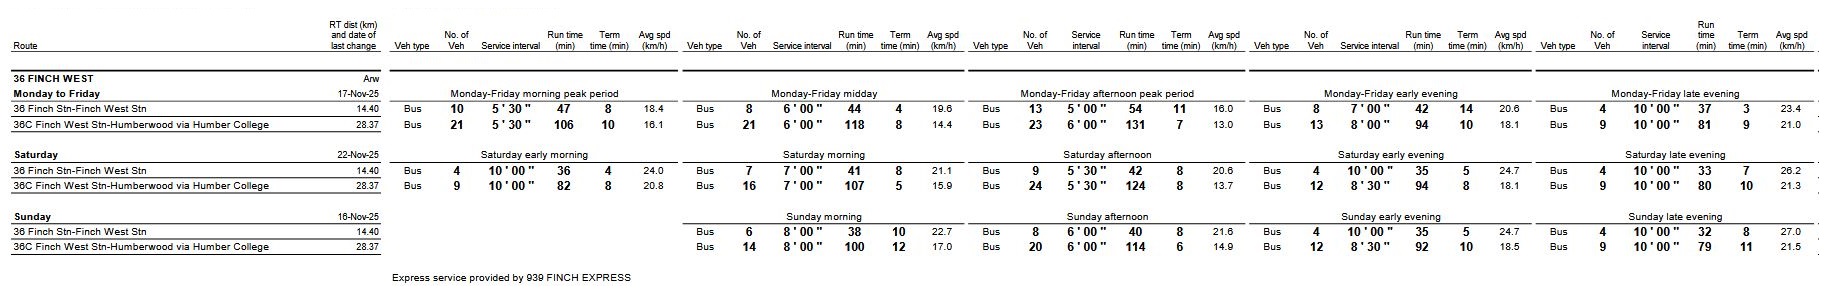
The average speed is slower than the 36 Finch bus during some periods, a rather poor showing for a rail line on its own reserved lane. In a future update, I will include more information about the stop level schedules and speeds for the 36C Finch West Bus. Here is the current scheduled service summary.
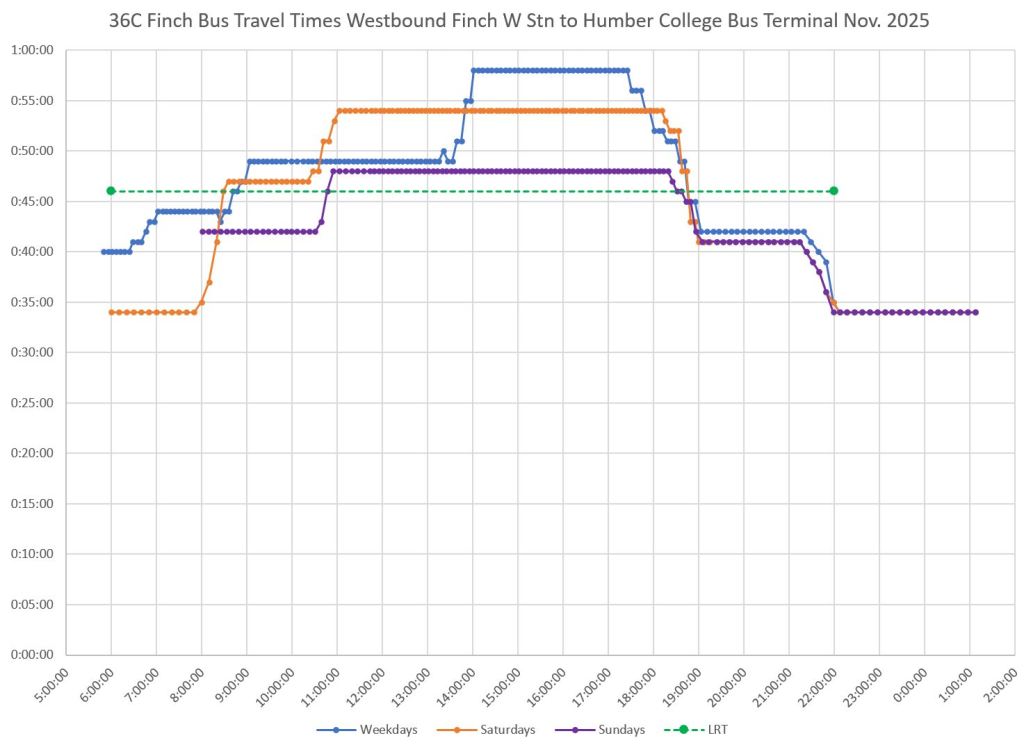
Comparative Scheduled Travel Times for 36C Finch West Bus an 6 Finch West LRT
The charts below compare the scheduled travel times between Humber College Bus terminal and Finch West Station with the planned 46-minute trip time of the LRT service. The LRT is faster than the bus notably on weekday and Saturday afternoons, but slower in the early morning and evening periods.
This post will be updated with early operating results and vehicle tracking information once they are available.
With the constant changes in route diversions for various construction projects, water and sewer repairs and overhead reconstruction, the previous Fall 2025 edition was getting cluttered and unwieldy. This version consolidates the current and planned work for late fall and early winter 2025-26.
Updated March 13 at 8:00am
Current and pending diversions:
Ongoing:
501 Queen cars divert both ways via Church, Richmond/Adelaide and York.
Water main and track work on Queen from Broadview to Davies require diversion of 501 Queen, and bus replacement of 503 Kingston Road and the east end of 504 King.
Effective February 23:
The second phase of diversions for track and water main work on Queen west of Broadview begins as work shifts to track replacement. See details in the main article.
Beginning March 2:
Track replacement at Bay & College will require diversion of 506 Carlton and a replacement bus service. See details in the main article.
March 10 at 11pm to March 26 at 4am:
Service on Fleet Street west of Fleet Loop is suspended. 509 Harbourfront cars will end at the loop, and 511 Bathurst will convert to bus operation.
March 16 to 20:
508 Lake Shore streetcars will be replaced with buses due to infrastructure work in Roncesvalles Carhouse.
Beginning June:
Long Branch Loop will be rebuilt. Streetcar service will be partly or completely replaced by buses from June 7 to October 31. Dates are tentative.
The TTC’s Strategic Planning Committee met on November 25 for a presentation outlining major issues in the forthcoming Operating and Capital Budgets. These will be presented at the next meeting of the full Board on December 10.
When the Strategic Planning Committee was first proposed during 2025 budget debates, the idea was that it would have some input to the 2026 cycle through discussions of policy options, financial effects and tradeoffs. However, the committee’s actual formation dragged on for months almost as if there was a “fifth column” working to prevent its ability to function.
The committee will not meet again until March 2026, and hopes to plug into the 2027 budget cycle. This will be complicated by the municipal election and the sense that any policy debate sets the stage for candidate platforms. Still to come from management is an updated Ridership Growth Strategy that necessarily will inform budget plans for 2027 and beyond. It is not yet clear how work on various TTC plans will flow through the Strategic Planning Committee with meaningful input and opportunity to fine-tune proposals.
In that context, management presented an overview of issues facing the TTC going into the 2026 budget debates.
The stage is set with an overview of recent years and the situation in late 2025.
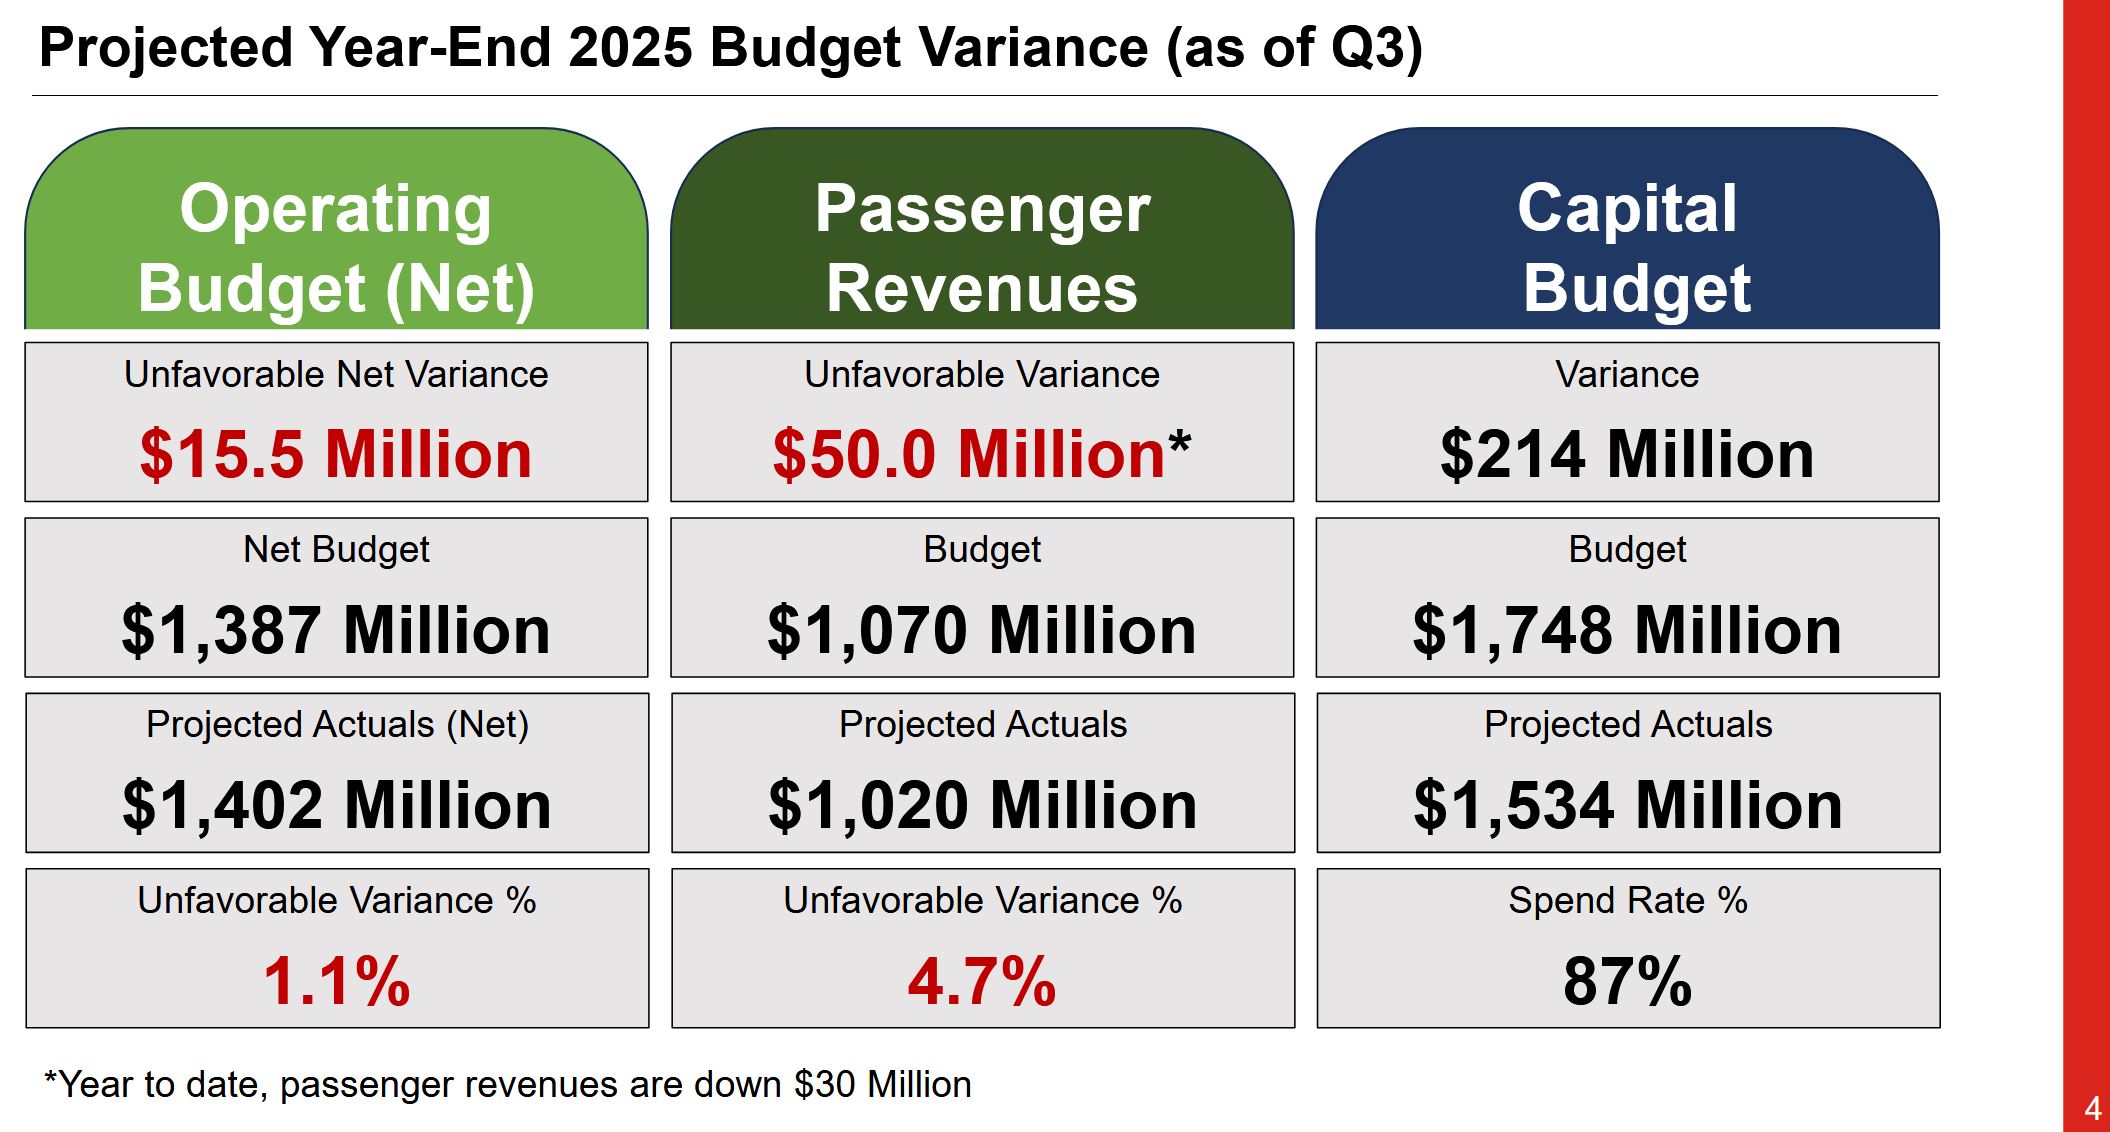
The 2025 budget aimed high anticipating riding growth from a return-to-office commuting trend. This has not materialized uniformly across the system, and it is compounded by a decline in student travel thanks to cuts in the international student visa program and reduced offerings at post-secondary schools.
In the table below, note that the “Operating Budget (Net)” is effectively the budget as seen from the point of view of funders, primarily the City. The gross budget for 2025 is $2.9-billion.
On the Capital side, the TTC spent 87% of allocated budgets as of the third quarter end, and expects to hit 100% or more by year-end. Spend rates through the year are affected by peaking effects from project timing related to weather (construction delays) and major deliveries (new vehicle arrivals), for example.
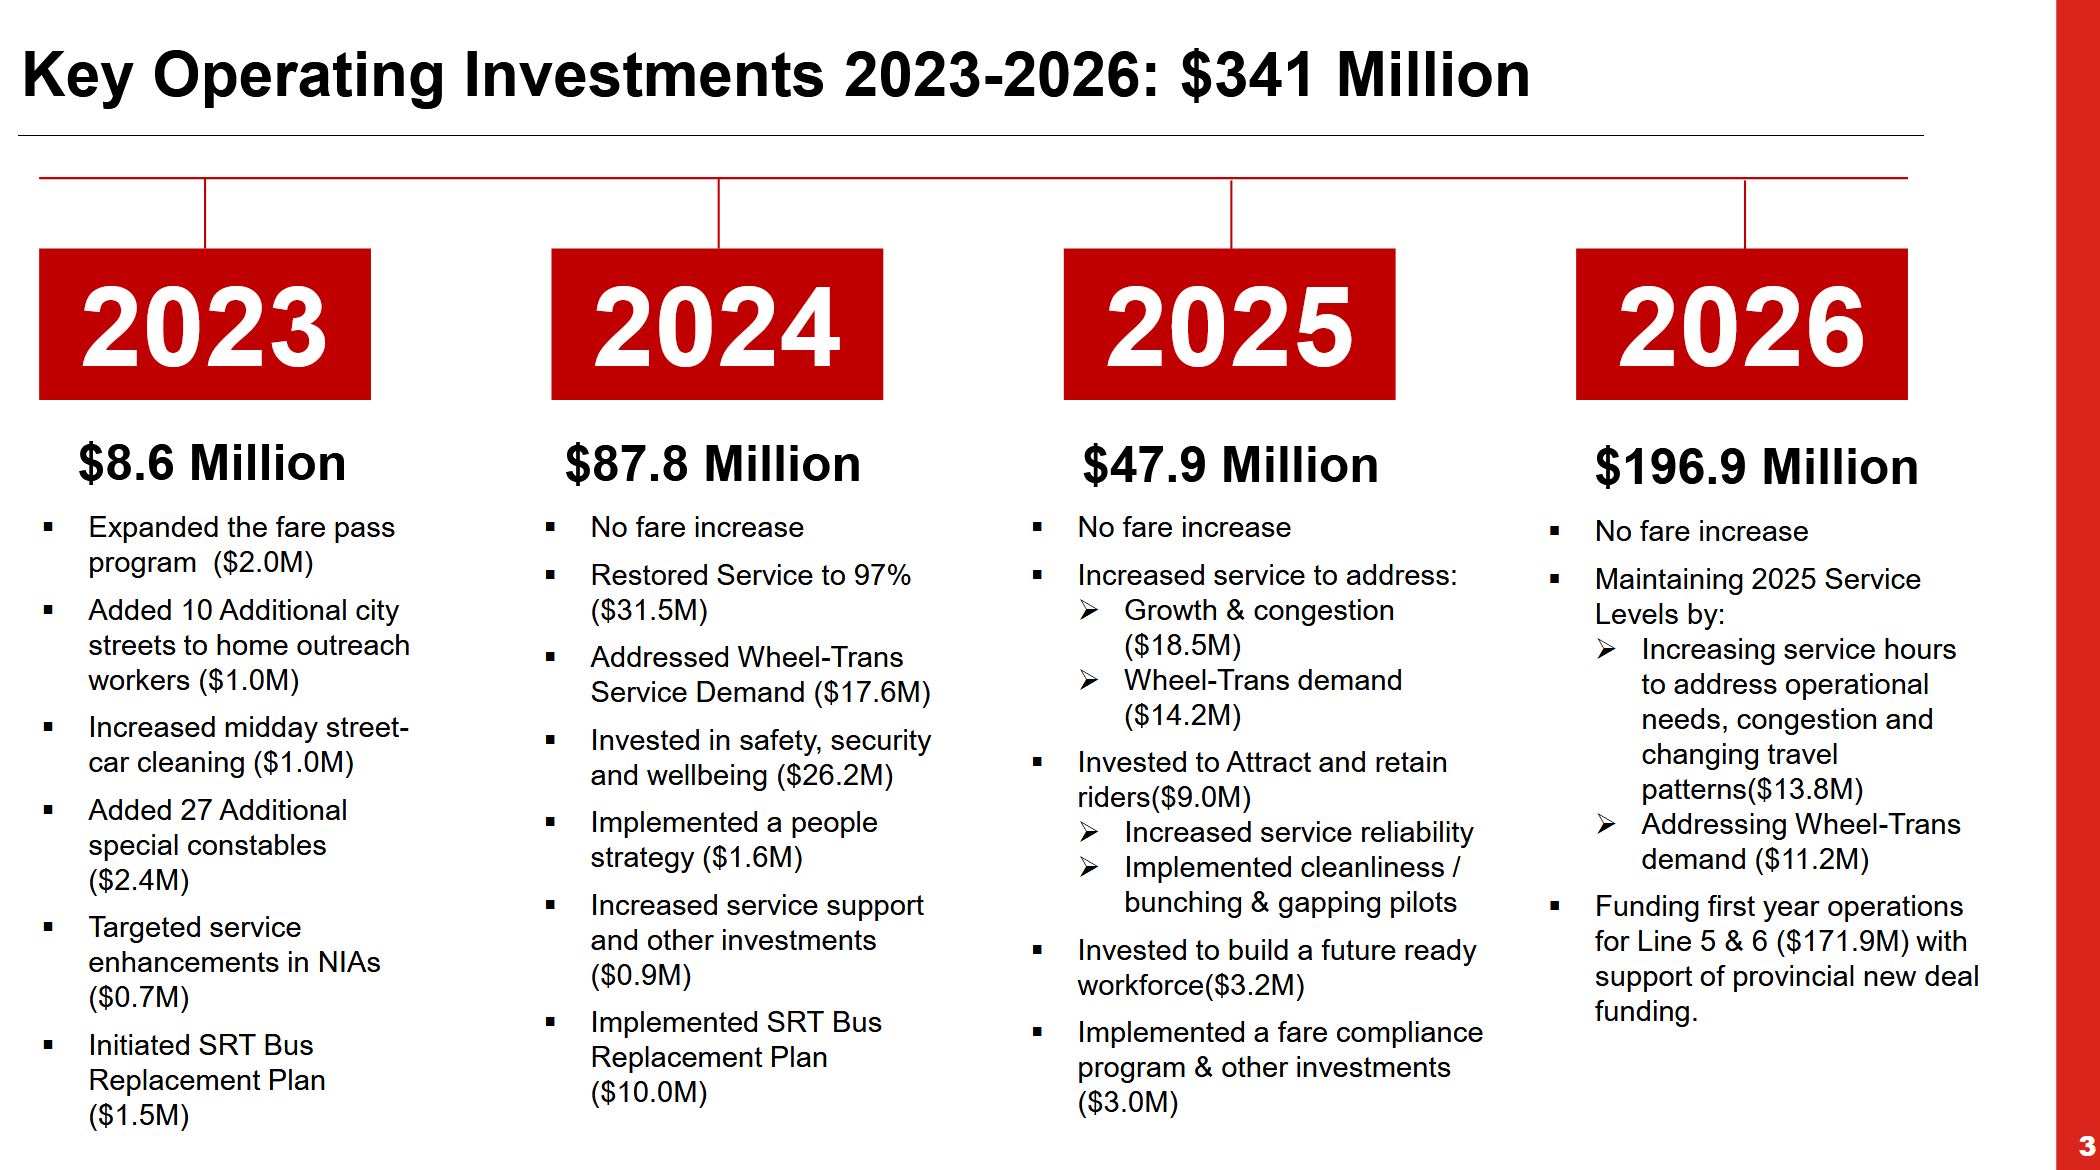
Although the bump proposed in 2026 spending is relatively large, almost $200-million, 87% of this goes to the extra cost of operating Lines 5 and 6, assuming both are open. Only $25-million goes to current service. Some of that will simply pay the full year cost of operating improvements made in 2025 such as restoration of subway service to near-2019 levels. As we will see later, improvements, such as they might be, will come by reallocation of service between routes, not from net new spending.
For the third year in a row, fares will be frozen. This has a cost, although it is not shown as a budget line item. A 10-cent increase in adult fares, about 3% at current levels, translates to about $30-million annually less the effect of any ridership loss an increase would cause. TTC management has always warned that small annual changes in fare levels are preferable to infrequent large jumps to make up for periods of fare freezes. There is nothing inherently wrong with keeping fares low and service good, but the City must go into that policy with its eyes open as subsidies make a larger part of total revenue, and any service increases bear an increasing effect on non-fare funding.
Debates will continue about changing the fare structure including rebalancing concession rates, introducing schemes to benefit frequent riders such as fare capping. However, any change is unlikely until at least mid-2026 when the TTC rolls out a new version of Presto that will provide more flexibility in tariff design.
This is not to say discussion about fares should halt, and indeed it should already be underway informed by the capabilities and restrictions of Presto. This should be a integral part of any Ridership Growth Strategy debate including the comparative value both in the business sense and as a matter of municipal policy. Why do we provide transit service, what constitutes good, attractive service, and what spending (or avoided revenue increase) would best address the City’s goals?
For 2026, the highlights are:
The fare freeze
A 2.2% increase in service hours
Added funding for a growing fleet of eBuses and streetcars (new vehicles delivered in 2025 will incur full-year maintenance costs in 2026)
Lines 5 and 6 operation (the net cost to be offset by a Provincial subsidy)
Of the total operating cost, 93% is “conventional” TTC service and 7% is for Wheel-Trans out of a projected total of $3-billion.
This was achieved while keeping the increase in City funding to $91-million and finding $87-million in budget reductions (some of which are due to accounting changes). We do not know most of the details of budget trimming, nor the foregone possibilities for improvement. Commissioner Saxe queried the lack of Board participation in this process which was to be part of the Strategic Planning Committee’s mandate. We will see in 2026 whether there actually is an open debate.
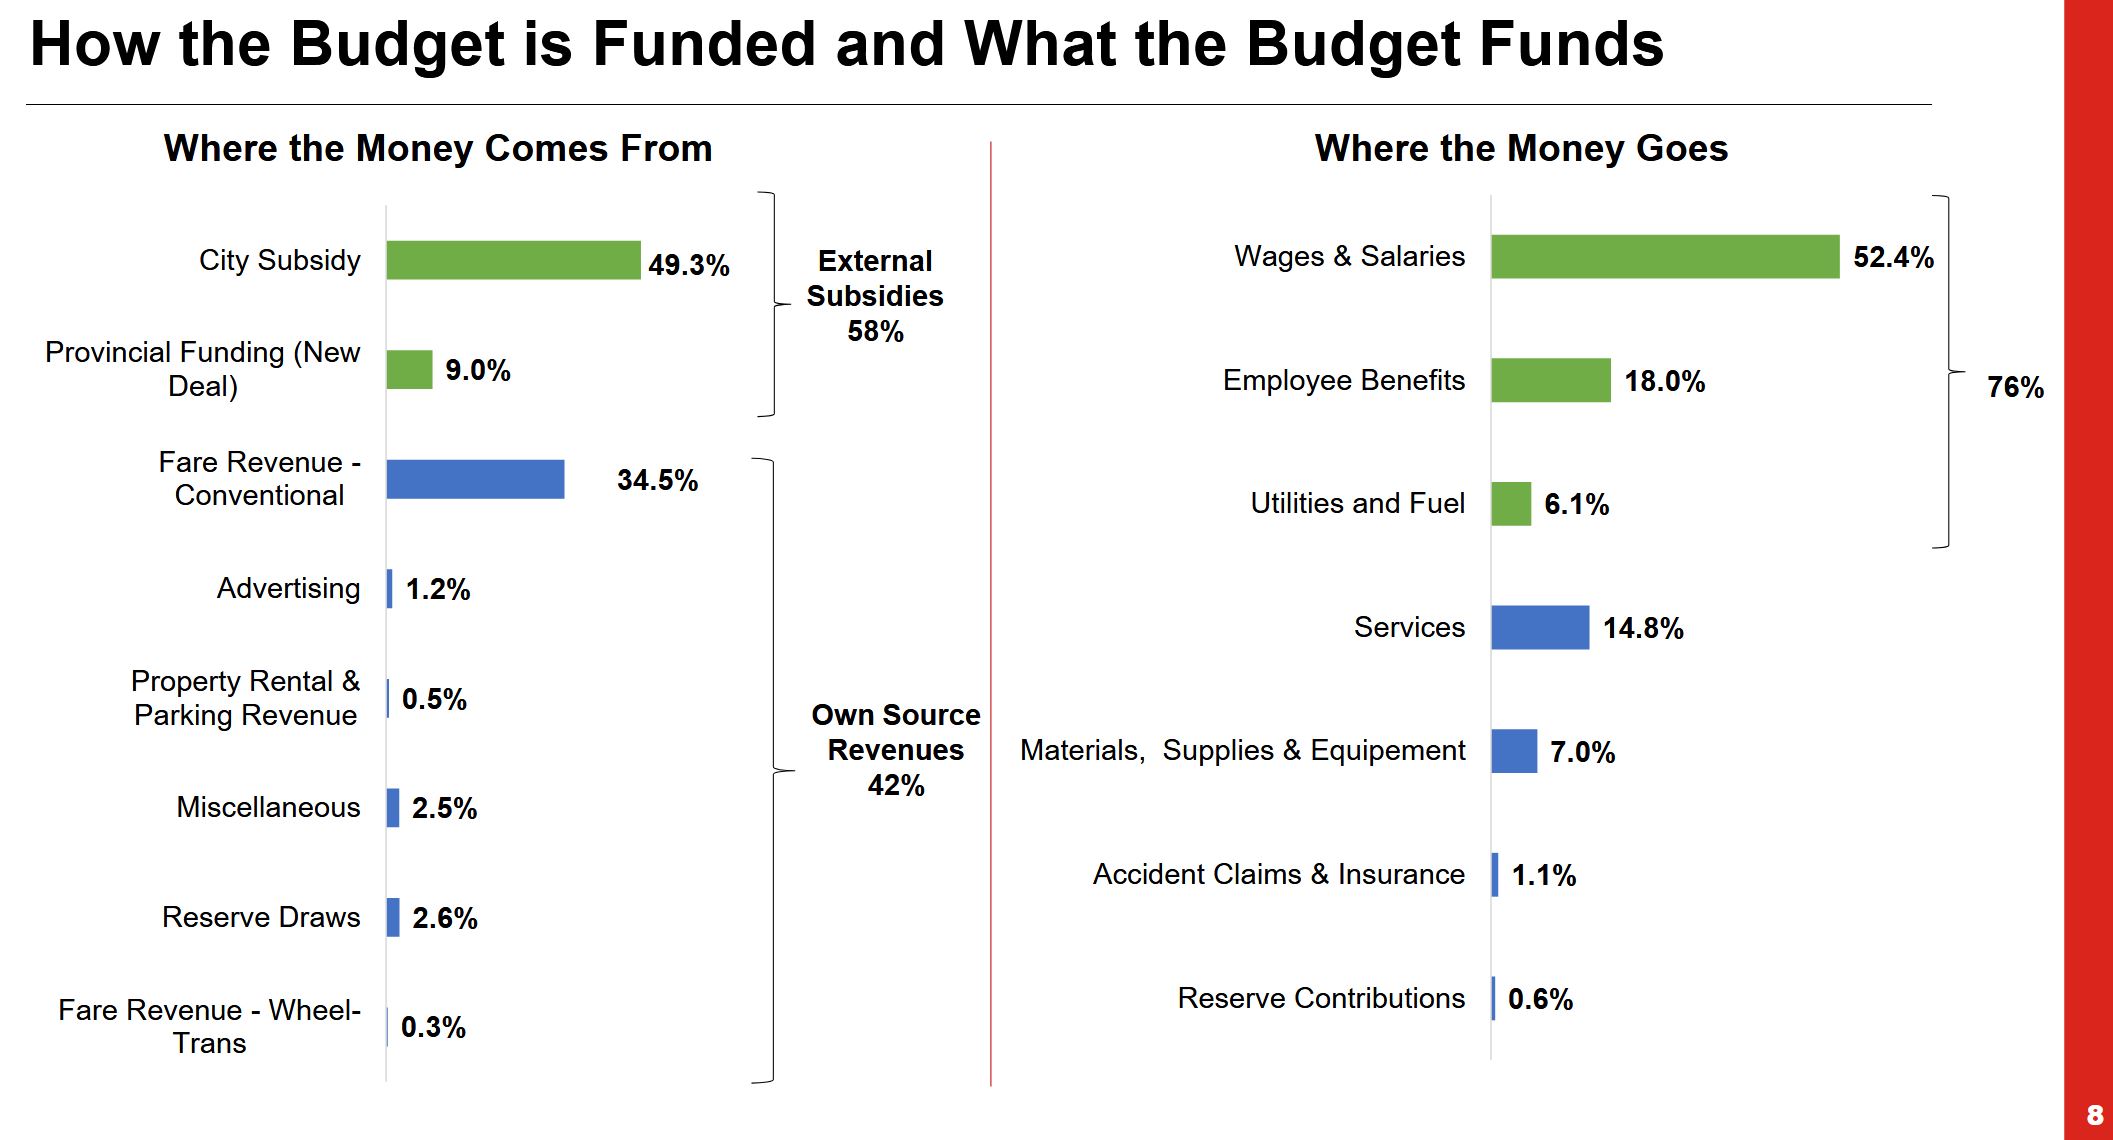
The revenue/cost ratio for the TTC is now 42%, and that number includes some ancillary revenue beyond the farebox. It is no longer possible to paint TTC as a woefully undersubsidized agency. Riders once paid 60% of costs with another 6% coming from sources such as advertising. Indeed, the City of Toronto will pay more in subsidy in 2026 than the TTC will receive from fares.
Note how small the ancillary revenues are in the table below. Budget debates spend excessive time on how the TTC could be so much better off if only there were more ads, or revenue generating schemes such as shops in stations. This is all very small change compared to overall funding needs, but fixating on minor revenue schemes avoids hard decisions about spending on quality service.
The initial service is described as a “soft opening”:
Following the recommendations of the Ottawa LRT public inquiry, Line 6 Finch West will operate under “soft opening” conditions with trains running from 6 a.m. to 10 p.m. until Spring 2026. The temporary early closing will provide the line’s maintainers, Mosaic Transit Group, with an extended maintenance window, allowing staff to become more familiar with the line and monitor it for any issues while in full revenue service.
The service level of 15 trains on a 6’30” headway implies a round trip time of 97’30”.
Fifteen fully accessible trains will operate during weekday morning and afternoon rush hours, with service every six and a half minutes. At all other times, including weekends, trains will arrive approximately every 10 to 12 minutes. [TTC media release]
By comparison, the 36C Finch West bus has an AM peak round trip time from Finch West Station to Humberwood Loop of 116 minutes, and a PM peak RTT of 138 minutes. These times include recovery time at terminals. The peak period scheduled time between Humberwood Loop and Humber College Station for buses is 8 minutes, and so for comparative purposes, 16 minutes should be deducted from the bus running times to compare with the LRT. TTC has not yet published off-peak travel times or train counts.
This adjustment reduces the AM peak round trip time for the 36C bus to 100 minutes and the PM peak time to 122 minutes, as against 97.5 minutes for the LRT. The greater saving comes when the exclusive lanes on Finch give an advantage over bus speeds, although one might have hoped for better in the AM peak. The wider headway (interval) between trains will add waiting time, and it remains to be seen if the TTC can avoid its usual bunching and gaps that plague every major route in the city.
36 Finch West bus service design effective November 16, 2025:
As more information emerges, I will update this post.
This article reviews the change in travel times and speed profiles on 510 Spadina, 511 Bathurst and 512 St. Clair between October 2019 and October 2025 (pre- and post-pandemic). In almost every case, streetcars are slower today than they were six years ago even though two of the three routes have reserved lanes.
511 Bathurst will soon have red lanes from Fleet to Bloor (except for a section north of Dundas), and I will publish updated charts for that route when the lane changes are in place.
By October 2019, streetcar service was almost completely operated with the new Flexity cars, and so the change over time is not explained with a comparison between the sprightlier CLRVs and the newer cars. (For 512 St. Clair, I have also included a comparison with the CLRV era to show the effect of the vehicle change separate from the pre/post pandemic change in traffic conditions.)
TTC is overly fond of laying blame for transit vehicle speeds on “traffic congestion”, but that is too simplistic an analysis especially for routes with reserved lanes. They also have a bad habit of presenting data without the granularity needed to identify patterns and problems by time of day and location. There are many charts in the main part of this article, but they are intended to show each route in detail.
One important point is that it is impossible to know how much change in speed comes from a more cautious operating philosophy as opposed to traffic conditions. There is, of course, the slow operation through junctions, but that does not explain slower travel on straight track with no special work. Traffic signal effects also show up, particularly in time spent holding nearside at intersections and then again at farside stops. Some areas are inherently slower than others such as Spadina from Queen south with many close-spaced intersections and signals that generally favour east-west traffic. The situation is particularly bad between Front and Queens Quay where the primary job of signals is to handle traffic to/from the Gardiner Expressway.
Any move to speed up operations on streetcar routes requires more than quick fixes like stop eliminations, and detailed block-by-block reviews are needed. In some cases there will be trade-offs between transit and other road users. Arguments for better priority will fare better if and when the TTC improves service so that there are actually transit vehicles to prioritize.