This article began as a Twitter/X thread responding to a post from Mayor Olivia Chow.
From the better way to the *best* way. This budget will restore 97% of pandemic-era TTC service cuts and get the city back on track.
There is a big problem with this claim, and I fear riders will be disappointed by what they actually see. Here is my consolidated thread.
It pains me to write this, but this post by Mayor Chow is simply not true. Either her spin doctors cannot read a budget, or she has been bamboozled by TTC’s misleading use of “restoring” service.
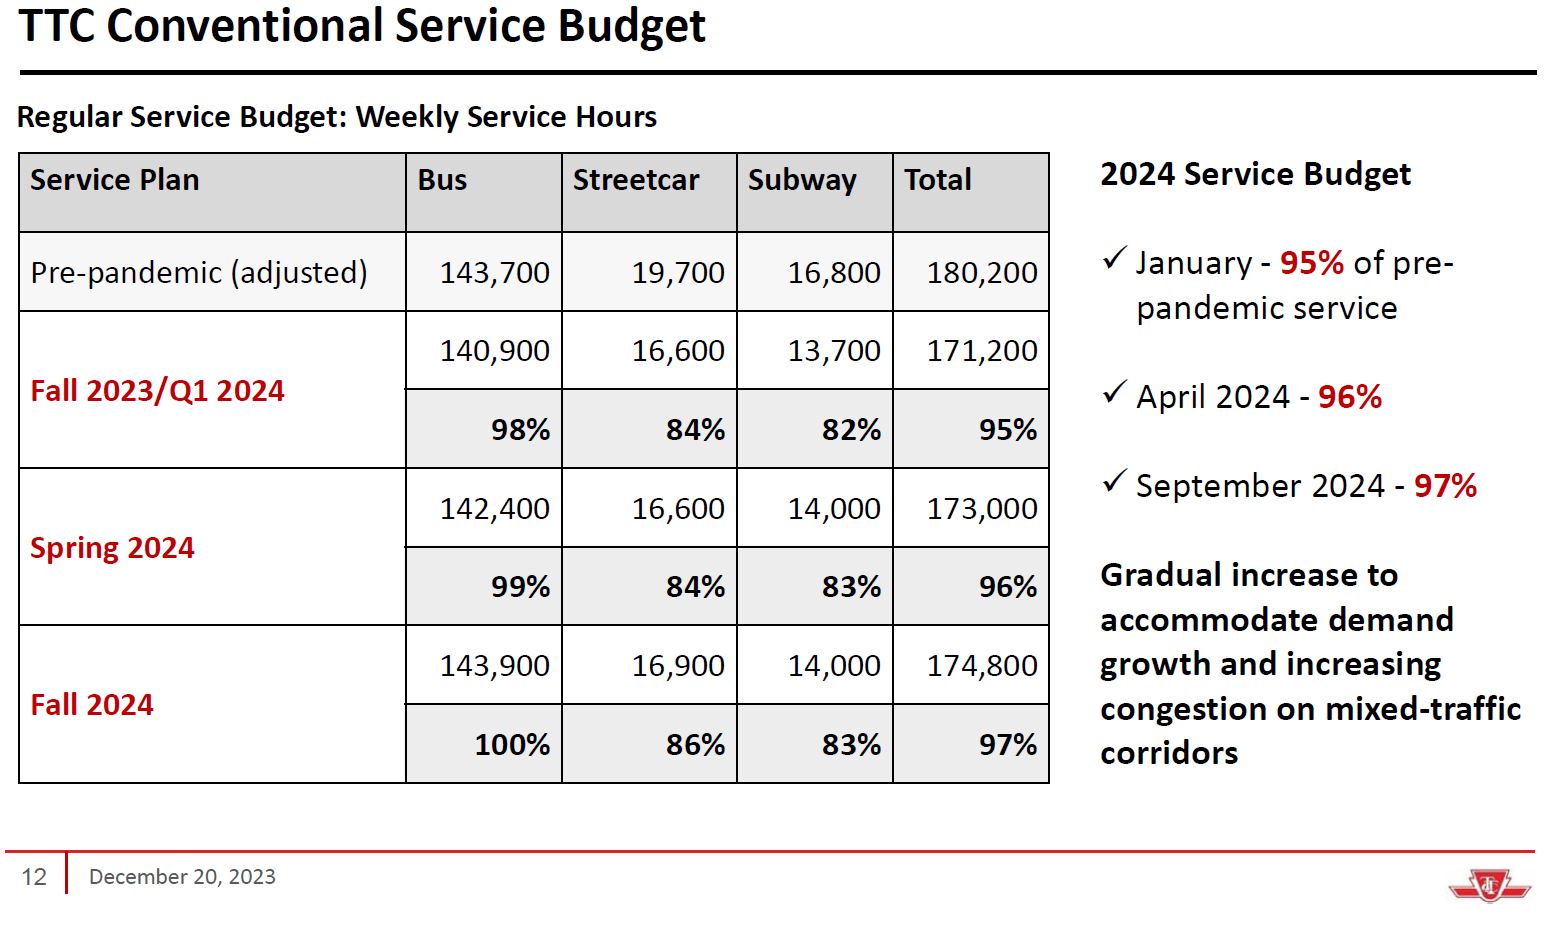
This chart is right out of the TTC budget and shows the planned service restoration by mode. Note that only the bus network gets back to 100%.
Because the values are based on vehicle and train hours, and buses (with relatively small capacity per vehicle) account for most of the hours, the total gets to 97% while leaving streetcars and the subway far behind.
But 97% is not really 97% as seen by riders. Many routes run more slowly than they did in 2019, and so it takes more hours to provide the same frequency and capacity of service.
For added clarity, “100%” of service hours will *not* reverse all pandemic era cuts because some hours go to routes running over 100% while others stay below that level. But spin doctors don’t do pesky details like that.
On top of that, crowding standards brought in by management without advance approval in 2023 mean that off peak service can be more crowded before triggering service improvements. These might be reversed in 2025 but only if there is budget headroom.
Talk about prepandemic service levels forgets that there were major problems with overcrowding and inadequate service back in 2019. Actual planned service in 2020 was higher than 2019, but was cut due to covid.
The shift in commute patterns means that total ridership is less than 2019 levels, but it is concentrated on a shorter work week. Off peak riding is already at or above former levels.
The TTC does not break out service frequency and capacity as metrics, but using vehicle hours hides deeper cuts in these areas.
The February 18 schedule changes include cuts on many routes which are described as “adjustments” on the TTC’s website. A few of these are erroneously called “improvements”.
One reason for the February cuts is that service in January was actually *over* budget and the cuts back that out.
The TTC has no public measurement of crowding conditions and service quality including gaps and bunching. That 97% number will be broadcast far and wide, but will hide many problems.
Service Budgets
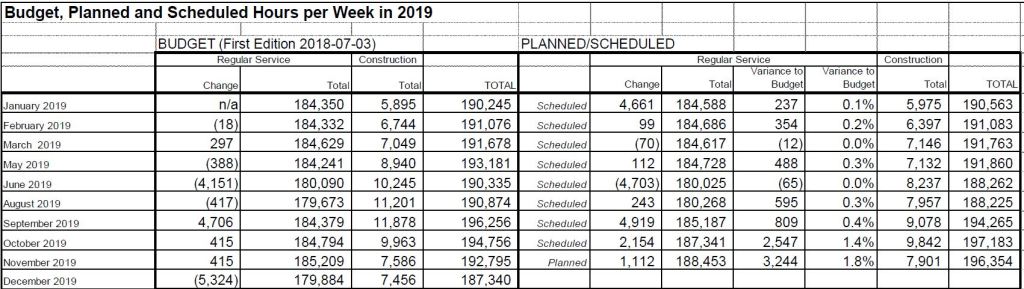
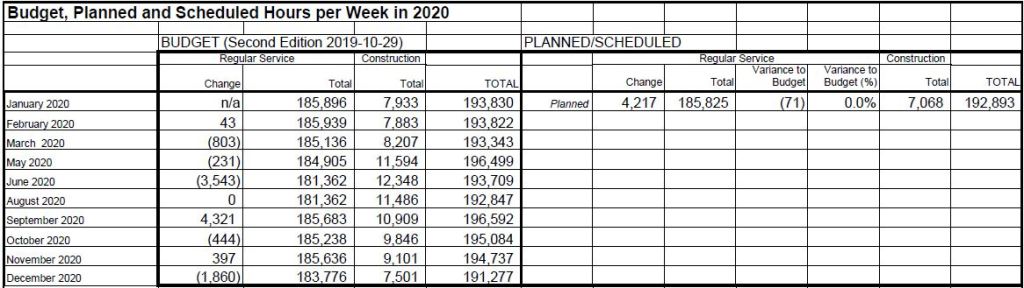
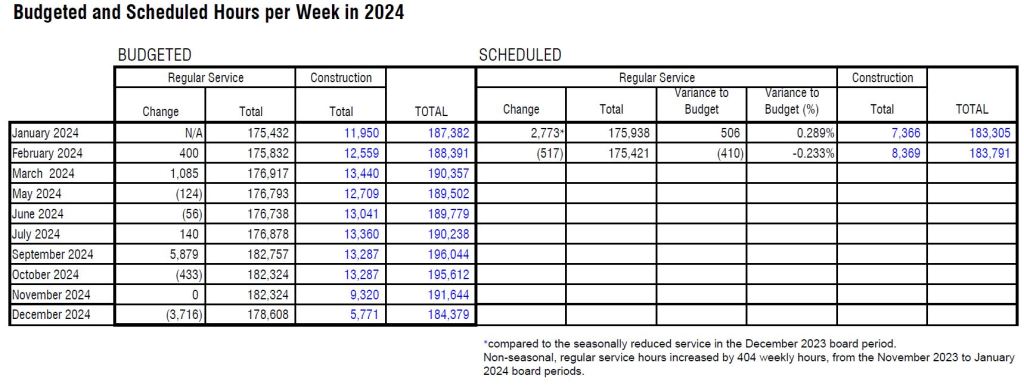
For comparison, here are the 2019, 2020 (pre-covid) and 2024 service budgets. The important column is the third from the left, “Regular Service Total”.
For a comparison of January 2024 service levels to January 2020, see this article:
There is work to be done, and a vital first step is to understand just what is needed and what is possible. The TTC Board plans a strategy session in March, and their Budget Committee will probably start meeting in June-July.
Soon I will publish an article about a Ridership Growth Strategy for 2024 that will set the stage for the kind of debate that should be on the agenda.
Can we hope that these meetings will not be consumed by self-serving management dog-and-pony shows, but rather will be an open discussion of the state of and options for our transit system.
The TTC will modify service on many routes effective Sunday, February 18, 2024. Several of these changes involve “reallocation” of service between routes and time periods, and overall there will be a small decline in scheduled vehicle hours.
One concern about this process is that the TTC has stated that it would only impose the new, more crowded, off-peak loading standards when changing schedules, but would not retroactively cut service based on the 2023 management-imposed values. With many routes seeing service trimmed, we do not know what the new target crowding level will be because the TTC has not published this information for several years.
There will also be some adjustments for service reliability. These generally involve giving vehicles longer travel times with resulting wider headways on affected routes. In some cases, service does improve because extra time that had been allocated for construction effects is removed.
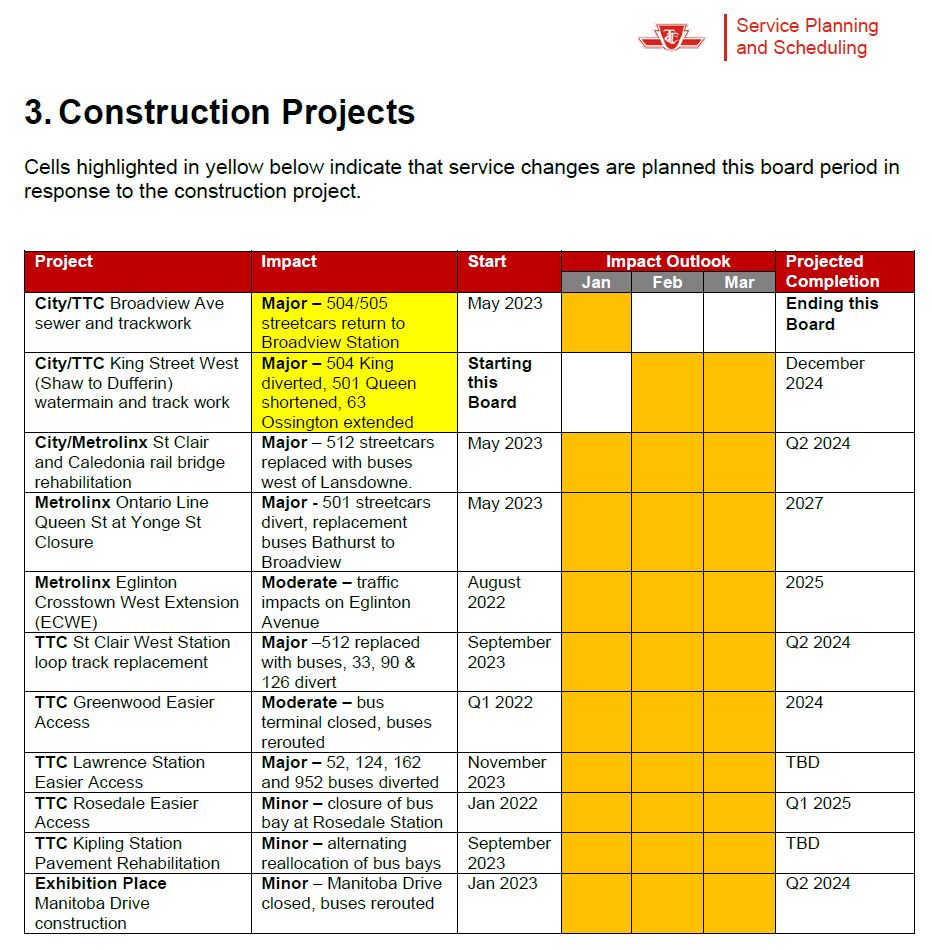
The table of construction projects affecting transit service is shown below. This does not include ongoing works on the subway system and slow orders for which there is no scheduled provision.
The major project beginning with this schedule period is the reconstruction of water mains and track on King Street West. This is the subject of a separate article:
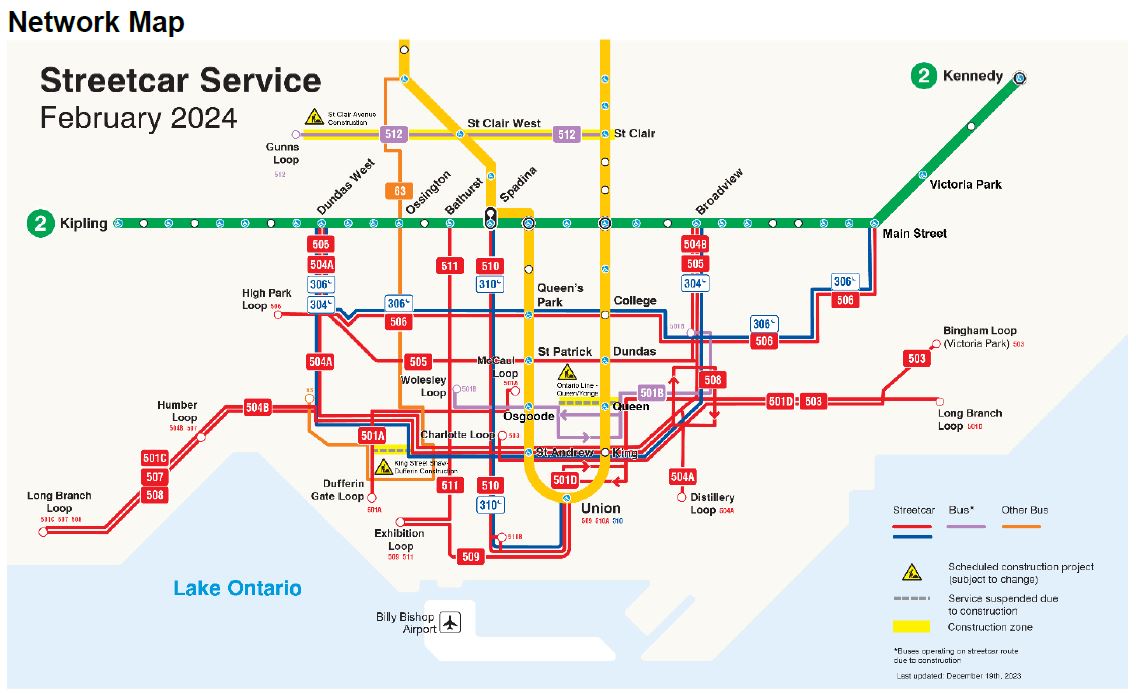
The configuration of the streetcar network is shown below.
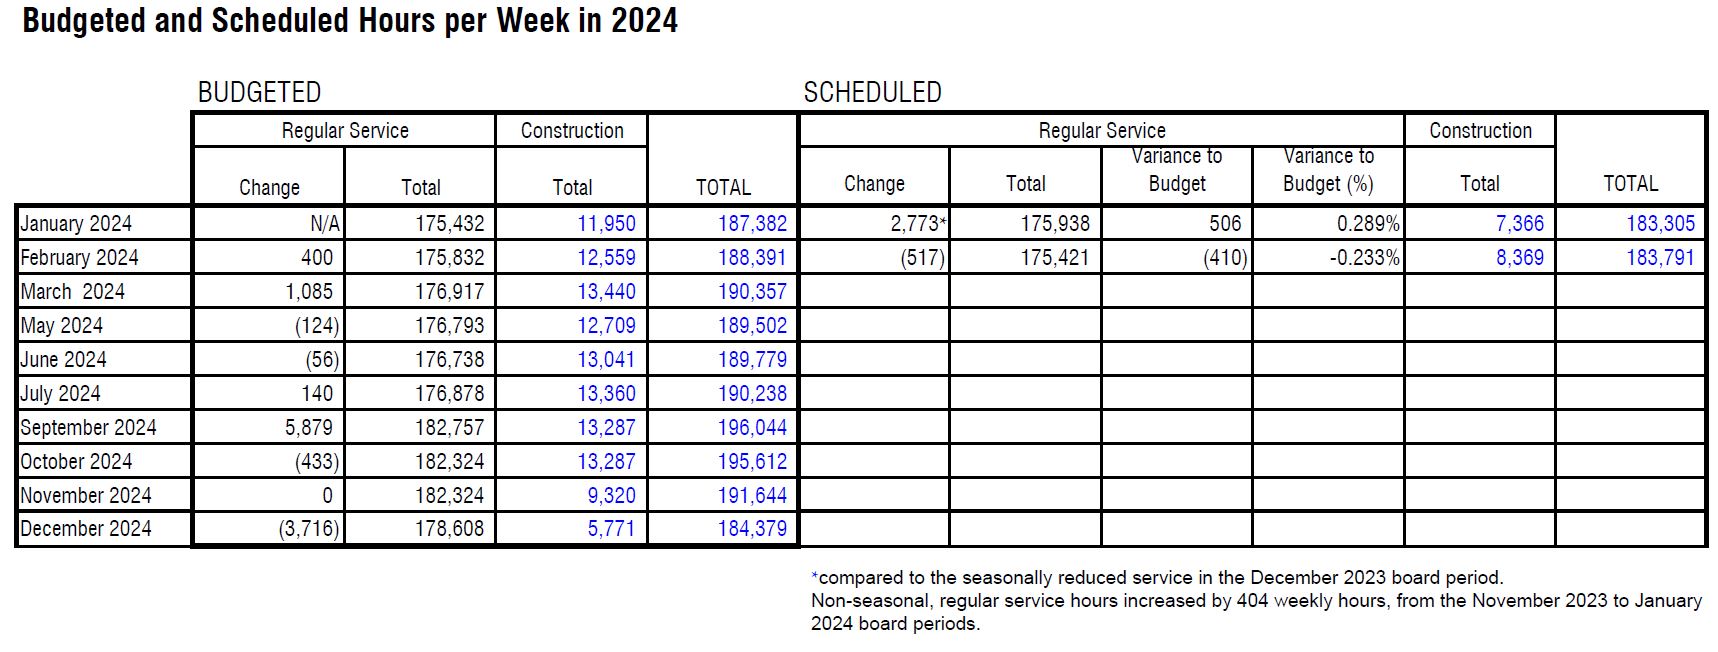
Scheduled vehicle hours will decline slightly with these changes in part to correct for an overage relative to budget in January. A small increase is planned for the schedule change in late March, and a large one in September. The drop shown for December is the usual effect of the holiday break and the removal/reduction of school services.
For those who have been wondering where my usual wrap-up of coming service changes is, it seems to be stuck in the managerial bowels of the TTC. A few weeks ago I was led to believe that its release was imminent, but as of the evening of February 11, crickets.
There is an online public event on the evening of Thursday, February 15 for which you can register via the City’s site. You can also subscribe to updates on the City’s page (the link is at the bottom).
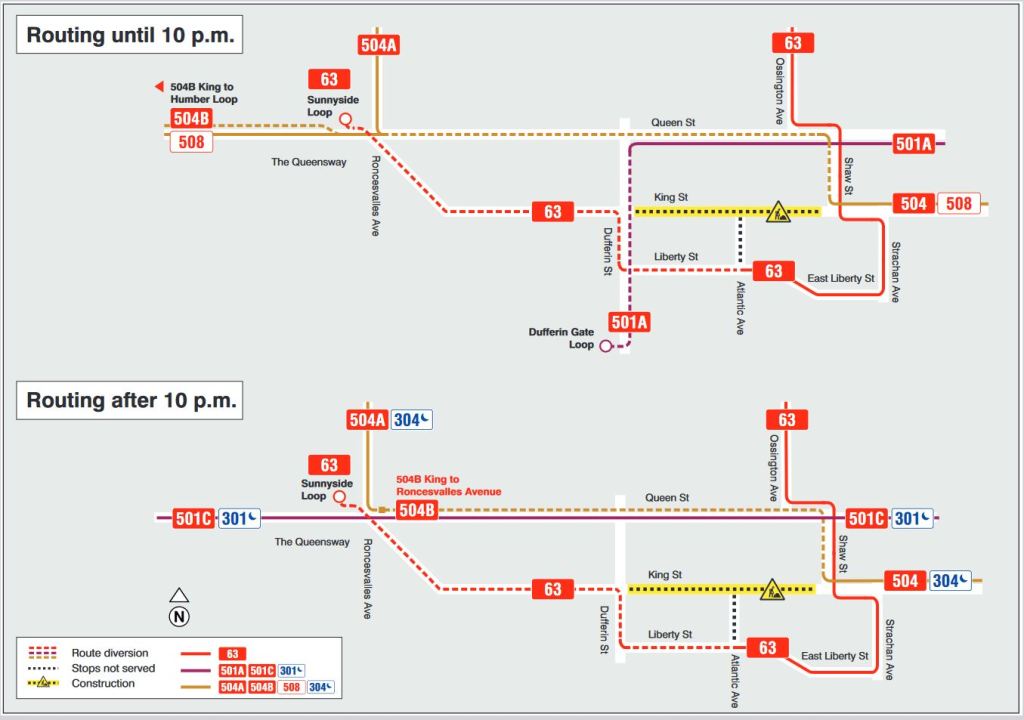
Major changes to routes in the Parkdale and Liberty Village area are coming on February 18, and the details have been posted for a while elsewhere. Time for me to catch up. When the service memo comes out, I will flesh this out with service frequency details. Here is a map showing the wandering routes in the west end.
King Street will be closed between Shaw and Dufferin for water main and track work. This is a multi-stage project, although from a transit point of view it will have two configurations.
Effective February 18, 2024:
King Street will close between Shaw and Dufferin. Various routes will change to provide service, such as they can.
63 Ossington will no longer loop northbound via Atlantic and King to Shaw, but will be extended west via Liberty, Dufferin and King to Sunnyside Loop west of Roncesvalles.
29/929 Dufferin routes are not affected at this stage of the project.
501 Queen will vary by time of day. The eastern terminus remains at McCaul Loop, but the western terminus will change.
Until 10pm, all 501 Queen cars will run only as far west as Dufferin Street, and they will turn south to Dufferin Loop (CNE Western Gate).
After 10pm, all 501 Queen cars will run through to Long Branch as they do now replacing the 507 Long Branch car.
301 Queen night car bus service will continue to operate between Neville and Long Branch.
504 King cars will also vary by time of day:
Cars on both the 504A and 504B branches will divert via Shaw and Queen to Roncesvalles.
504A Dundas West cars will run north to Dundas West Station at all times.
504B cars that would normally run to Dufferin Loop will run west on Queen.
Before 10pm, 504B cars will run through to Humber Loop replacing the 501 Queen service which will divert to Dufferin Loop.
After 10pm, 504B cars will terminate at Roncesvalles.
Note that streetcar service to Broadview Station will be restored and so the 504B cars will no longer end at Distillery Loop, but will run to their normal east end destination.
304 King night service will operate between Broadview and Dundas West Stations diverting via Shaw and Queen. [Updated Feb. 12 at 11:40am] The TTC media release confirms that the night service will operate with streetcars.
507 Long Branch service is not affected.
508 Lake Shore cars will divert via Shaw and Queen, but will otherwise operate on their normal route.
Effective Late June 2024
Note: The work at King & Dufferin has been postponed to 2025.
The intersection of King & Dufferin will close for complete reconstruction of the track. This will require changes in the 501 Queen and 63 Ossington diversions, as well as a revised south end for the 29/929 Dufferin services, but details have not yet been announced.
Effective August 2024
With the completion of work at King & Dufferin, routes should revert to the February configuration, but nothing is definite about TTC plans as riders know well. Stay tuned.
The work is supposed to continue until “early December” according to the TTC site, but until “November” according to the City site. Normally, the schedule change would occur in late November, and so it is not clear just what date they are aiming at. The usual December change is for the two-week holiday schedules just before Christmas.
Updated February 11, 2023 at 1:45 pm: In response to a reader comment, I have added illustrations from the City’s presentation deck showing the technologies used for traffic monitoring and analysis at the end of this article.
On February 9, 2024, Mayor Chow held a press conference to announce various changes coming to King Street and the success of the Traffic Agent program in taming congestion downtown, particularly on King.
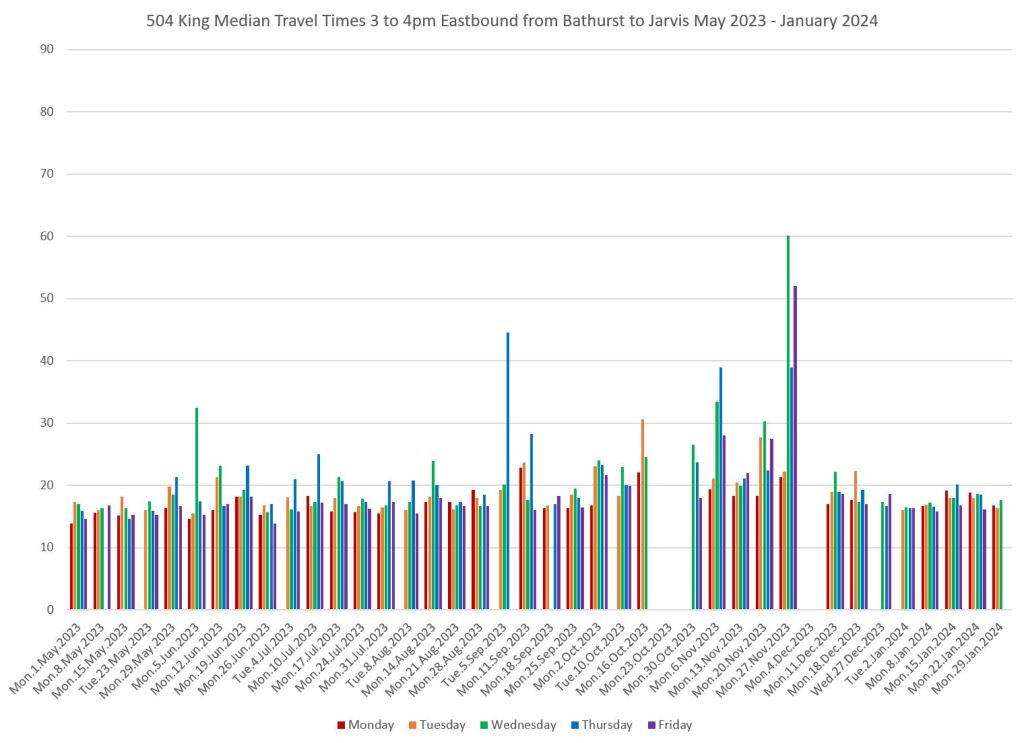
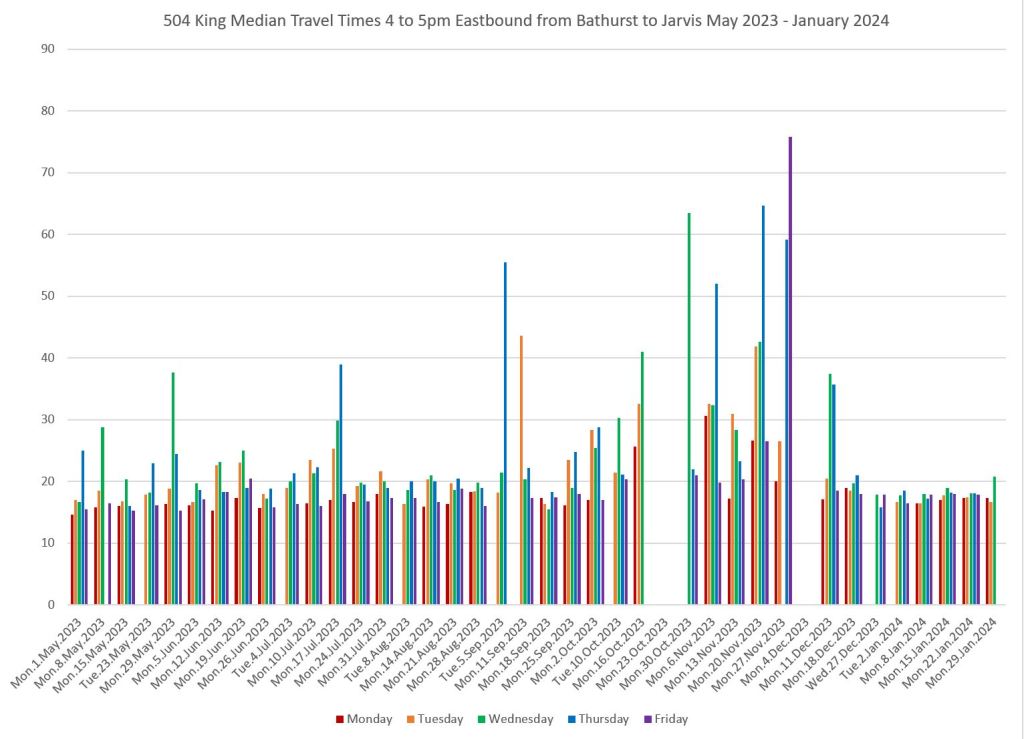
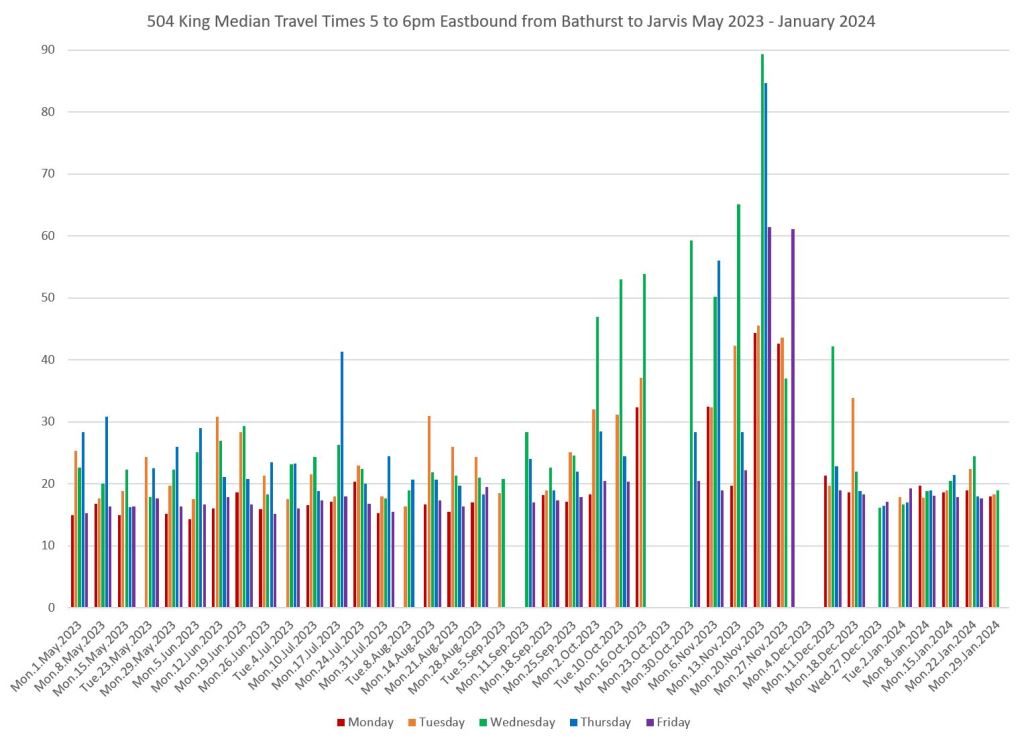
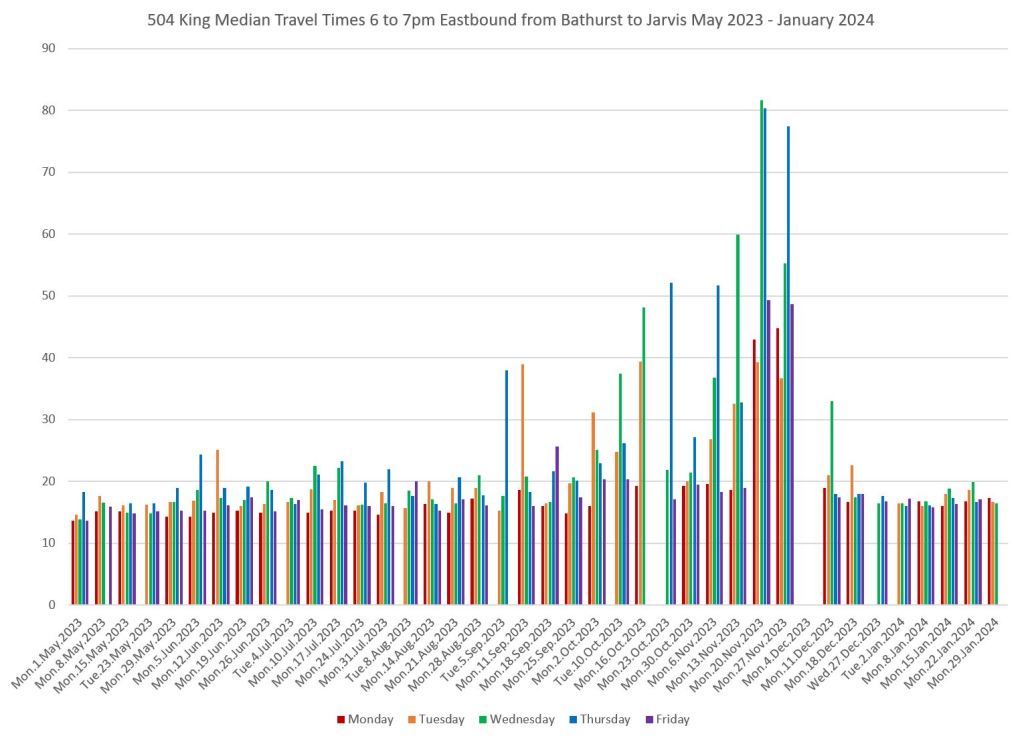
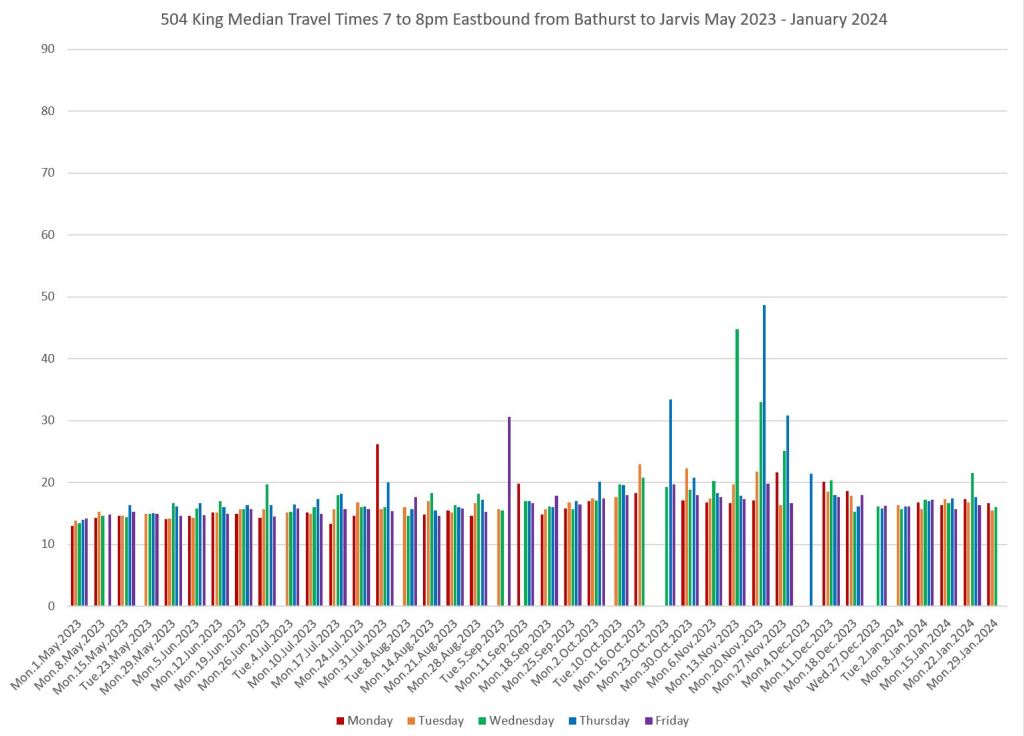
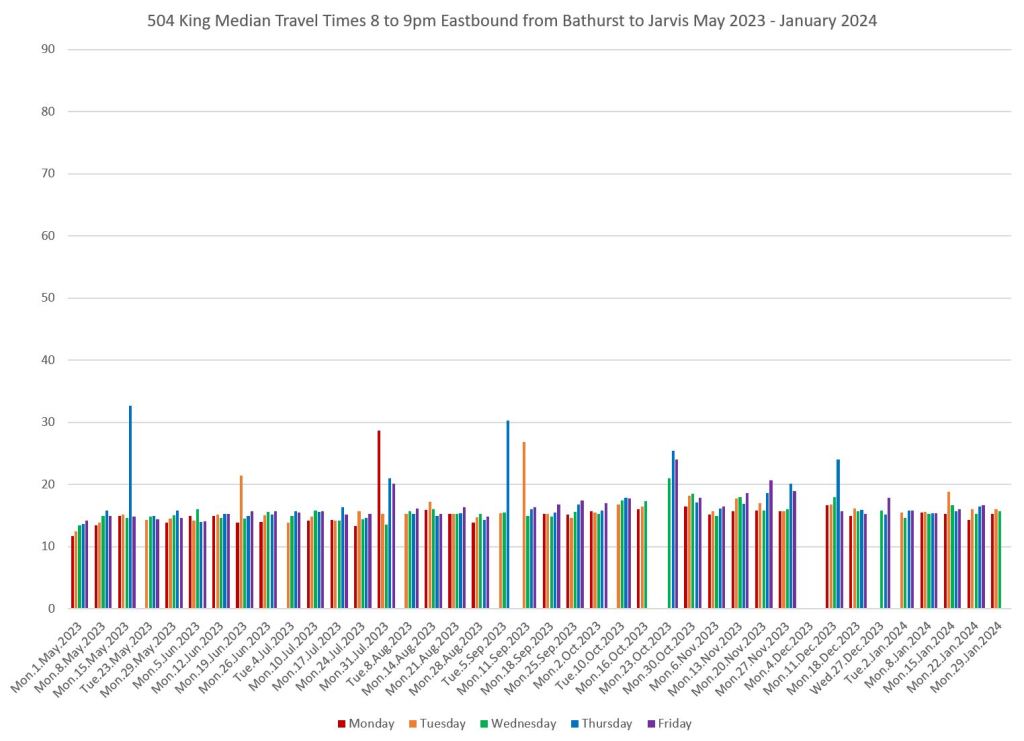
Regular readers will know the graphs below showing day by day travel times eastbound from Bathurst to Jarvis by hour from 3pm to 9pm. These charts have been updated with January 2024 data. (Note: Gaps in the charts in mid October and early December correspond to diversions via Church and Queen for water main repairs east of Jarvis. No streetcars covered the full Bathurst-Jarvis segment during these periods.)
The graphs illustrate the change in congestion levels peaking in the 5-6pm hour, but still quite evident in 6-7pm and to a small extent in 7-8pm. The build-up through the fall was caused by construction on Adelaide coupled with a complete lack of enforcement of the transit corridor and of “box blocking” at major intersections where cars enter but cannot cross in the allotted green time. With the introduction of Traffic Agents to enforce the rules on November 27, 2023, the street ran much more smoothly and the peak in congestion vanished.
These charts are intended to show how travel times in many cases have been growing since the early days of the pandemic in March 2020. Where I have them, there is a small amount of pre-pandemic data for comparison.
In most cases, there is a notable drop in travel times in Spring 2020, with gradual growth thereafter. Drops for the year end holidays are common, but this was small in 2020 because isolation was still in effect. In 2021, there was a recovery followed by a combination of the drop for the holidays and the omicron wave. 2022 and 2023 saw bigger declines at the holidays. In some cases, the travel times in January 2024 are higher than the pre-pandemic values.
The Spring 2020 values are likely as good as one can expect from any transit priority scheme as they show the travel times of buses unencumbered by either traffic or heavy passenger loads.
Where the 85th percentiles (orange) spike well above the medians (blue), this shows the day to day variability in travel times that are particularly strong on Steeles West.
An important distinction lies in the location of time savings. Transit priority might not be present over an entire route, and a more detailed review of these data will show the locations of the critical segments. I have not included them here to avoid making an over-long article, but I will bring out more of that analysis as the City gets more deeply in route-specific studies.
A challenge for planners and traffic engineers is that the problem locations are likely to be the hardest to “solve” in the sense that they have the lease spare capacity, if any, to reallocate to transit. Conversely, there are areas where transit priority will make little difference because the road is uncongested most of the time, and signals are not a source of delay. Fine-grained study is essential to any new RapidTO plan.
In the first article of this pair, the charts ended at December 2023, but by the time I was working on this piece, the January 2024 data were also available and have been included.
In the case of routes already operating on red lanes in Scarborough (86/986 Scarborough, 116 Morningside and 905 Eglinton East Express), travel times have grown since 2020, but it is impossible to know how much they might have grown in the absence of transit priority measures other than by analogy to other corridors where conditions might not match.
Updated February 7, 2024: The charts for 116 Morningside have been updated to include data from late October to December 2020 that was omitted from the original version.
At its January 24 meeting, the TTC Board received a report and presentation on maintenance work and closures planned for the subway and streetcar system in 2024, plus a preview of 2025.
The report has long tables of events organized by date, but to make things a tad easier to find, I have grouped items by affected area in this article.
Subway closures come in various flavours with the most disruptive being full weekend for major work such as replacement of turnouts (switches and frogs) at junctions such as centre track entrances/exits and leads to yards, or renovation works that cannot be completed in an overnight shift. Other works only require early closing of a line to allow for a longer work shift.
All dates shown below are subject to change, but the schedule gives a sense of the timing and amount of work. (SSE) and (OL) refer to works for the Scarborough extension and Ontario Line respectively.
There are no projects planned on Line 4 Sheppard.
Riders may have thought that the end of the Line 1 Automatic Train Control (ATC) project and the near completion of Line 5 Crosstown might have brought a reduction in subway closures. However, a large amount of track and structural repair in 2024 consumes much of the calendar. This is particularly true for the Spadina branch of Line 1, and the east end of Line 2 which is also affected by both the Ontario Line and the Scarborough Subway Extension.
On the streetcar system, riders in Parkdale will face changes to 504 King, 501 Queen and 63 Ossington for most of the year while water main and track repairs occur on King from Shaw to west of Dufferin. In the east, there will be work for the Ontario Line that will close Queen Street for brief periods. There are many projects for overhead reconstruction as the pantograph conversion progresses from an interim to a final state, but the TTC has not revealed which of these will trigger diversions, and which can be handled under service with off-hours work. Construction of the 501 Queen Ontario Line diversion downtown is planned at a glacial pace extending to Labour Day.
No diversions/substitutions have been announced for any of the streetcar projects.
Updated Feb. 5, 2023 at 6pm: Metrolinx has clarified aspects of the One Fare operation on Presto. See the end of this article for details.
Updated Feb. 5, 2023 at 6:30pm: The TTC has an extensive FAQ page about One Fare.
On February 5, 2024, Ontario announced that it will extend the co-fare arrangements between GO Transit and local municipal transit systems outside of Toronto to the TTC. The branding for this scheme is “One Fare”.
As of February 26, any trip including GO Transit will be discounted by the removal of local transit fares at either end of the journey. Trips beginning or ending on a local system will only pay the GO Transit fare.
Trips using only local systems (such as TTC+Miway) will pay the local fare on the system where they begin, but will transfer free onto any connecting system.
This arrangement corresponds to “Option A” in the Metrolinx Initial Business Case Final Report detailed in a previous article here.
Timed transfers will be valid for 2 hours for trips starting on a local system, and for 3 hours for trips starting on GO Transit. The Metrolinx announcement is not clear about whether a trip beginning on local systems but shifting to GO gets the expanded 3 hour window from paying a GO fare. In effect, does the tap on to GO “top up” the remaining transfer time with an extra hour, or does starting on a local bus fix the transfer window at two hours. I have asked Metrolinx for a clarification.
Update: See the end of the article for further information on the transfer window.
The new fare scheme will be funded by Ontario and local systems will be reimbursed for the foregone fare revenue. The anticipated ridership growth is about 8 million per year.
The anticipated saving for riders, on average, is $1,600 per year. That corresponds roughly to two local transit fares per weekday.
There will be no change in fare payment procedures. Riders will only tap on to the local systems, but must tap on and off for the GO Transit portion of the ride where the fare is distance based.
The provincial press release states “The government will continue to work with municipal partners to identify opportunities to make transit more seamless for riders by harmonizing discounted fares and other measures.” What this will actually entail remains to be seen.
Update: Metrolinx Clarifies One Fare Issues
The following responses were provided by Metrolinx in response to my queries.
On transfer windows:
The initial two-hour window begins when the customer first taps onto the local transit service. When a transit rider transfers and taps onto GO Transit, a new three-hour window begins. For example, a customer who takes an HSR bus (local transit) and then transfers to GO Transit starts with a two-hour window upon their first tap on the HSR bus. When they tap onto GO Transit, a new three-hour window begins.
On the monthly pass:
PRESTO transit passes for TTC, Brampton Transit, Durham Region Transit, MiWay and York Region Transit are eligible under Ontario’s One Fare Program. Please note, customers transferring to GO Transit using a transit pass will not receive any additional discount using a transit pass.
On concession fares:
Customers also benefit from concession fares through Ontario’s One Fare program because the second fare is always free on local transit, or reduced on GO Transit. For example, in the case of a senior, if the customer begins their journey on the TTC and they transfer to YRT, they pay only $2.25 (the TTC fare) because the second fare is free on local transit. This saves them $2.40 on the trip. On a TTC to GO Transit trip, in the case of a senior, the GO fare would be reduced.
Metrolinx Media Relations Email of Feb. 5/24
It is possible that the GO Transit fare is less than a TTC fare, for example for a short GO trip by a senior where the TTC fare is $2.25 and the GO fare (using Union to Long Branch as an example) is only $2.13.
The TTC FAQ clarifies that the UP Express is not part of One Fare due to technical constraints. It is not clear when or if this will be fixed.
Thanks to reader Adam Chojecki for providing the link to the TTC page.
Anyone who deals with Metrolinx from the outside knows that getting information can be a real struggle, but every so often the veil of secrecy lifts, although not always intentionally.
The implementation of “regional fares” is supposed to happen in March 2024, but this will be on a fairly limited scale, at least according to anything published so far. The TTC will come into the same arrangement as the 905 systems with recognition of each other’s fares across the 416/905 boundary, and the reinstatement of a GO Transit cofare.
Like the elusive Toronto sun of recent weeks, a report appeared, and then disappeared on the Metrolinx website called Regional Fare Structure Initial Business Case Final April 2023. This is not a draft, but gives a sense of Metrolinx thinking on the subject and how little some of their fare objectives have changed over the years.
To be blunt, fare planning at Metrolinx has always eyed the Toronto subway as a “regional” facility and its riders as potential cash cows who will help fund other parts of the system. I wrote about this back in 2017-18.
A major problem with earlier proposals was that the Toronto subway was treated as a premium service, like GO, where riders should pay more for the speed and comfort compared to the surface system. This utterly ignored the fact that the TTC system is designed as a single network with subway lines as the backbone and feeder/distributor surface lines. The underlying reason for pushing up subway fares was to make the model revenue-neutral, in effect, to subsidize the elimination of extra fares for cross-border trips with more expensive subway rides.
That scheme would have seen any trip longer than 10km charged an extra fare, and that would have affected the vast majority of suburban commuters who already complained of long bus+subway trips to get to work and school. This idea appeared to die off, and with the ascension of the Ford government in 2018, nothing more was heard. Ford concentrated on large-scale capital projects, not on tinkering with fares.
In the Final version of the business case, the subway fare proposal has changed so that it would only apply to cross-border trips of 10km or more. This would have the effect of undoing part of the supposed benefit of the pending 905/416 fare boundary elimination where riders will not face an extra fare for the subway portion of their journey.
Future Richmond Hill riders look forward to a single fare to central Toronto, but this scheme might not be attractive as a 10km ride will only get them to roughly Yonge and Sheppard (8km for the Yonge extension, plus 2km on the existing subway). In the tariff modelled in the Final Report, the fare to Union Station would be $7.50. Similar issues face trips in other parts of the future rapid transit network.
Removing of the 416/905 fare boundary so that the TTC’s relationship with systems in the 905 and with GO becomes the same as every other system remains an option, but it is presented as the least attractive choice. The clear intent is to pave the way for higher subway fares for “regional” travellers while preserving the flat fare, for now, within Toronto. The political considerations are obvious, but so is Metrolinx’ intent to move forward in their implacable way. Both the Draft and Final versions of the report speak of a path from the current fare arrangements to a totally “integrated” future, albeit one that is not clearly defined.
Options with further levels of “integration” perform well as riding stimulants because they involve significant reduction in GO fares at a time when service will be increased through the GO Expansion program.
A major barrier to fare-by-distance on the subway is the need to “tap out” from the subway fare zone. This is not simply a question of putting Presto readers on the “inside” face of every fare gate, but of establishing fare lines between the surface and subway portions of stations. This has a substantial cost and creates a barrier to free flow for the vast majority of trips that would still pay a flat TTC fare, Moreover it would be a Trojan horse making future conversion of the subway within Toronto to a separate fare zone much simpler.
This is not a “fare integration” scheme, but rather a plan to increase GO rider subsidies while also setting the stage for subway fare increases. The idea of a revenue neutral change in the tariff has been abandoned, at least for now. The historic pattern emphasizing GO capacity for longer trips has been turned on its head to give GO rail a larger part in local travel within Toronto.
In order to sell this concept, Metrolinx now includes rebalancing the GO fare structure under the “integration” rubric. This is a completely separate issue and it should have been addressed years ago on GO independently from the cross border fare problems.
An intriguing caveat in all of this is that the Ministry of Transportation is listed as a “partner” in the study, and its conclusions will be referred to MTO for review. One has the sense of Metrolinx being on a short leash.
It is not surprising that this report was pulled from public view, but it is worth discussing because it reveals Metrolinx’ thinking. A document does not become a “Final” report, even if it is only a “Final Initial” version, without a lot of policy signoffs along the way.
Note: In this article, I use Draft and Final (capitalized) to refer to the two versions of the Initial Business Case.
On February 1, 2024, Mayor Olivia Chow announced her version of Toronto’s 2024 operating and capital budgets at Scarborough Town Centre Station. There are many parts to this budget, including a slight reduction in the proposed tax rate, but the location of the event was no accident.
After much hand-wringing, political gesturing and activism by would-be users, the uncertainty over the busway in the former Scarborough RT right-of-way is gone. Toronto will pay for the project, and the delaying tactic of waiting for provincial funding is over. The text below is from the Mayor’s proposed budget at pages 35-36.
This is a fairly common shuffle of funding allocations between projects, something that is relatively easy because:
the amounts involved are small on the scale of the overall capital budget,
some of the spending is beyond 2024, and
the primary source is a placeholder for future as-yet uncommitted work.
What is needed now is a sense of urgency by the TTC to make every possible change in their project timetable to get things moving now. This could include:
Identifying work that can proceed without the mini Environmental Assessment known as a “TPAP” that will consume six unexpected months. Obvious candidates for this are the removal of existing SRT infrastructure – track, power, lighting – and demolition work at Lawrence East Station so that buses can pass through the station.
Examining whether the project can be split into south and north stages with the Lawrence to Eglinton section opening first. This would give some of the busway’s benefit including direct access to Kennedy Station as early as possible.
A change in focus is needed from delay, a common tactic in the Tory era to sweep budget problems under the rug, to creating the most expeditious project plan.
Transit planning should be about ambition and what we can achieve, not endless excuses and the deadly words “Tomorrow and tomorrow and tomorrow …”.
At the time, detailed reports from the technical investigation were supposed to appear in “a few weeks”, but there has not been any public presentation of this material to the TTC Board.
To my surprise while hunting down reports about the Scarborough RT busway, I found the derailment investigation reports well hidden on the TTC’s site. To see them, you have to:
Go to the Projects and Plans page which is accessed through a footer menu on every TTC page. Yes, right down at the bottom.
Scroll down to The Future of of TTC’s Line 3 Scarborough (SRT).
Scroll down within that page to News Releases, Reports & Community Updates
Open that section and scroll down to November 16, 2023 (there is also one report listed under December 11, 2023)
Here you will find links to the following reports (which I provide here to save you the bother of chasing through the path above). The dates of the reports are shown together with those for earlier drafts in the change logs, where present.
Dated November 30, 2023 (Original version was dated October 10)
There is a lot of reading here, but the reports are more thorough and informative than the brief TTC overview since the accident. An important distinction the reports reveal is the degree to which identified issues were not at the single derailment site, but common to other parts of the line and to TTC maintenance practices.
Various reviews concluded that the problem lay with the reaction rail mounts and the ability of segments of this rail to move due to forces from the linear induction motors (LIM) on the SRT trains. Several factors contributed to this including:
The inherent tight clearances of the LIM design,
variations and errors in the selection and installation of reaction rail supports and rail components,
an inspection scheme that underrated the severity of problems and the necessity for prompt repairs,
the difficulty of inspecting reaction rail mounting hardware, and
the need for training of inspection and maintenance staff so that they understand the behaviour of track systems and the failure modes that they must prevent.
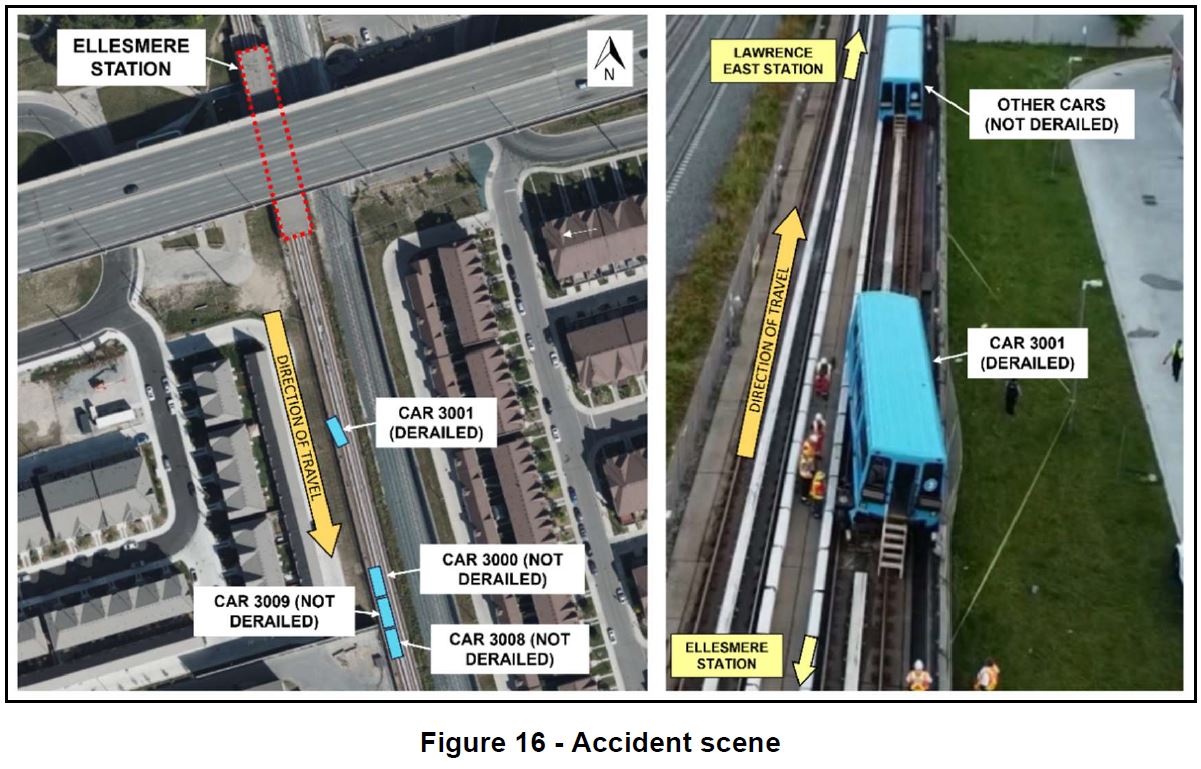
Of particular concern is that a reaction rail defect was reported two weeks before the accident at the derailment site, but it was assigned a low priority in the maintenance hierarchy likely because the severity of the problem was not understood.
There are lessons here for maintenance practices in general and I cannot help thinking that the recent detailed review of subway track geometry, resulting slow orders and repairs is partly in response to the problems discovered on the SRT.
I know that readers will not have time to plough through the full reports, but they contain details beyond what I have included here for those who are interested. This article is a summary of the main points together with an introduction to the SRT propulsion technology to put the other material into context.